A large multi-centre European study validates high-sensitivity C-reactive protein (hsCRP) as a clinical biomarker for the diagnosis of diabetes subtypes (original) (raw)
Abstract
Aims/hypothesis
An accurate molecular diagnosis of diabetes subtype confers clinical benefits; however, many individuals with monogenic diabetes remain undiagnosed. Biomarkers could help to prioritise patients for genetic investigation. We recently demonstrated that high-sensitivity C-reactive protein (hsCRP) levels are lower in UK patients with hepatocyte nuclear factor 1 alpha (HNF1A)-MODY than in other diabetes subtypes. In this large multi-centre study we aimed to assess the clinical validity of hsCRP as a diagnostic biomarker, examine the genotype–phenotype relationship and compare different hsCRP assays.
Methods
High-sensitivity CRP levels were analysed in individuals with HNF1A-MODY (n = 457), glucokinase (GCK)-MODY (n = 404), hepatocyte nuclear factor 4 alpha (HNF4A)-MODY (n = 54) and type 2 diabetes (n = 582) from seven European centres. Three common assays for hsCRP analysis were evaluated. We excluded 121 participants (8.1%) with hsCRP values >10 mg/l. The discriminative power of hsCRP with respect to diabetes aetiology was assessed by receiver operating characteristic curve-derived C-statistic.
Results
In all centres and irrespective of the assay method, meta-analysis confirmed significantly lower hsCRP levels in those with HNF1A-MODY than in those with other aetiologies (z score −21.8, p < 5 × 10−105). HNF1A-MODY cases with missense mutations had lower hsCRP levels than those with truncating mutations (0.03 vs 0.08 mg/l, p < 5 × 10⁻⁵). High-sensitivity CRP values between assays were strongly correlated (r 2 ≥ 0.91, p ≤ 1 × 10⁻⁵). Across the seven centres, the C-statistic for distinguishing HNF1A-MODY from young adult-onset type 2 diabetes ranged from 0.79 to 0.97, indicating high discriminative accuracy.
Conclusions/interpretation
In the largest study to date, we have established that hsCRP is a clinically valid biomarker for HNF1A-MODY in European populations. Given the modest costs and wide availability, hsCRP could translate rapidly into clinical practice, considerably improving diagnosis rates in monogenic diabetes.
Introduction
Genome-wide association studies (GWAS) have provided a significant breakthrough in understanding the genetic basis of type 2 diabetes, leading to a rapid expansion of the number of confirmed type 2 diabetes risk variants [1]. To date relatively few of these and other recent genomic findings have been translated into clinical applications [1]. However, one promising example of potential translation into clinical practice stems from GWAS reports that common alleles near HNF1A are associated with C-reactive protein (CRP) levels at the population level [2, 3]. There was a plausible biological basis for this observation, as the promoter of the CRP gene has two binding sites for hepatocyte nuclear factor 1 alpha (HNF1A), HNF1A is required for CRP expression and the _Hnf1a_-knockout mouse has reduced Crp expression [4–6]. We hypothesised that large-effect, loss-of-function heterozygous HNF1A mutations that are causal for MODY might be associated with more substantial CRP reductions, and we recently confirmed this in a UK study [7].
An important question is whether this finding could be the basis of a diagnostic test for HNF1A-MODY. Mutations in HNF1A are the commonest form of monogenic diabetes in the UK, with a minimum prevalence estimated at 50–80 per million of the population [8, 9]. There are important clinical implications of establishing an accurate molecular genetic diagnosis of HNF1A-MODY. Low-dose sulfonylureas are the optimal first-line treatment [10] and screening of at-risk family members can be performed. Access to definitive but expensive diagnostic genetic tests is restricted; furthermore it is challenging to identify MODY patients whose clinical features have significant overlap with both common types of diabetes. Therefore most cases of HNF1A-MODY remain misclassified [8]. The identification of biochemical screening tools (ideally widely available and at low cost) to detect diabetes patients who are most likely to have an underlying HNF1A mutation would allow more targeted and efficient use of molecular genetic testing.
In our initial study, high-sensitivity CRP (hsCRP) showed promise as a diagnostic biomarker with a receiver operating characteristic (ROC) curve-derived C-statistic of 0.8 for differentiation of HNF1A-MODY from patients with young adult-onset type 2 diabetes [7]. This is clinically relevant as 3–4% of those with young adult-onset type 2 diabetes in fact have unrecognised HNF1A-MODY [11]. The purpose of this study was to assess the clinical validity of hsCRP as a diagnostic biomarker in larger numbers of individuals and to produce recommendations to guide clinical practice. We also aimed to address limitations of the previous study by: (1) including participants with hepatocyte nuclear factor 4 alpha (HNF4A)-MODY; (2) repeating an hsCRP measurement in individuals who had previously had a raised value; (3) assessing any association between HNF1A mutation position and hsCRP level; and (4) comparing several common methods of hsCRP analysis.
Methods
Participants
Full details of the recruitment criteria for the participants are described in the electronic supplementary material (ESM) Methods. We studied MODY patients who had a confirmed heterozygous mutation (sequencing performed in a certified diagnostic centre) in HNF1A (n = 457), GCK (n = 404) or HNF4A (n = 54), and were recruited from seven European centres (Table 1). In addition we studied individuals diagnosed at age ≤45 years with clinically labelled type 2 diabetes (n = 582). All MODY mutations were considered to be pathogenic on the basis of at least one of the following criteria: (1) absence of the variant in normal chromosomes; (2) published reports; (3) presence of a truncating mutation; or (4) co-segregation of the mutation with a MODY phenotype within the family. Of the UK samples, 31 HNF1A-MODY and all glucokinase (GCK)-MODY and young adult-onset type 2 diabetes cases were reported in the previous study [7]. Informed consent was obtained from volunteers in each centre following approval from local ethics committees.
Table 1 Numbers of participants with different diabetes aetiology recruited from seven European centres
Biochemical methods
Due to differences in individual local biochemistry laboratories, CRP was analysed using one of three commonly available high-sensitivity assays. This allowed an assessment of any effect that the specific hsCRP assay used may have had on the derived sensitivity and specificity thresholds to differentiate patients with distinct diabetes aetiologies. This study therefore represents an important evaluation of hsCRP as a screening tool in clinical practice. High-sensitivity CRP method 1 (hsCRP M1), a wide-range latex-enhanced immunoturbidometric assay on an ADVIA 2400 analyser (Siemens Healthcare Diagnostics, Frimley, UK), was used at a single laboratory at the John Radcliffe Hospital, Oxford, for samples from Denmark, Norway, Poland, Slovakia and the UK. High-sensitivity CRP method 2 (hsCRP M2), a latex-enhanced immunoturbidometric assay on a Konelab 60i analyser (Thermo Fisher Scientific, Vantaa, Finland), was used for samples from Finland and Sweden. High-sensitivity CRP method 3 (hsCRP M3), an immunonephelometric assay on the BN ProSpec analyser (Siemens Healthcare Diagnostics, Erlangen, Germany), was used to analyse samples from France. The working ranges of the assays were 0.03–160.00 mg/l (hsCRP M1), 0.25–40.00 mg/l (hsCRP M2) and 0.16–10.00 mg/l (hsCRP M3). High-sensitivity CRP values below the lower working ranges of each assay were reported at this lower limit, i.e. 0.03 mg/l (hsCRP M1), 0.25 mg/l (hsCRP M2) and 0.16 mg/l (hsCRP M3). Between-batch estimates of imprecision, expressed as per cent coefficient of variation, were: 10.0% at 0.05 mg/l, 6.7% at 0.48 mg/l and <1% at 23.5 mg/l (hsCRP M1); <10% at >0.8 mg/l (hsCRP M2); and 3.1% at 0.5 mg/l and 3.4% at 2.1 mg/l (hsCRP M3).
Calculations
In line with previous studies, hsCRP values >10 mg/l were considered likely to represent an acute inflammatory response and were excluded from further analyses [7, 12, 13]. From 1,497 samples, 121 (8.1%) were removed as follows: seven (1.5%) HNF1A-MODY; eight (2.0%) GCK-MODY; three (5.5%) HNF4A-MODY; and 103 (17.7%) type 2 diabetes.
Statistical methods
Values of hsCRP from Denmark, Norway, Poland, Slovakia and the UK were combined, as these samples were all analysed in a single laboratory in Oxford, whereas data from France and Finland/Sweden are reported separately. Skewed data including hsCRP values are reported as medians and interquartile ranges. Non-parametric tests (Mann–Whitney, Kruskal–Wallis) were used to compare hsCRP values between groups. Data from all centres were combined in a fixed effects meta-regression (Hedges–Olkin approach) using the statistical package Comprehensive Meta-Analysis (www.meta-analysis.com). All other statistical analysis was performed in SPSS (version 17; SPSS, Chicago, IL, USA). Pearson’s correlation coefficient was used to assess correlations between continuous variables. The performance of hsCRP as a diagnostic test for HNF1A-MODY was evaluated using ROC curve analysis. A summary ROC curve was constructed to combine all hsCRP values using the sensitivities and specificities from each centre [14]. A value of p < 0.05 was considered to be significant.
Genotype–phenotype relationship
Age of diagnosis of diabetes is altered by the type and location of HNF1A mutations. In one study lower age of diabetes diagnosis has been shown to be associated with missense mutations in exons expressed in all three isomers HNF1A(A), (B) and (C) [15]. In another study, lower age of diabetes diagnosis was associated with missense mutations within the dimerisation and DNA-binding domains [16]. Therefore we tested the effect on hsCRP levels of: (1) the isomer of HNF1A affected; (2) the functional domain of HNF1A affected; and (3) the type of HNF1A mutation. HNF1A mutations were grouped as: exons 1–6 [affects isomers HNF1A(A), (B) and (C)]; exon 7 [isomers HNF1A(A), and (B)]; and exons 8–10 [isomer HNF1A(A) only]. Mutations were also grouped according to the functional domain affected (dimerisation, DNA-binding or transactivation). Mutations were classified as either missense mutations resulting in amino acid changes or those predicted to generate a premature stop codon, i.e. truncating mutations. The latter group includes nonsense, frameshift and splicing mutations. To account for non-independence, these analyses were restricted to a single individual from each family.
Comparison of hsCRP assays
A preliminary assessment of hsCRP assay comparability was undertaken at the John Radcliffe Hospital, Oxford, and assessed using the Passing–Bablock regression method [17]. Using hsCRP M1, we re-analysed 26 samples from Sweden/Finland (originally analysed using hsCRP M2) and 30 samples from France (originally analysed using hsCRP M3).
Repeat of previously elevated CRP results
In our previous report, 90 (11%) cases (including three with HNF1A-MODY) who had hsCRP >10 mg/l were excluded. We repeated the hsCRP measurement in 22 of these individuals. Repeat testing was not possible on those with elevated hsCRP values from the other European centres.
Results
High-sensitivity CRP results
Results of hsCRP analysis are summarised in Fig. 1 and detailed in Table 2. In each centre and irrespective of the assay used, hsCRP levels were significantly lower in individuals with HNF1A-MODY than in those with other diabetes aetiologies. The hsCRP levels associated with the respective diabetes subtypes varied between centres. This partly reflects the specific hsCRP assay used (for example the median values of the HNF1A-MODY cases cluster at or near the assay’s lower reporting limit). Meta-analysis, excluding the previously reported UK samples, confirmed that hsCRP levels were lower in HNF1A-MODY than in other diabetes subtypes across the other six centres (z value −20.5, p < 5 × 10−93) [7]. Meta-analysis across all samples concurred with this result (z value −21.8, p < 5 × 10−105).
Fig. 1
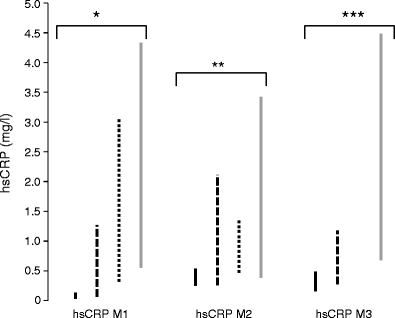
Interquartile ranges of hsCRP (mg/l) by diabetes aetiology using three analytical assays for samples from Denmark, Norway, Poland, Slovakia and the UK (hsCRP M1), Finland and Sweden (hsCRP M2), and France (hsCRP M3). Values of hsCRP >10 mg/l were excluded. Kruskal–Wallis tests were used to calculate p values between groups; *p = 3.3 × 10−72, **p = 4.7 × 10⁻⁹ and ***p = 5.3 × 10⁻¹⁸. Continuous black bars, HNF1A-MODY; dashed bars, GCK-MODY; dotted bars, HNF4A-MODY; continuous grey bars, type 2 diabetes
Table 2 HsCRP results
Clinical characteristics and hsCRP levels
The clinical characteristics of the participants are shown in ESM Table 1. Clinical variables significantly differed between the aetiological groups in line with previous studies [18]. Fasting plasma glucose (r 2 = 0.04), age of diabetes diagnosis (r 2 = 0.08) and BMI (r 2 = 0.23) were significantly correlated with hsCRP levels (p < 0.05). Adjustment for these variables did not affect the magnitude or significance of hsCRP differences observed between the groups; this is important, as any adjustment of the hsCRP value for use as a screening biomarker would be impractical. The effect of statin and/or aspirin therapy on hsCRP levels was examined. In HNF1A-MODY, HNF4A-MODY and young adult-onset type 2 diabetes cases the hsCRP levels were similar between statin and/or aspirin users and non-users (_p_ > 0.05). In comparison, participants with GCK-MODY taking statins and/or aspirin had higher hsCRP levels than non-users (1.78 vs 1.22 mg/l, p = 0.03). Thus, as reported previously, it seems unlikely that the use of these drugs in patients with other forms of diabetes would lower hsCRP towards the levels seen in HNF1A-MODY patients [7].
High-sensitivity CRP is a clinically valid biomarker for HNF1A-MODY
The differences in hsCRP values between HNF1A-MODY patients and other diabetes subtypes are statistically convincing, but this does not necessarily translate into a clinically valid biomarker. The ROC curve-derived C-statistic (measures discriminative accuracy) was calculated for unadjusted hsCRP levels. The C-statistic to distinguish HNF1A-MODY from other diabetes subtypes ranged from 0.72 to 0.95 across the centres and from 0.76 to 0.86 across the three hsCRP assays (Table 3). The C-statistic for HNF1A-MODY vs young adult-onset type 2 diabetes ranged from 0.79 to 0.97 across the centres and from 0.79 to 0.91 across the three hsCRP assays (Table 3, Fig. 2a). This indicates that hsCRP can reliably distinguish HNF1A-MODY from young adult-onset type 2 diabetes across European populations, even when different hsCRP assays are used. The hsCRP M2 and hsCRP M3 assays have lower discriminative accuracy, which is likely to reflect their less precise lower detection limits (0.25 and 0.16 mg/l, respectively, compared with 0.03 mg/l for hsCRP M1).
Table 3 ROC curve-derived C-statistic (95% CI) for discrimination between different diabetes aetiologies
Fig. 2
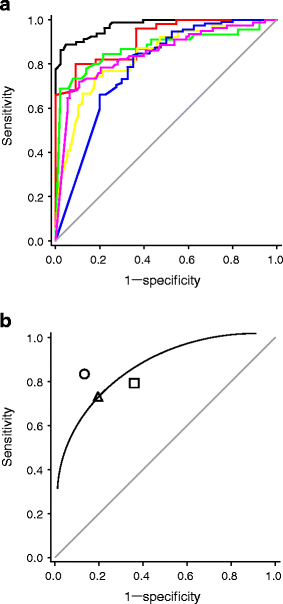
a ROC curves illustrate the performance of hsCRP in discriminating between HNF1A-MODY and type 2 diabetes patients across European centres (hsCRP values >10 mg/l excluded). Samples were from: Denmark (black line) (AUC 0.97); Norway (red line) (AUC 0.91); Poland (green line) (AUC 0.87); UK (yellow line) (AUC 0.83); Finland (blue line) (AUC 0.79); and France (purple line) (AUC 0.85). b Summary ROC curve combining all samples (hsCRP values >10 mg/l excluded). Samples were analysed by assay as follows: hsCRP M1 (circle); hsCRP M2 (square); and hsCRP M3 (triangle). The continuous line is the line of best fit
In samples from Denmark, Norway, Poland, Slovakia and the UK, a diagnostic threshold of 0.25 mg/l conferred 83% sensitivity and 86% specificity for distinguishing HNF1A-MODY from young adult-onset type 2 diabetes. This is revised to 81% sensitivity and 88% specificity if hsCRP values >10 mg/l are not excluded. Different hsCRP assays, i.e. those used to analyse the French and Finnish/Swedish samples, were associated with different thresholds for optimum sensitivity and specificity; thus a cut-off of 0.5 mg/l conferred 76% sensitivity and 81% specificity in French samples and 74% sensitivity and 68% specificity in Finnish/Swedish samples for distinguishing HNF1A-MODY from young adult-onset type 2 diabetes. It is likely that the higher hsCRP cut-off in the French and Finnish/Swedish samples reflects the different reporting ranges of the hsCRP assays used to assess these samples. The summary ROC curve, which was based on combining all unadjusted hsCRP values ≤10 mg/l irrespective of the assay used, indicated high sensitivity (78%) and specificity (80%) for distinguishing HNF1A-MODY from young adult-onset type 2 diabetes (Fig. 2b).
It is likely that a biomarker such as hsCRP would be most effective as a screening tool for HNF1A-MODY when used in conjunction with clinical features. In our previous report, the proposed strategy for selection of young adult-onset type 2 diabetes cases for genetic testing was either hsCRP ≤0.2 mg/l or fulfilment of traditional criteria for MODY testing (i.e. age of diabetes diagnosis ≤25 years plus two consecutive generations of diabetes) [7]. This resulted in ~80% sensitivity and specificity. In the current dataset, use of combined criteria, i.e. hsCRP ≤0.25 mg/l (hsCRP M1) or hsCRP ≤0.5 mg/l (hsCRP M2/ M3) or age of diagnosis ≤25 years, resulted in improved sensitivity for detection of HNF1A-MODY (~90%) without much loss in specificity compared with the sensitivity and specificity quoted above (ranged from 65% to 81% across assays).
We evaluated hsCRP as a biomarker to differentiate between MODY subtypes. The levels of hsCRP were significantly different between HNF1A-MODY and HNF4A-MODY cases, and between HNF1A-MODY and GCK-MODY cases (p < 5 × 10⁻⁴ and p < 0.005, respectively, for all pairwise comparisons across assays). The C-statistic for HNF1A-MODY vs HNF4A-MODY cases ranged from 0.77 to 0.93 across centres, indicating that hsCRP can discriminate well between these MODY subtypes. The C-statistic for HNF1A-MODY vs GCK-MODY cases ranged from 0.70 to 0.79, indicating that hsCRP confers less good discrimination between these MODY subtypes.
Genotype–phenotype relationship
Analyses excluded samples measured with hsCRP M2 and M3 due to the insufficiently precise hsCRP values for the majority of HNF1A-MODY individuals tested with these assays. ESM Table 2 shows the median hsCRP values reported according to mutation position. Analysis of mutation position by functional domain indicated that the hsCRP levels associated with mutations affecting the dimerisation/DNA-binding domains were significantly lower than those affecting the transactivation domain (0.03 vs 0.10 mg/l, p = 4.4 × 10⁻⁶). The effect of functional domain on hsCRP level was restricted to missense mutations only (0.03 vs 0.16 mg/l, p = 0.001), with no significant correlation noted for truncating mutations (p = 0.83). Analysis by mutation type showed median hsCRP was lower in HNF1A-MODY cases with missense mutations than in those with truncating mutations (0.03 vs 0.08, p = 1.5 × 10⁻⁵). The isomer affected had no effect on hsCRP (p = 0.25).
High-sensitivity CRP assay comparison
The comparison of hsCRP assays showed good agreement between hsCRP M1 and hsCRP M2 (r 2 = 0.91, p < 9 × 10⁻⁵), with no significant difference between values obtained from the two assays (p = 0.20) (Fig. 3a). Although there was good correlation between hsCRP M1 and hsCRP M3 (r 2 = 0.99, p < 8 × 10⁻²⁶), there were significant differences between the values obtained via these two assays (p = 0.001). Passing–Bablock analysis indicated a constant bias (intercept 0.32, 95% CI 0.03, 0.15) combined with proportional bias (slope 0.70, 95% CI 0.68, 0.75) between hsCRP M1 and hsCRP M3 (ESM Fig. 1). This means that the hsCRP values derived from hsCRP M1 were generally higher, except for values below 1 mg/l where hsCRP M3 generated markedly higher values (Fig. 3b).
Fig. 3
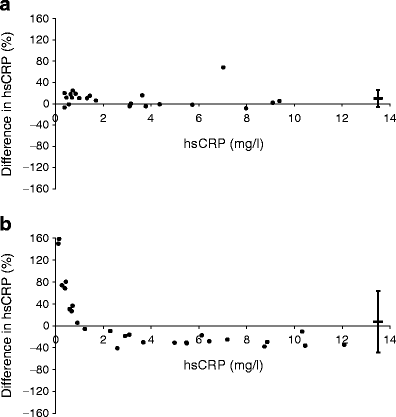
a Bland–Altman plot showing percentage difference in hsCRP results (mg/l) as measured by hsCRP M1 vs hsCRP M2 assays, and by (b) hsCRP M1 vs hsCRP M3 assays. Horizontal bars represent the mean bias with 95% limits of agreement shown by the vertical error bars
Repeat of previously elevated CRP results
Of the participants who had hsCRP >10 mg/l in the previous study, three HNF1A-MODY patients and 19 of the 42 with young adult-onset type 2 diabetes agreed to a repeat test after a minimum interval of 1 week [7]. ESM Fig. 2 shows the initial and repeat hsCRP results. One HNF1A-MODY patient and ten of 19 young adult-onset type 2 diabetes patients had persistently elevated hsCRP >10 mg/l. The repeat hsCRP values in two of the HNF1A-MODY patients remained well above the proposed threshold of 0.25 mg/l, and therefore these individuals would not have been offered genetic testing on the basis of hsCRP alone. Interestingly, only seven of 457 (1.5%) HNF1A-MODY patients in the current study had an hsCRP value >10 mg/l, which suggests that very few MODY cases would be missed even if those with initially high hsCRP values were not re-tested.
Discussion
In this study we confirm that individuals with HNF1A-MODY have significantly lower levels of hsCRP than individuals with young adult-onset type 2 diabetes and other MODY subtypes. This dataset represents the largest reported collection of MODY participants and includes individuals recruited from across Europe. As a screening biomarker used in isolation, hsCRP performed well across all centres in identifying participants with HNF1A mutations; the ROC-derived C-statistic for distinguishing HNF1A-MODY patients from those with young adult-onset type 2 diabetes ranged from 0.79 to 0.91. Performance was improved when an assay-specific hsCRP cut-off was combined with age of diabetes diagnosis, with the combined criteria achieving sensitivities of ~90% and specificities of up to 81%. This study establishes that hsCRP is by far the most robust clinical biomarker identified to date for the diagnosis of diabetes subtypes.
We extended the diabetes subtypes examined to show for the first time that lower hsCRP levels are not observed in HNF4A-MODY patients. This was not unexpected as there is no evidence that CRP expression is regulated directly by HNF4A. Interestingly, a recent GWAS reported that common alleles near HNF4A were associated with CRP levels in healthy individuals; the small effect seen might be mediated indirectly via the regulation of HNF1A by HNF4A [19]. It is a challenging task to discriminate between patients with HNF1A-MODY and those with HNF4A-MODY by clinical presentation alone [20]. Therefore patients whose clinical features are suggestive of transcription factor-MODY undergo resequencing of HNF1A and HNF4A, with HNF1A being sequenced first as these mutations are more common. In this dataset, hsCRP discriminated well between HNF1A-MODY and HNF4A-MODY patients, and we suggest that, along with birthweight, hsCRP could be used to guide molecular genetic investigation in patients with features of transcription factor-MODY [21].
The current study only addresses the discrimination between HNF1A-MODY and type 2 diabetes in young adults. High-sensitivity CRP did not distinguish as effectively between HNF1A-MODY and GCK-MODY patients; indeed, other biochemical features can better differentiate these MODY subtypes [22, 23]. We did not assess hsCRP as a diagnostic biomarker in children with diabetes, where the differential diagnosis is from type 1 diabetes. In our previous study, hsCRP did not discriminate reliably between these two aetiological subtypes in adults [7]; moreover, the lower hsCRP noted in children [24, 25] would be likely to diminish the difference further. This should be evaluated in children, but we suspect that other biomarkers (in addition to autoantibodies and C-peptide) will need to be developed to distinguish recently diagnosed type 1 diabetes from MODY.
We have shown some evidence for a genotype–phenotype relationship within HNF1A-MODY cases, as missense mutations affecting the dimerisation and DNA-binding domains have significantly lower hsCRP levels than mutations disrupting the transactivation domain. These results suggest that the functional outcome of missense mutations affecting binding to the DNA consensus sequence is more severe than that of those affecting the transactivation domain. The lower hsCRP levels observed are consistent with the previous study reporting decreased age of diabetes diagnosis in patients with missense mutations within the DNA-binding/dimerisation domain compared with those in the transactivation domain [16]. Importantly the sensitivity and specificity of hsCRP as a biomarker was not affected by the type or position of the underlying HNF1A mutation.
In our previous and current studies we excluded individuals with hsCRP values >10 mg/l from analysis. The persistently raised hsCRP levels in ten of 19 individuals with clinically labelled young adult-onset type 2 diabetes are likely to reflect the low-grade inflammation associated with insulin resistance [26, 27]. Two HNF1A-MODY patients had atypical MODY phenotypes complicated by insulin resistance and the metabolic syndrome, and this may explain their persistently raised hsCRP values [28]. HNF1A mutation carriers with mixed phenotypes that include insulin resistance will probably not be identified using hsCRP. To reduce the possibility of an acute elevation of CRP due to an intercurrent infection, we recommend repeating the test after a few weeks in any individual whose clinical presentation is consistent with HNF1A-MODY, but who has elevated hsCRP. HNF1A-MODY should not be excluded on the basis of an elevated hsCRP in patients under high clinical suspicion.
Currently available hsCRP assays have been optimised at concentrations higher than those observed in the present study. The comparison of three analytical assays demonstrated significant variation and bias within the normal hsCRP range. Importantly, all assays tested could discriminate between those with HNF1A-MODY and those with other diabetes subtypes. However, it is clear that the specific hsCRP assay used influences the optimal threshold for selecting an individual for HNF1A sequencing. The hsCRP M1 assay used in Oxford reports to a much lower minimum hsCRP value (0.03 mg/l) than the hsCRP M2 (0.25 mg/l) and hsCRP M3 (0.16 mg/l) assays. Therefore the majority of French and Finnish/Swedish HNF1A-MODY cases had hsCRP levels below the range of the specific assay and the median hsCRP for HNF1A-MODY cases was at the lower limit of each analytical assay. Furthermore, the absolute hsCRP difference between HNF1A-MODY individuals and those with other diabetes subtypes reported using assays hsCRP M2 and M3 is likely to be underestimated. This may account for the lower discriminative power (or C-statistic) when using these analytical assays. Optimum sensitivity and specificity values for diagnostic testing were found at a higher hsCRP level in these samples than in those analysed with hsCRP M1 (0.5 vs 0.25 mg/l). It is clear that the use of an hsCRP assay with a low reporting range provides enhanced discrimination between diabetes subtypes. We therefore recommend an assay with a similar reporting range to hsCRP M1 for use in diabetes diagnostics. Due to inter-method and inter-laboratory variability, each MODY diagnostic testing centre will need to establish the threshold for sequencing based on a specific local hsCRP assay.
Future studies to confirm the clinical utility of this biomarker will require prospective use of hsCRP to identify cases for sequencing of HNF1A from unselected groups of individuals with young adult-onset diabetes. Accompanying health economic analysis will also be necessary to demonstrate the cost-effectiveness of a screening pathway involving hsCRP, and to establish the optimum sensitivity and specificity cut-offs for diagnostic screening.
In summary, this study establishes that hsCRP is a clinically valid biomarker for diagnosis of HNF1A-MODY. We propose that hsCRP be incorporated into diagnostic algorithms in conjunction with other clinical and biochemical features to select individuals with diabetes for resequencing of HNF1A. An advantage of hsCRP as a screening biomarker is that it is already widely available at relatively low cost (~€5.00 per test) and therefore has great potential to be rapidly adopted in clinical practice. High-sensitivity CRP has sufficient sensitivity and specificity to facilitate more precise targeting of molecular diagnostic testing for monogenic diabetes, and therefore should improve detection of HNF1A-MODY individuals and lead to better care for these patients. Furthermore molecular genetic diagnostics is likely to become more widespread following the impact of next-generation sequencing techniques, and biomarkers such as hsCRP may become reliable tools to assist the clinical interpretation of novel mutations of uncertain pathogenic significance.
Abbreviations
CRP:
C-reactive protein
GCK:
Glucokinase
GWAS:
Genome-wide association study
HNF1A:
Hepatocyte nuclear factor 1 alpha
HNF4A:
Hepatocyte nuclear factor 4 alpha
hsCRP:
High-sensitivity C-reactive protein
hsCRP M1:
hsCRP method 1
hsCRP M2:
hsCRP method 2
hsCRP M3:
hsCRP method 3
ROC:
Receiver operating characteristic
References
- McCarthy MI (2010) Genomics, type 2 diabetes, and obesity. N Engl J Med 363:2339–2350
Article PubMed CAS Google Scholar - Reiner AP, Barber MJ, Guan Y et al (2008) Polymorphisms of the HNF1A gene encoding hepatocyte nuclear factor-1 alpha are associated with C-reactive protein. Am J Hum Genet 82:1193–1201
Article PubMed CAS Google Scholar - Ridker PM, Pare G, Parker A et al (2008) Loci related to metabolic-syndrome pathways including LEPR, HNF1A, IL6R, and GCKR associate with plasma C-reactive protein: the Women’s Genome Health Study. Am J Hum Genet 82:1185–1192
Article PubMed CAS Google Scholar - Toniatti C, Demartis A, Monaci P, Nicosia A, Ciliberto G (1990) Synergistic trans-activation of the human C-reactive protein promoter by transcription factor HNF-1 binding at two distinct sites. EMBO J 9:4467–4475
PubMed CAS Google Scholar - Nishikawa T, Hagihara K, Serada S et al (2008) Transcriptional complex formation of c-Fos, STAT3, and hepatocyte NF-1 alpha is essential for cytokine-driven C-reactive protein gene expression. J Immunol 180:3492–3501
PubMed CAS Google Scholar - Shih DQ, Bussen M, Sehayek E et al (2001) Hepatocyte nuclear factor-1alpha is an essential regulator of bile acid and plasma cholesterol metabolism. Nat Genet 27:375–382
Article PubMed CAS Google Scholar - Owen KR, Thanabalasingham G, James TJ et al (2010) Assessment of high-sensitivity C-reactive protein levels as diagnostic discriminator of maturity-onset diabetes of the young due to HNF1A mutations. Diabetes Care 33:1919–1924
Article PubMed CAS Google Scholar - Shields BM, Hicks S, Shepherd MH, Colclough K, Hattersley AT, Ellard S (2010) Maturity-onset diabetes of the young (MODY): how many cases are we missing? Diabetologia 53:2465–2467
Article Google Scholar - Kropff J, Selwood MP, McCarthy MI, Farmer AJ, Owen KR (2011) Prevalence of monogenic diabetes in young adults: a community-based, cross-sectional study in Oxfordshire, UK. Diabetologia 54:1261–1263
Article PubMed CAS Google Scholar - Pearson ER, Starkey BJ, Powell RJ, Gribble FM, Clark PM, Hattersley AT (2003) Genetic cause of hyperglycaemia and response to treatment in diabetes. Lancet 362:1275–1281
Article PubMed CAS Google Scholar - Thanabalasingham G, Pal A, Farmer AJ, Ellard S, McCarthy MI, Owen KR (2010) Extending criteria for genetic testing increases diagnosis of maturity-onset diabetes of the young. Diabetologia 53:S63 (abstract 137)
Google Scholar - Lee CC, Adler AI, Sandhu MS et al (2009) Association of C-reactive protein with type 2 diabetes: prospective analysis and meta-analysis. Diabetologia 52:1040–1047
Article PubMed CAS Google Scholar - Ridker PM (2003) Clinical application of C-reactive protein for cardiovascular disease detection and prevention. Circulation 107:363–369
Article PubMed Google Scholar - Moses LE, Shapiro D, Littenberg B (1993) Combining independent studies of a diagnostic test into a summary ROC curve: data-analytic approaches and some additional considerations. Stat Med 12:1293–1316
PubMed CAS Google Scholar - Harries LW, Ellard S, Stride A, Morgan NG, Hattersley AT (2006) Isomers of the TCF1 gene encoding hepatocyte nuclear factor-1 alpha show differential expression in the pancreas and define the relationship between mutation position and clinical phenotype in monogenic diabetes. Hum Mol Genet 15:2216–2224
Article PubMed CAS Google Scholar - Bellanne-Chantelot C, Carette C, Riveline JP et al (2008) The type and the position of HNF1A mutation modulate age at diagnosis of diabetes in patients with maturity-onset diabetes of the young (MODY)-3. Diabetes 57:503–508
Article PubMed CAS Google Scholar - Passing H, Bablok W (1983) A new biometrical procedure for testing the equality of measurements from two different analytical methods. Application of linear regression procedures for method comparison studies in clinical chemistry, part I. J Clin Chem Clin Biochem 21:709–720
PubMed CAS Google Scholar - Murphy R, Ellard S, Hattersley AT (2008) Clinical implications of a molecular genetic classification of monogenic beta-cell diabetes. Nat Clin Pract Endocrinol Metabol 4:200–213
Article CAS Google Scholar - Dehghan A, Dupuis J, Barbalic M et al (2011) Meta-analysis of genome-wide association studies in >80,000 subjects identifies multiple loci for C-reactive protein levels. Circulation 123:731–738
Article PubMed CAS Google Scholar - Ellard S, Bellanne-Chantelot C, Hattersley AT (2008) Best practice guidelines for the molecular genetic diagnosis of maturity-onset diabetes of the young. Diabetologia 51:546–553
Article PubMed CAS Google Scholar - Pearson ER, Boj SF, Steele AM et al (2007) Macrosomia and hyperinsulinaemic hypoglycaemia in patients with heterozygous mutations in the HNF4A gene. PLoS Med 4:e118
Article PubMed Google Scholar - Stride A, Vaxillaire M, Tuomi T et al (2002) The genetic abnormality in the beta cell determines the response to an oral glucose load. Diabetologia 45:427–435
Article PubMed CAS Google Scholar - Pal A, Farmer AJ, Dudley C et al (2009) Evaluation of serum 1,5 anhydroglucitol levels as a clinical test to differentiate subtypes of diabetes. Diabetes Care 33:252–257
Article PubMed Google Scholar - Whincup PH, Nightingale CM, Owen CG et al (2010) Early emergence of ethnic differences in type 2 diabetes precursors in the UK: the Child Heart and Health Study in England (CHASE Study). PLoS Med 7:e1000263
Article PubMed Google Scholar - Ford ES, Giles WH, Myers GL, Rifai N, Ridker PM, Mannino DM (2003) C-reactive protein concentration distribution among US children and young adults: findings from the National Health and Nutrition Examination Survey, 1999–2000. Clin Chem 49:1353–1357
Article PubMed CAS Google Scholar - Freeman DJ, Norrie J, Caslake MJ et al (2002) C-reactive protein is an independent predictor of risk for the development of diabetes in the West of Scotland Coronary Prevention Study. Diabetes 51:1596–1600
Article PubMed CAS Google Scholar - Tabak AG, Kivimaki M, Brunner EJ et al (2010) Changes in C-reactive protein levels before type 2 diabetes and cardiovascular death: the Whitehall II study. Eur J Endocrinol 163:89–95
Article PubMed CAS Google Scholar - Alberti KG, Zimmet P, Shaw J (2006) Metabolic syndrome—a new world-wide definition. A Consensus Statement from the International Diabetes Federation. Diabet Med 23:469–480
Article PubMed CAS Google Scholar
Acknowledgements
We thank the patients and families for taking part in this study. We also thank M. Huckova and L. Valentinova for their help with the DNA analysis (Slovakian samples). K.R. Owen is an NIHR-funded Clinician Scientist. A.L. Gloyn is a Medical Research Council (MRC) New Investigator (81696). E. Tjora, H. Raeder and P.R. Njolstad were funded by the University of Bergen, Helse Vest, Innovest and the Research Council of Norway. D. Gašperíková, J. Stanik and I. Klimes acknowledge grant support from BITCET and VEGA 2/0151/11. The study was funded by the Oxford (NIHR) Biomedical Research Centre, Diabetes UK and the European Community FP7 programmes CEED3 (HEALTH-F2-2008-223211) and ENGAGE (HEALTH-F4-2007-201413). The Danish part of the study was supported by grants from the Lundbeck Foundation Centre for Applied Medical Genomics in Personalized Disease Prediction, Prevention and Care (LuCAMP), the Danish Diabetes Association and the Danish Research Council. The Marie Krogh Centre for Metabolic Research is funded by the Novo Nordisk Foundation.
Contribution statement
All authors contributed to interpretation of data, revision of the article for important intellectual content and final approval of the version to be published. In addition, GT, MIM, ALG and KRO contributed to study conception and design, analysis of data and drafting of the article.
Duality of interest
The authors declare that there is no duality of interest associated with this manuscript.
Author information
Authors and Affiliations
- Oxford Centre for Diabetes Endocrinology and Metabolism, University of Oxford, Churchill Hospital, Headington, Oxford, OX3 7LJ, UK
G. Thanabalasingham, M. I. McCarthy, A. L. Gloyn & K. R. Owen - Oxford NIHR Biomedical Centre, Churchill Hospital, Oxford, UK
G. Thanabalasingham, M. I. McCarthy, A. L. Gloyn & K. R. Owen - Department of Clinical Biochemistry, John Radcliffe Hospital, Oxford, UK
N. Shah & T. J. James - CNRS-UMR-8199, University Lille Nord de France, Lille, France
M. Vaxillaire, S. Gaget & P. Froguel - Marie Krogh Centre for Metabolic Research, Section of Metabolic Genetics, Faculty of Health Sciences, University of Copenhagen, Copenhagen, Denmark
T. Hansen, E. Andersson & O. Pedersen - Faculty of Health Sciences, University of Southern Denmark, Odense, Denmark
T. Hansen - Department of Medicine, Helsinki University Hospital, Helsinki, Finland
T. Tuomi, P. Kokko & L. Groop - Folkhalsan Research Centre, University of Helsinki, Helsinki, Finland
T. Tuomi & B. Isomaa - DIABGENE Laboratory, Slovak Academy of Sciences, Bratislava, Slovakia
D. Gašperíková, J. Stanik & I. Klimes - Department of Metabolic Diseases, Jagiellonian University, Krakow, Poland
M. Szopa, N. Nowak & M. T. Malecki - Department of Clinical Medicine, University of Bergen, Bergen, Norway
E. Tjora, H. Raeder & P. R. Njolstad - Department of Paediatrics, Haukeland University Hospital, Bergen, Norway
E. Tjora, H. Raeder & P. R. Njolstad - Medical Biology Laboratory, Pasteur Institute, IPL, Lille, France
F. Loiseleur - Children Diabetes Centre at the 1st Department of Paediatrics, Faculty of Medicine at the Comenius University, Bratislava, Slovakia
J. Stanik - Department of Diabetes and Endocrinology, Malmo University Hospital, Malmo, Sweden
L. Groop - Hagedorn Research Institute, Copenhagen, Denmark
O. Pedersen - Faculty of Health Sciences, University of Aarhus, Aarhus, Denmark
O. Pedersen - Institute of Biomedical Science, Faculty of Health Sciences, University of Copenhagen, Copenhagen, Denmark
O. Pedersen - Department of Genomics of Common Disease, School of Public Health, Imperial College London, London, UK
P. Froguel - Wellcome Trust for Human Genetics, University of Oxford, Oxford, UK
M. I. McCarthy
Authors
- G. Thanabalasingham
You can also search for this author inPubMed Google Scholar - N. Shah
You can also search for this author inPubMed Google Scholar - M. Vaxillaire
You can also search for this author inPubMed Google Scholar - T. Hansen
You can also search for this author inPubMed Google Scholar - T. Tuomi
You can also search for this author inPubMed Google Scholar - D. Gašperíková
You can also search for this author inPubMed Google Scholar - M. Szopa
You can also search for this author inPubMed Google Scholar - E. Tjora
You can also search for this author inPubMed Google Scholar - T. J. James
You can also search for this author inPubMed Google Scholar - P. Kokko
You can also search for this author inPubMed Google Scholar - F. Loiseleur
You can also search for this author inPubMed Google Scholar - E. Andersson
You can also search for this author inPubMed Google Scholar - S. Gaget
You can also search for this author inPubMed Google Scholar - B. Isomaa
You can also search for this author inPubMed Google Scholar - N. Nowak
You can also search for this author inPubMed Google Scholar - H. Raeder
You can also search for this author inPubMed Google Scholar - J. Stanik
You can also search for this author inPubMed Google Scholar - P. R. Njolstad
You can also search for this author inPubMed Google Scholar - M. T. Malecki
You can also search for this author inPubMed Google Scholar - I. Klimes
You can also search for this author inPubMed Google Scholar - L. Groop
You can also search for this author inPubMed Google Scholar - O. Pedersen
You can also search for this author inPubMed Google Scholar - P. Froguel
You can also search for this author inPubMed Google Scholar - M. I. McCarthy
You can also search for this author inPubMed Google Scholar - A. L. Gloyn
You can also search for this author inPubMed Google Scholar - K. R. Owen
You can also search for this author inPubMed Google Scholar
Corresponding author
Correspondence toK. R. Owen.
Electronic supplementary material
Below is the link to the electronic supplementary material.
ESM Table 1
Clinical and biochemical characteristics of participants (PDF 104 kb)
ESM Table 2
HsCRP in unrelated HNF1A-MODY individuals according to type and position of HNF1A mutation (PDF 94.6 kb)
ESM Figure 1
Scatterplot to show hsCRP values obtained from two methods (hsCRP M1 and hsCRP M3) (PDF 141 kb)
ESM Figure 2
Line graph illustrating repeat hsCRP values for individuals with previously elevated hsCRP results. The horizontal dotted line indicates hsCRP values of 10 mg/l (PDF 170 kb)
Rights and permissions
About this article
Cite this article
Thanabalasingham, G., Shah, N., Vaxillaire, M. et al. A large multi-centre European study validates high-sensitivity C-reactive protein (hsCRP) as a clinical biomarker for the diagnosis of diabetes subtypes.Diabetologia 54, 2801–2810 (2011). https://doi.org/10.1007/s00125-011-2261-y
- Received: 24 March 2011
- Accepted: 30 June 2011
- Published: 04 August 2011
- Issue Date: November 2011
- DOI: https://doi.org/10.1007/s00125-011-2261-y