High Osmolarity Extends Life Span in Saccharomyces cerevisiae by a Mechanism Related to Calorie Restriction (original) (raw)
Abstract
Calorie restriction (CR) extends life span in many different organisms, including mammals. We describe here a novel pathway that extends the life span of Saccharomyces cerevisiae mother cells but does not involve a reduction in caloric content of the media, i.e., there is growth of yeast cells in the presence of a high concentration of external osmolytes. Like CR, this longevity-promoting response to high osmolarity requires SIR2, suggesting a common mechanism of life span regulation. Genetic and microarray analysis indicates that high osmolarity extends the life span by activating Hog1p, leading to an increase in the biosynthesis of glycerol from glycolytic intermediates. This metabolic shift likely increases NAD levels, thereby activating Sir2p and promoting longevity.
Environmental factors, such as the availability of nutrients, can have a dramatic effect on life span (e.g., see references 16, 22, 25, 30, and 37). Calorie restriction (CR) extends life span in many organisms, including rodents (29, 44), the nematode Caenorhabditis elegans (22), and mother cells of the budding yeast Saccharomyces cerevisiae (26). In yeast, decreasing the glucose concentration of the growth medium extends the life span up to 35% (26). This extension results from activation of the silencing factor Sir2p, a central determinant of yeast life span (26, 27).
Sir2p is targeted to the silent mating type (HM) loci (19, 36), telomeres (13), and the ribosomal DNA (rDNA) (7, 41), where its NAD-dependent histone deacetylase activity (18, 23, 42) triggers transcriptional silencing. Mutations in SIR2 not only abolish silencing at these loci but also increase homologous recombination in the rDNA (12), thereby generating extra-chromosomal rDNA circles that shorten life span (40). Sir2p limits the life span in wild-type yeast, because even one extra copy of the gene provides greater longevity to mother cells (21). Further, extra copies of the Sir2p homolog, Sir-2.1, extend the life span in C. elegans (43), demonstrating a conserved role of this protein as a longevity determinant.
How does SIR2 regulate life span in response to CR? It was suggested that NAD serves as a regulatory effector allowing Sir2p to sense the metabolic rate of cells (14). In support of this model, CR fails to extend life span when the levels of NAD are reduced 60% (42) by mutating the NAD biosynthetic enzyme Npt1p (26). The increase in NAD elicited by CR may result from a metabolic shift from fermentation to respiration (27). Calorically restricted cells show an increase in respiration and, indeed, life span extension by CR requires the integrity of the electron transport chain. Moreover, increasing the transcription of genes involved in respiration by overexpressing the transcription factor Hap4p is sufficient to extend life span. This metabolic shift toward respiration also activates silencing by Sir2p. It is likely that the NAD/NADH ratio is increased under these conditions by the slowing of glycolysis, which converts NAD into NADH, and by the activation of electron transport, which converts NADH into NAD.
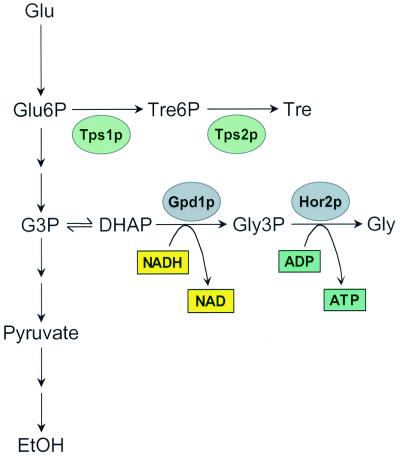
Yeast cells respond to environmental factors other than nutrients, such as high external osmolarity (HEO). To balance a high concentration of external osmolytes, cells synthesize glycerol and trehalose internally (reviewed in reference 6). This high osmolarity glycerol (HOG) response pathway (reviewed in reference 31) is mediated by Hog1p, which is rapidly phosphorylated upon osmotic shock, translocates from the cytosol to the nucleus (28), and activates osmolarity-responsive genes (2). Activation of this set of genes results in a stress response, changes in carbon metabolism, and increased synthesis of glycerol and trehalose (Fig. 1). The increase in glycerol synthesis is accomplished by the transcriptional activation of GPD1 and HOR2, encoding glycerol-3-phosphate dehydrogenase and glycerol phosphate phosphatase, respectively (1, 24, 32). These enzymes catalyze the conversion of dihydroxyacetone phosphate (DHAP), ADP, and NADH to glycerol, thereby generating NAD and ATP. Trehalose is synthesized directly from glucose-6-phosphate by the activity of the trehalose synthase complex in response to osmotic stress. Hog1p-dependent stress response genes include MSN2 and MSN4, several heat shock proteins, and cytosolic catalase (34).
FIG. 1.
High osmolarity results in a metabolic shift away from glycolysis. Activation of the HOG response pathway results in biosynthesis of trehalose and glycerol from glycolytic intermediates. Glu, glucose; P, phosphate; Tre, trehalose; G3P, glyceraldehyde-3-phosphate; DHAP, dihydroxyacetone-3-phosphate; Gly, glycerol; EtOH, ethanol. The proteins shown are transcriptionally activated by Hog1p.
We present here evidence that external osmolytes extend the replicative life span by activating the HOG pathway and glycerol synthesis in particular. The requirement of SIR2 and NAD for life span extension by HEO suggests a striking mechanistic parallel to CR.
MATERIALS AND METHODS
Strains, plasmids, and media.
The strains used in this study are listed in Table 1. All strains were derived from S. cerevisiae strain PSY316 (described in reference 33). The _cdc25_-10, msn2 msn4, npt1, and sir2 fob1 strains were previously described (26). All other gene disruptions were generated by targeted PCR disruption. Marker genes were amplified from the appropriate pRS integrating vector (39) using primers designed to incorporate 40 nucleotides of homology to genomic DNA at each end of the disruption cassette. In each case, the entire coding region of the disrupted gene and up to 100 nucleotides of flanking sequence were removed. All disruptants were verified by PCR prior to subsequent analysis. Plasmid pPP35 (provided by P. Park) contains the ADH1 promoter ligated into the URA3 integrating vector pRS306. Plasmid pADH_GPD1 was constructed by PCR amplifying the GPD1 gene from PSY316 and placing it under control of the ADH1 promoter in pPP35. Genetic crosses, sporulation, and tetrad analysis were carried out as described previously (38).
TABLE 1.
Yeast strains used in this study
| Strain | Relevant genotype |
|---|---|
| PSY316 | _MAT_α ura3-52 leu2-3,112 his3_-Δ_200 ade2-101 lys2-801 |
| PSY316AR | PSY316 ADE2/rDNA |
| MKY2089 | PSY316AR hog1::URA3 |
| MKY2091 | PSY316AR hot1::HIS3 |
| MKY2140 | PSY316AR msn2 msn4::kanMX |
| MKY2147 | PSY316AR cyt1 |
| MKY2038 | PSY316AR cdc25-10 |
| MKY2001 | PSY316AR sir2 hmr |
| MKY2085 | PSY316AR sir2 fob1 |
| MKY2139 | PSY316AR npt1 |
| MKY2107 | PSY316AR pPP35/URA3 |
| MKY2118 | PSY316AR pADH_GPD1 |
| MKY2120 | PSY316AR gpd1::HIS3 pPP35 |
| MKY2121 | PSY316AR gpd1::HIS3 pADH_GPD1 |
| MKY2158 | PSY316AR tps2 |
Unless otherwise noted, cells were cultured in YPD or synthetic medium prepared using conventional methods (15). YPDS is YPD supplemented with 1 M d-sorbitol. YPDX is YPD supplemented with 1 M d-xylitol. YPDGLU is YPD supplemented with 1 M d-glucose (20% total glucose concentration). YPDY is YPD supplemented with 1 M d-glycerol. d-Sorbitol, d-xylitol, d-glycerol, and d-glucose were purchased from Sigma Chemical Company. The inability of strain PSY316 to utilize either sorbitol or xylitol was verified by growing the cells in synthetic complete medium supplemented with either d-sorbitol or d-xylitol at a concentration of 4%. No growth was observed after 1 week at 30°C. Cells cultured in parallel with either 2% glucose or 4% glycerol as the carbon source demonstrated normal growth.
Life span analysis.
Micromanipulation and life span analysis were performed as previously described (20). Data shown represent the results of a single experiment. Statistical significance for life spans was determined by a Wilcoxon rank sum test. Average life span is stated to be statistically different if P < 0.05.
Spot assays.
Spot assays for sensitivity to HEO were performed as described previously (20), except that cells were spotted onto high-osmolarity media.
Microarray analysis.
Microarray analysis was performed as described previously (27). For the 20% glucose time course, cells were grown in YPD overnight and diluted 100-fold into fresh YPD. Cells were incubated at 30°C for 4 to 5 h, at which time an equal volume of prewarmed yeast extract-peptone supplemented with 38% glucose was added (to yield a final glucose concentration of 20%). Cells were incubated in this medium for 30 min, 1 h, 2 h, or 4 h. All cultures had an optical density at 600 nm of 0.5 to 0.8 after incubation in YPDGLU. Cells were then spun down and washed with a 20% glucose solution prior to freezing in dry ice-ethanol and storage at −80°C. For the wild-type (no osmotic stress) control, the same procedure was followed as for time course samples, except that an equal volume of YPD was added instead of yeast extract peptone supplemented with 38% glucose and the cells were washed with water rather than 20% glucose. Slides were scanned using a Packard BioScience 3000 scanner. Images were processed using the MolecularWare DigitalGENOME software package (Cambridge, Mass.). Cluster analysis was performed using Cluster and visualized with TreeView (11). Gene functions listed in the online supplemental table (http://web.mit.edu/biology/guarente/arrays/kaeberlein.html) are based on the one-line description for each gene from the Yeast Proteome Database (9). Complete microarray data sets can be obtained on the World Wide Web at http://web.mit.edu/biology/guarente/arrays/kaeberlein.html.
RESULTS
Local minimum for life span is 2% glucose.
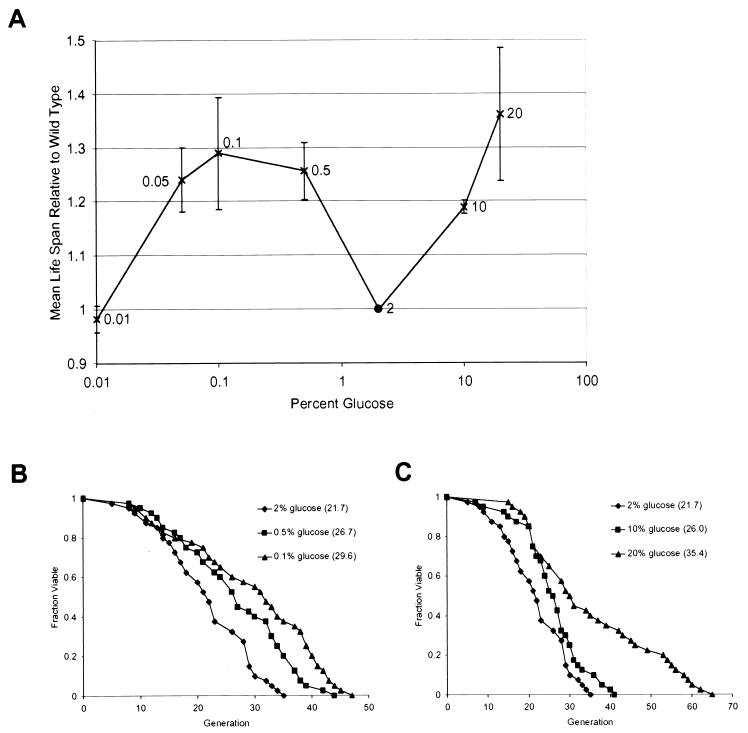
To determine mother-cell life span across the full range of glucose concentrations, we first measured the life span of cells grown in the presence of decreasing concentrations of glucose. A reduction in the level of glucose from the usual 2% glucose to 0.5% resulted in an increase in mean and maximum life span (Fig. 2A and B). Growth in the presence of 0.1% glucose resulted in a slightly longer life span. Further reduction in glucose concentrations began to shorten life span; however, even when cells were grown under extreme CR in 0.01% glucose, life span was still nearly equal to that on 2% glucose.
FIG. 2.
Life span varies as a function of glucose concentration. (A) Mean life span is plotted as a function of the glucose concentration. Error bars represent standard deviations obtained from at least three experiments (n ≥ 40 cells per experiment). (B) Life spans were determined for 2% glucose (♦), 0.5% glucose (▪), and 0.1% glucose (▴). Mean life spans (numbers of cells analyzed) were as follows: 2% glucose, 21.7 generations (n = 40); 0.5% glucose, 26.7 generations (n = 40); and 0.1% glucose, 29.6 generations (n = 40). (C) Life spans were determined for 2% glucose (♦), 10% glucose (▪), and 20% glucose (▴). Mean life spans (numbers of cells analyzed) were as follows: 2% glucose, 21.7 generations (n = 40); 10% glucose, 26.0 generations (n = 40); and 20% glucose, 35.4 generations (n = 40).
We also examined the effect of increasing glucose concentrations on life span. Surprisingly, we observed a dose-dependent increase in life span with higher glucose levels (Fig. 2A and C). In medium supplemented with either 10% glucose or 20% glucose (YPDGLU), mean life span is extended relative to that with 2% glucose. At high concentrations of glucose, the initial growth rate is reduced slightly. However, this effect is no longer noticeable after 5 to 6 generations (not shown).
High concentrations of nonmetabolizable sugars increase life span.
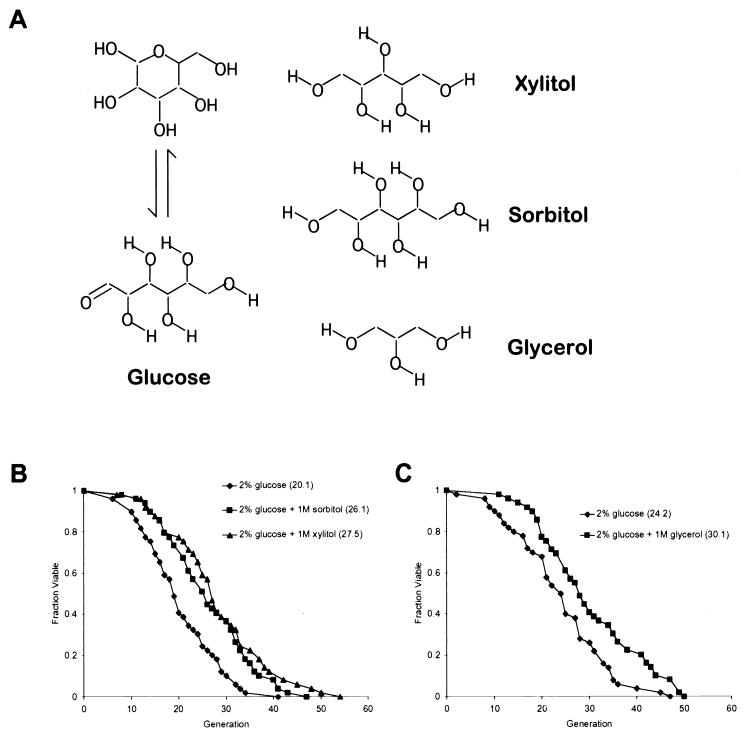
Life span extension following growth on YPDGLU could be caused by a specific response to elevated glucose levels or could be the result of a more general cellular response to HEO. To differentiate between these two possibilities, we examined the effect of high levels of d-sorbitol or d-xylitol on life span. Unlike glucose, neither of these acyclic polyols (Fig. 3A) can be metabolized by our wild-type strain (see Materials and Methods). Since a glucose concentration of 1 M is equal to 18%, YPDS (2% glucose plus 1 M sorbitol) and YPDX (2% glucose plus 1 M xylitol) have the same total osmolyte concentration as YPDGLU (2% glucose plus 1 M glucose). Growth on either YPDS or YPDX resulted in a significant increase in both mean and maximum life span (Fig. 3B), though not to the same level as growth on YPDGLU. This may be due to a glucose-specific longevity-promoting effect or to a negative effect caused by high levels of sorbitol or xylitol. In any case, the majority of the life span extension is not specific to glucose but results from increased osmolarity of the growth media.
FIG. 3.
Growth in the presence of high osmolarity extends life span. (A) Structures of glucose, xylitol, sorbitol, and glycerol. (B) Life spans were determined for 2% glucose (♦), 2% glucose plus 1 M sorbitol (▪), and 2% glucose plus 1 M xylitol (▴). Mean life spans (numbers of cells analyzed) were as follows: 2% glucose, 20.1 generations (n = 49); 2% glucose plus 1 M sorbitol, 26.1 generations (n = 49); and 2% glucose plus 1 M xylitol, 27.5 generations (n = 49). (C) Life spans were determined for 2% glucose (♦) and 2% glucose plus 1 M glycerol (▪). Mean life spans (numbers of cells analyzed) were as follows: 2% glucose, 24.2 generations (n = 50); and 2% glucose plus 1 M glycerol, 30.1 generations (n = 49).
To generalize our findings with six-carbon sugars, we examined whether a high concentration of the three-carbon sugar d-glycerol is also able to extend life span. Cells grown on YPD supplemented with 1 M glycerol had a life span extended relative to wild type and approaching that of cells grown on either YPDS or YPDX (Fig. 3C).
The HOG pathway is necessary for increased life span.
The transcriptional response to HEO is mediated by signaling through the HOG pathway. A key component of this response is the Hog1p kinase. Thus, if HEO results in increased life span, then increased Hog1p activity might also extend life span and reduced activity might decrease life span. However, constitutively active alleles of Hog1p result in growth defects in the absence of osmotic stress (5), complicating the interpretation of life span data from strains carrying such alleles. We therefore examined the effect of deleting HOG1 on life span.
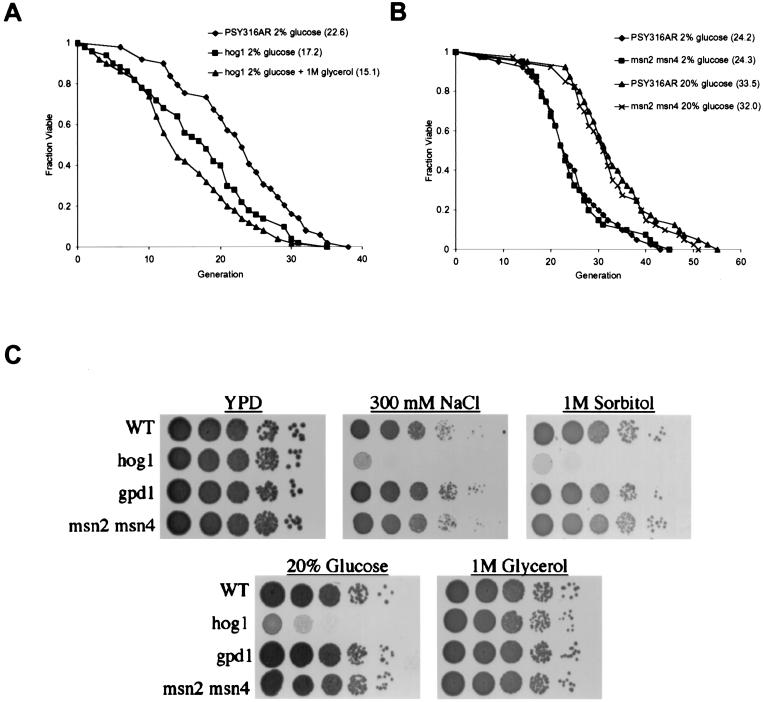
Deletion of HOG1 resulted in a significant decrease in life span on YPD (Fig. 4A), suggesting a role for Hog1p even in the absence of osmotic stress. As expected, cells lacking Hog1p were unable to grow on YPDS, YPDX, or YPDGLU (Fig. 4C). However, hog1 cells were viable in the presence of high concentrations of extracellular glycerol, likely due to their ability to import glycerol into the cell, balancing the HEO (2). Growth in the presence of 1 M glycerol failed to suppress the short life span caused by loss of Hog1p (Fig. 4A), even though it extended the wild-type life span (Fig. 3C). Thus, Hog1p appears to be required for life span extension by HEO.
FIG. 4.
The HOG response is required for life span extension by high osmolarity. (A) Life spans were determined for strain PSY316AR in 2% glucose (♦), the hog1 mutant in 2% glucose (▪), and the hog1 mutant in 2% glucose plus 1 M glycerol (▴). Mean life spans (numbers of cells analyzed) were as follows: PSY316AR 2% glucose, 22.6 generations (n = 49); hog1 2% glucose, 17.2 generations (n = 50); and hog1 2% glucose plus 1 M glycerol, 15.1 generations (n = 50). (B) Life spans were determined for strain PSY316AR in 2% glucose (♦), the msn2 msn4 mutant in 2% glucose (▪), strain PSY316AR in 20% glucose (▴), and the msn2 msn4 mutant in 20% glucose (x). Mean life spans (numbers of cells analyzed) were as follows: PSY316AR 2% glucose, 24.2 generations (n = 40); msn2 msn4 2% glucose, 24.3 generations (n = 40); PSY316AR 20% glucose, 33.5 generations (n = 40); and msn2 msn4 20% glucose, 32.0 generations (n = 40). (C) Serial dilution spot assays onto high-osmolarity media. Mutation of HOG1 results in sensitivity to high concentrations of glucose or sorbitol, but not glycerol. Mutation of GPD1 or MSN2 and MSN4 has no detectable effect on sensitivity to high osmolarity.
The transcription factors Msn2p and Msn4p function downstream of Hog1p to activate stress response genes (34). In order to determine whether HEO promotes long life span simply by increasing resistance to environmental stress, we deleted both MSN2 and MSN4 and analyzed the life span in high-glucose media. The msn2 msn4 cells had a life span indistinguishable from that of wild-type cells on YPD, YPDGLU (Fig. 4B), and YPDS (not shown), demonstrating that these genes are not required for life span extension by HEO. This result suggests that, as is the case for CR (26), the increased life span observed in response to HEO is not due to a general increase in stress resistance.
HEO and CR are in the same genetic pathway.
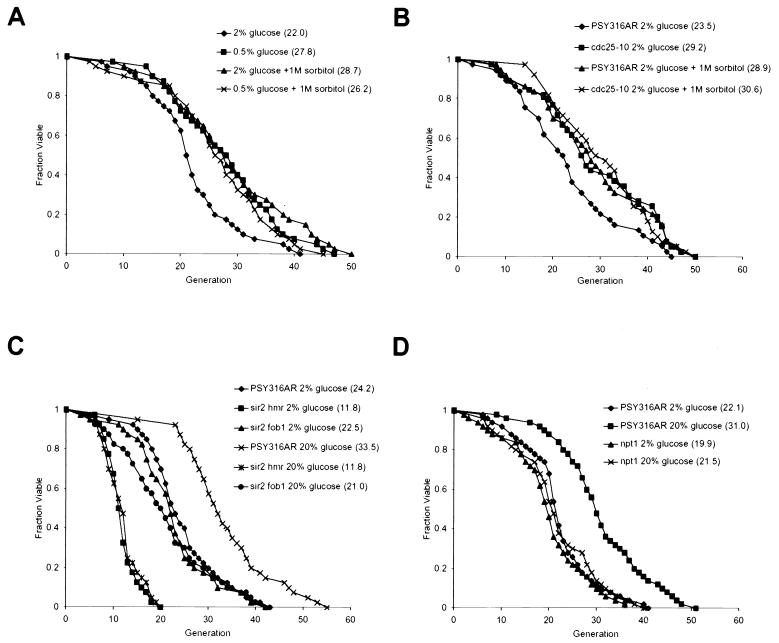
Several experiments were designed to determine the relationship between the effects of CR and osmotic stress on life span. Combining two treatments that extend life span, HEO with low glucose (1 M sorbitol and 0.5% glucose), failed to result in a synergistic increase in life span (Fig. 5A). CR in yeast can also be modeled by decreased protein kinase A activity. For example, mutation of the RAS GDP/GTP exchange factor Cdc25p decreases protein kinase A signaling and results in an increased life span. To test the link between osmotic signaling and CR, we measured the life span of the long-lived _cdc25_-10 strain in the presence of HEO. Growth of the _cdc25_-10 mutant on YPDS also failed to result in a synergistic increase in life span (Fig. 5B). These results are consistent with the hypothesis that HEO and CR regulate longevity by a similar mechanism.
FIG. 5.
High osmolarity, CR, and Sir2p are in the same pathway for regulation of life span. (A) Life spans were determined for PSY316AR in 2% glucose (♦), PSY316AR in 0.5% glucose (▪), PSY316AR in 2% glucose plus 1 M sorbitol (▴), and PSY316AR in 0.5% glucose plus 1 M sorbitol (x). Mean life spans (numbers of cells analyzed) were as follows: PSY316AR 2% glucose, 22.0 generations (n = 40); PSY316AR 0.5% glucose, 27.8 generations (n = 40); PSY316AR 2% glucose plus 1 M sorbitol, 28.7 generations (n = 40); and PSY316AR 0.5% glucose plus 1 M sorbitol, 26.2 generations (n = 40). (B) Life spans were determined for PSY316AR in 2% glucose (♦), the _cdc25_-10 mutant in 2% glucose (▪), PSY316AR in 2% glucose plus 1 M sorbitol (▴), and the _cdc25_-10 mutant in 2% glucose plus 1 M sorbitol (x). Mean life spans (numbers of cells analyzed) were as follows: PSY316AR 2% glucose, 23.5 generations (n = 37); _cdc25_-10 2% glucose, 29.2 generations (n = 39); PSY316AR 2% glucose plus 1 M sorbitol, 28.9 generations (n = 37); and _cdc25_-10 2% glucose plus 1 M sorbitol, 30.6 generations (n = 39). (C) Life spans were determined for PSY316AR in 2% glucose (♦), the sir2 hmr mutant in 2% glucose (▪), the sir2 fob1 mutant in 2% glucose (▴), PSY316AR in 20% glucose (x), the sir2 hmr mutant in 20% glucose (∗), and the sir2 fob1 mutant in 20% glucose (•). Mean life spans (numbers of cells analyzed) were as follows: PSY316AR 2% glucose, 24.2 generations (n = 40); sir2 hmr 2% glucose, 11.8 generations (n = 40); sir2 fob1 2% glucose, 22.5 generations (n = 40); PSY316AR 20% glucose, 33.5 generations (n = 40) sir2 hmr 20% glucose, 11.8 generations (n = 40); and sir2 fob1 20% glucose, 21.0 generations (n = 40). In this experiment, HMLa was deleted from sir2 strains to prevent a and α coexpression, which has been demonstrated to shorten life span in haploid cells (21). (D) Life spans were determined for PSY316AR in 2% glucose (♦), PSY316AR in 20% glucose (▪), the npt1 mutant in 2% glucose (▴), and the npt1 mutant in 20% glucose (x). Mean life spans (numbers of cells analyzed) were as follows: PSY316AR 2% glucose, 22.1 generations (n = 50); PSY316AR 20% glucose, 31.0 generations (n = 50); npt1 2% glucose, 19.9 generations (n = 50); and npt1 20% glucose, 21.5 generations (n = 50).
Life span extension by CR requires Sir2p (26). Therefore, if CR and HEO promote longevity by a common mechanism, life span extension by HEO should also require Sir2p. In agreement with this idea, growth on YPDGLU failed to extend the short life span of a sir2 mutant and also failed to extend the life span in the longer-lived sir2 fob1 strain (Fig. 5C). Growth on YPDS also failed to extend the life span of a sir2 mutant (not shown).
The ability of Sir2p to promote longevity requires its NAD-dependent histone deacetylase activity (4, 18). Mutation of the NAD biosynthetic enzyme Npt1p prevents Sir2p-dependent life span extension by CR (26) and overexpression of Npt1p is sufficient to increase life span (3). This phenotype has been interpreted to suggest that CR might extend life span by increasing the amount of NAD available as a substrate for Sir2p. Like CR, growth on YPDGLU also fails to extend the life span of a strain lacking Npt1p (Fig. 5D). Taken together, all of these experiments strongly suggest that HEO and CR both extend life span by a common, _SIR2_-dependent mechanism.
The transcriptional response to high glucose suggests a metabolic shift away from glycolysis.
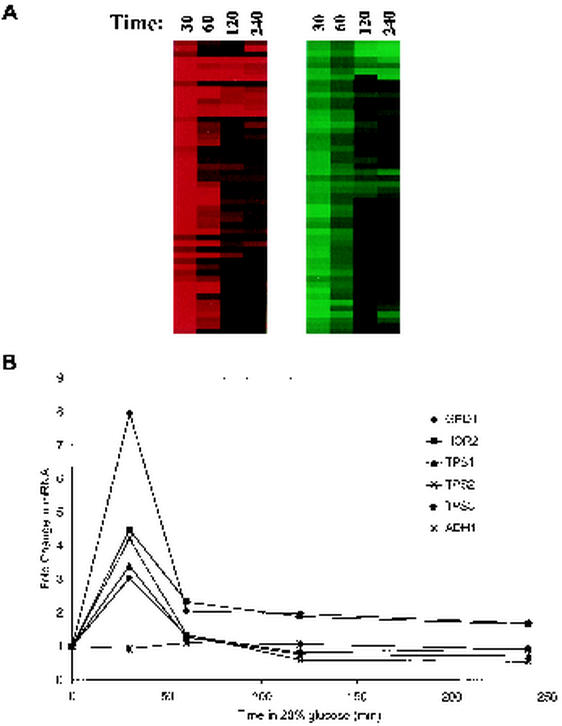
To understand the changes in metabolism upon exposure to high levels of glucose, we examined the transcriptional profiles of cells exposed to 20% glucose for various lengths of time. Transient exposure to high glucose resulted in a rapid transcriptional response (http://web.mit.edu/biology/guarente/arrays/kaeberlein.html) similar to that in published reports on exposure to sorbitol or sodium chloride (8, 35). In particular, the glycerol and trehalose biosynthetic genes GPD1, HOR2, and _TPS1_-3 are all upregulated by high levels of glucose (http://web.mit.edu/biology/guarente/arrays/kaeberlein.html), sorbitol, or sodium chloride (8, 35).
The maximal change in mRNA levels for most osmo-responsive genes occurred between 30 and 60 min after exposure to 20% glucose (Fig. 6A). After 4 h of induction, the osmotic response decreased in magnitude. However, many osmo-responsive genes, including GPD1 and HOR2, failed to return to uninduced levels even after 24 h of growth in YPDGLU (M. Kaeberlein and A. A. Andalis, unpublished observations). Thus, a persistent transcriptional response to HEO is demonstrated, which is consistent with the observed life span extension.
FIG. 6.
Microarray analysis of cells exposed to 20% glucose. (A) Graphic display of a subset of the genes down-regulated (green) and up-regulated (red) by high osmolarity after 30, 60, 120, or 240 min of growth in 20% glucose. Many, but not all, regulated genes peak between 30 and 60 min after exposure to osmotic stress. Data values can be found online at http://web.mit.edu/biology/guarente/arrays/kaeberlein.html. (B) Glycerol and trehalose biosynthetic genes are up-regulated by growth in 20% glucose. GPD1 and HOR2 mRNA levels decline after 30 min of exposure to 20% glucose but are still expressed above uninduced levels even after 4 h. TPS1, TPS2, and TPS3 mRNA levels are up-regulated after 30 min but return to uninduced levels after 1 h. ADH1 mRNA is shown as an uninduced control.
The observed increase in mRNA for glycerol and trehalose biosynthetic enzymes upon exposure to 20% glucose (Fig. 6B) should lead to increased production of glycerol and trehalose, one of the primary responses to HEO. Glycerol biosynthesis requires the following two enzymes: glycerol-3-phosphate dehydrogenase (Gpd1p) and glycerol-3-phosphate phosphatase (Hor2p). Together, these enzymes catalyze the conversion of DHAP to glycerol-3-phosphate, with concurrent production of NAD and ATP from NADH and ADP (Fig. 1). This metabolic shift could have two potentially life span-extending effects. First, carbon flow will be shunted away from glycolysis, similar to the proposed effect of CR. Second, the cytosolic ratio of NAD to NADH will be shifted towards a greater NAD concentration, resulting in increased activity of Sir2p.
Transcriptional regulation of glycerol, but not trehalose, biosynthetic genes is required for life span extension by HEO.
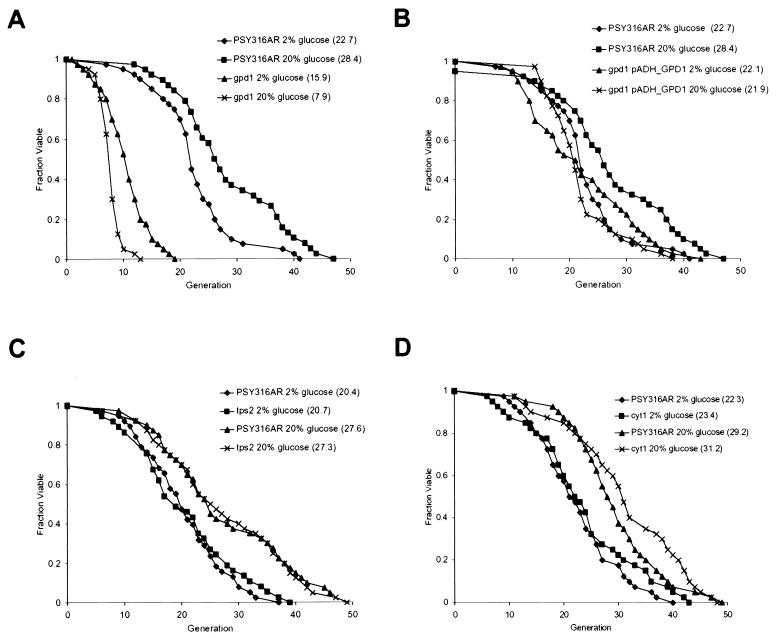
To test whether glycerol production is required for increased longevity, we uncoupled GPD1 expression from the HOG pathway by placing it under control of the ADH1 promoter. ADH1 is not transcriptionally regulated by HEO (Fig. 6B). Deletion of GPD1 resulted in a shortened life span even in the absence of osmotic stress (Fig. 7A), suggesting that this pathway contributes to cell survival under normal conditions. The gpd1 strain had an even shorter life span when grown on 20% glucose compared with 2% glucose, a likely consequence of its inability to synthesize glycerol in response to the HEO. Importantly, cells that have a deletion of the chromosomal copy of GPD1 but that carry GPD1 under control of the ADH1 promoter (pADH_GPD1) were restored to a normal life span on 2% glucose (Fig. 7B). Based on raw intensity microarray data, we estimate that transcription from the ADH1 promoter is only 1.2-fold to 1.5-fold higher than transcription from the GPD1 promoter under normal osmotic conditions. Cells for which GPD1 expression is under control of the ADH1 promoter failed to show an increase in life span in response to HEO. This finding indicates that increased transcription of GPD1 is necessary for life span extension by osmotic stress.
FIG. 7.
Life span extension by high osmolarity requires increased expression of enzymes involved in biosynthesis of glycerol but not trehalose. (A) Life spans were determined for PSY316AR in 2% glucose (♦), PSY316AR in 20% glucose (▪), the gpd1 mutant in 2% glucose (▴), and the gpd1 mutant in 20% glucose (x). Mean life spans (numbers of cells analyzed) were as follows: PSY316AR 2% glucose, 22.7 generations (n = 40); PSY316AR 20% glucose, 28.4 generations (n = 38); gpd1 2% glucose, 15.9 generations (n = 40); and gpd1 20% glucose, 7.9 generations (n = 40). (B) Life spans were determined for PSY316AR in 2% glucose (♦), PSY316AR in 20% glucose (▪), the gpd1 pADH_ GPD1 mutant in 2% glucose (▴), and the gpd1 pADH_ GPD1 mutant in 20% glucose (x). Mean life spans (numbers of cells analyzed) were as follows: PSY316AR 2% glucose, 22.7 generations (n = 40); PSY316AR 20% glucose, 28.4 generations (n = 38); gpd1 pADH_GPD1 2% glucose, 22.1 generations (n = 40); and gpd1 pADH_GPD1 20% glucose, 21.9 generations (n = 40). (C) Life spans were determined for PSY316AR in 2% glucose (♦), the tps2 mutant in 2% glucose (▪), PSY316AR in 20% glucose (▴), and the tps2 mutant in 20% glucose (x). Mean life spans (numbers of cells analyzed) were as follows: PSY316AR 2% glucose, 20.4 generations (n = 37); tps2 2% glucose, 20.7 generations (n = 38); PSY316AR 20% glucose, 27.6 generations (n = 40); and tps2 20% glucose, 27.3 generations (n = 40). (D) Life spans were determined for PSY316AR in 2% glucose (♦), the cyt1 mutant in 2% glucose (▪), PSY316AR in 20% glucose (▴), and the cyt1 mutant in 20% glucose (x). Mean life spans (numbers of cells analyzed) were as follows: PSY316AR 2% glucose, 22.3 generations (n = 40); cyt1 2% glucose, 23.4 generations (n = 40); PSY316AR 20% glucose, 29.2 generations (n = 40); and cyt1 20% glucose, 31.2 generations (n = 40).
To test whether trehalose production is also required for increased longevity, we deleted TPS2, which substantially reduces production of trehalose (10, 17). The life span of the tps2 strain was indistinguishable from that of the wild-type strain in 2% glucose and displayed an extension like the wild-type strain in YPDGLU (Fig. 7C). These findings suggest that increased trehalose production is not required for the extension of life span by HEO.
Life span extension by HEO does not require respiration.
Life span extension by CR requires a shift in central metabolism from fermentation to respiration (27). Deletion of the gene coding for cytochrome _c_1, CYT1, prevents respiration and also prevents life span extension by CR. It is likely that HEO also causes a metabolic shift by shunting carbon away from glycolysis, in this case towards glycerol. However, respiration should not be required for life span extension by HEO, since NAD is generated by glycerol biosynthesis rather than by electron transport. We therefore deleted CYT1 and examined the life span when grown on YPD and YPDGLU. The cyt1 mutant cells exhibited the same long life span as wild-type cells on YPDGLU (Fig. 7D), demonstrating that HEO can be genetically distinguished from CR.
DISCUSSION
We showed previously that reduction of the glucose concentration in media from 2% to 0.5% extended the replicative life span of yeast mother cells. This finding is consistent with the many earlier observations that CR extends life span in animals. Here we report the surprising finding that increasing the glucose concentration also extends life span. This effect appears to be due to an increase in the osmolarity of the media, because provision of high concentrations of nonmetabolizable osmolytes also increases life span. This relationship between changes in osmolarity and life span has not been reported in any other organism to our knowledge.
How does HEO cause an extension in yeast life span? We propose that activation of the osmotic response in yeast results in a corresponding activation of Sir2p, thus resulting in increased longevity. Sir2 proteins are important determinants of longevity in both yeast and C. elegans (21, 43). Sir2p functions as an NAD-dependent histone deacetylase and it has been proposed that physiological perturbations that alter life span work by changing NAD levels in cells (14).
We have previously shown that Sir2p can be activated by the shift from fermentation to respiration caused by CR (27) and that this hyperactivation is likely to be the result of an increase in NAD available for Sir2p to use as a substrate. Consistent with our hypothesis, we find that life span extension by HEO requires both Sir2p and Npt1p. Furthermore, growth of cells on either YPDGLU or YPDS results in increased Sir2p-dependent telomere and rDNA silencing, as measured by reporter genes present at those loci (not shown).
One potential mechanism by which HEO could increase cytoplasmic and nuclear NAD levels is through the biosynthesis of glycerol. The glycerol synthetic pathway converts one molecule of NADH to NAD per molecule of glycerol synthesized and diverts carbon away from glycolysis and fermentation. In support of this model, we find that the glycerol biosynthetic genes GPD1 and HOR2 are transcriptionally upregulated in response to growth on YPDGLU.
Transcriptional upregulation of these genes in response to HEO is known to be dependent on activation of the Hog1p MAP kinase, and we show that life span extension by HEO also requires Hog1p. Furthermore, we demonstrate that increased transcription of Gpd1p is absolutely required for life span extension by HEO. The observation that mutation of either HOG1 or GPD1 shortens life span on YPD suggests that glycerol metabolism might be an important pathway for regulating cytoplasmic NAD levels and longevity even under normal osmotic growth conditions.
The most direct way to prove that nuclear and/or cytoplasmic NAD levels are increased in response to HEO would be to measure the amount of NAD in these compartments after exposure of cells to HEO. However, current technology does not allow us to perform this experiment, and previous attempts to detect changes in total cellular NAD in response to life span-extending treatments such as CR (S. Lin and L. Guarente, unpublished observations) or overexpression of Npt1p (3) have been unsuccessful. This has been interpreted to suggest that increased flux through the NAD salvage pathway, rather than an increase in total cellular NAD, is sufficient for Sir2-dependent life span extension (3). Our results cannot distinguish between these two possibilities.
It is of interest that the effect of HEO parallels the life span extension by CR in several different ways. First, both interventions require Sir2p and normal NAD biosynthesis. Second, both are predicted to slow glycolysis: HEO because of the diversion of carbon to glycerol and CR because of the shift of carbon toward the tricarboxylic acid cycle and respiration. Finally, whereas both interventions activate stress response pathways, this stress response is not required for increased longevity. However, our analysis has uncovered one striking difference between the life span extension by HEO and that by CR. Electron transport is required for increased longevity under CR, most likely because the delivery of electrons from NADH to the electron transport chain increases the NAD/NADH ratio. In contrast, electron transport is not required for life span extension by HEO. This observation can be explained by the fact that NAD is generated by the conversion of DHAP to glycerol under the condition of osmotic stress, which does not require respiration.
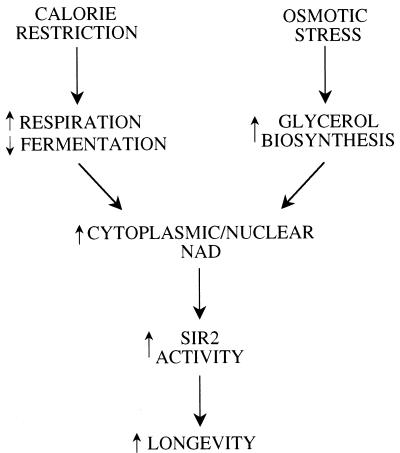
The absence of a synergistic effect on life span when CR is combined with HEO is consistent with a common genetic pathway. An alternative possibility is that CR and HEO both achieve a strain maximum life span beyond which no further extension is possible. However, we have identified a genetic manipulation that results in up to a 90% increase in the mean life span of strain PSY316 (manuscript in preparation), demonstrating that this is not the case. We explain the absence of synergy by a model in which both treatments extend life span by activating Sir2p (Fig. 8). For CR this is accomplished by a metabolic shift from fermentation to respiration. Under conditions of osmotic stress, a shift from glycolysis toward glycerol biosynthesis is responsible.
FIG. 8.
CR and high osmolarity both extend life span by activation of Sir2p through altered NAD metabolism. A model in which both CR and osmotic stress promote long life span by activating Sir2p is shown. In both cases, activation of Sir2p is mediated through an increase in the NAD available for Sir2p to use as a substrate for histone deacetylation. Under conditions of CR, this is accomplished by a metabolic shift from fermentation to respiration (24). Growth in the presence of high osmolarity could increase cytoplasmic NAD by upregulation of glycerol biosynthesis.
We describe here an environmental intervention, i.e., high osmolarity, which extends life span in yeast mother cells and resembles CR in some, but not all, respects. Our findings may suggest new experimental strategies to manipulate life span and identify protein targets that are amenable to pharmacological intervention to extend the life of a cell.
Acknowledgments
A.A.A. and M.K. contributed equally to this work.
We thank T. Kaeberlein for reading the manuscript, S. Lin and P. Park for providing strains and plasmids, and T. Galitski for his contributions in the development of microarrays and analytical software tools.
This work was supported by grants to L.G. from the National Institute of Health (NIH), The Ellison Medical Foundation, The Seaver Institute, and the Howard and Linda Stern Fund. G.R.F. is supported by grants from the NIH and is an American Cancer Society Professor of Genetics. A.A.A. is supported by the NIH Training Grant in Genomic Sciences, sponsored by the Biotechnology Process Engineering Center.
REFERENCES
- 1.Albertyn, J., S. Hohmann, J. M. Thevelein, and B. A. Prior. 1994. GPD1, which encodes glycerol-3-phosphate dehydrogenase, is essential for growth under osmotic stress in Saccharomyces cerevisiae, and its expression is regulated by the high-osmolarity glycerol response pathway. Mol. Cell. Biol. 14**:**4135-4144. [DOI] [PMC free article] [PubMed] [Google Scholar]
- 2.Alepuz, P. M., A. Jovanovic, V. Reiser, and G. Ammerer. 2001. Stress-induced map kinase Hog1 is part of transcription activation complexes. Mol. Cell 7**:**767-777. [DOI] [PubMed] [Google Scholar]
- 3.Anderson, R. M., K. J. Bitterman, J. G. Wood, O. Medvedik, H. Cohen, S. S. Lin, J. K. Manchester, J. I. Gordon, and D. A. Sinclair. 2002. Manipulation of a nuclear NAD+ salvage pathway delays aging without altering steady-state NAD+ levels. J. Biol. Chem. 277**:**18881-18890. [DOI] [PubMed] [Google Scholar]
- 4.Armstrong, C. M., M. Kaeberlein, S. Imai, and L. Guarente. 2002. Mutations in Saccharomyces cerevisiae gene SIR2 can have differential effects on in vivo silencing phenotypes and in vitro histone deacetylation activity. Mol. Biol. Cell 13**:**1427-1438. [DOI] [PMC free article] [PubMed] [Google Scholar]
- 5.Bell, M., R. Capone, I. Pashtan, A. Levitzki, and D. Engelberg. 2001. Isolation of hyperactive mutants of the MAPK p38/Hog1 that are independent of MAPK kinase activation. J. Biol. Chem. 276**:**25351-25358. [DOI] [PubMed] [Google Scholar]
- 6.Blomberg, A. 2000. Metabolic surprises in Saccharomyces cerevisiae during adaptation to saline conditions: questions, some answers and a model. FEMS Microbiol. Lett. 182**:**1-8. [DOI] [PubMed] [Google Scholar]
- 7.Bryk, M., M. Banerjee, M. Murphy, K. E. Knudsen, D. J. Garfinkel, and M. J. Curcio. 1997. Transcriptional silencing of Ty1 elements in the RDN1 locus of yeast. Genes Dev. 11**:**255-269. [DOI] [PubMed] [Google Scholar]
- 8.Causton, H. C., B. Ren, S. S. Koh, C. T. Harbison, E. Kanin, E. G. Jennings, T. I. Lee, H. L. True, E. S. Lander, and R. A. Young. 2001. Remodeling of yeast genome expression in response to environmental changes. Mol. Biol. Cell 12**:**323-337. [DOI] [PMC free article] [PubMed] [Google Scholar]
- 9.Costanzo, M. C., M. E. Crawford, J. E. Hirschman, J. E. Kranz, P. Olsen, L. S. Robertson, M. S. Skrzypek, B. R. Braun, K. L. Hopkins, P. Kondu, C. Lengieza, J. E. Lew-Smith, M. Tillberg, and J. I. Garrels. 2001. YPD, PombePD and WormPD: model organism volumes of the BioKnowledge library, an integrated resource for protein information. Nucleic Acids Res. 29**:**75-79. [DOI] [PMC free article] [PubMed] [Google Scholar]
- 10.De Virgilio, C., N. Burckert, W. Bell, P. Jeno, T. Boller, and A. Wiemken. 1993. Disruption of TPS2, the gene encoding the 100-kDa subunit of the trehalose-6-phosphate synthase/phosphatase complex in Saccharomyces cerevisiae, causes accumulation of trehalose-6-phosphate and loss of trehalose-6-phosphate phosphatase activity. Eur. J. Biochem. 212**:**315-323. [DOI] [PubMed] [Google Scholar]
- 11.Eisen, M. B., P. T. Spellman, P. O. Brown, and D. Botstein. 1998. Cluster analysis and display of genome-wide expression patterns. Proc. Natl. Acad. Sci. USA 95**:**14863-14868. [DOI] [PMC free article] [PubMed] [Google Scholar]
- 12.Gottlieb, S., and R. E. Esposito. 1989. A new role for a yeast transcriptional silencer gene, SIR2, in regulation of recombination in ribosomal DNA. Cell 56**:**771-776. [DOI] [PubMed] [Google Scholar]
- 13.Gottschling, D. E., O. M. Aparicio, B. L. Billington, and V. A. Zakian. 1990. Position effect at S. cerevisiae telomeres: reversible repression of Pol II transcription. Cell 63**:**751-762. [DOI] [PubMed] [Google Scholar]
- 14.Guarente, L. 2000. Sir2 links chromatin silencing, metabolism, and aging. Genes Dev. 14**:**1021-1026. [PubMed] [Google Scholar]
- 15.Guthrie, C., and G. R. Fink. 1991. Guide to yeast genetics and molecular biology. Methods Enzymol. 194**:**1-932. [PubMed] [Google Scholar]
- 16.Hosono, R., Y. Mitsui, Y. Sato, S. Aizawa, and J. Miwa. 1982. Life span of the wild and mutant nematode Caenorhabditis elegans. Effects of sex, sterilization, and temperature. Exp. Gerontol. 17**:**163-172. [DOI] [PubMed] [Google Scholar]
- 17.Hounsa, C. G., E. V. Brandt, J. Thevelein, S. Hohmann, and B. A. Prior. 1998. Role of trehalose in survival of Saccharomyces cerevisiae under osmotic stress. Microbiology 144**:**671-680. [DOI] [PubMed] [Google Scholar]
- 18.Imai, S., C. M. Armstrong, M. Kaeberlein, and L. Guarente. 2000. Transcriptional silencing and longevity protein Sir2 is an NAD-dependent histone deacetylase. Nature 403**:**795-800. [DOI] [PubMed] [Google Scholar]
- 19.Ivy, J. M., A. J. Klar, and J. B. Hicks. 1986. Cloning and characterization of four SIR genes of Saccharomyces cerevisiae. Mol. Cell. Biol. 6**:**688-702. [DOI] [PMC free article] [PubMed] [Google Scholar]
- 20.Kaeberlein, M., and L. Guarente. 2002. Saccharomyces cerevisiae MPT5 and SSD1 function in parallel pathways to promote cell wall integrity. Genetics 160**:**83-95. [DOI] [PMC free article] [PubMed] [Google Scholar]
- 21.Kaeberlein, M., M. McVey, and L. Guarente. 1999. The SIR2/3/4 complex and SIR2 alone promote longevity in Saccharomyces cerevisiae by two different mechanisms. Genes Dev. 13**:**2570-2580. [DOI] [PMC free article] [PubMed] [Google Scholar]
- 22.Klass, M. R. 1977. Aging in the nematode Caenorhabditis elegans: major biological and environmental factors influencing life span. Mech. Ageing Dev. 6**:**413-429. [DOI] [PubMed] [Google Scholar]
- 23.Landry, J., A. Sutton, S. T. Tafrov, R. C. Heller, J. Stebbins, L. Pillus, and R. Sternglanz. 2000. The silencing protein SIR2 and its homologs are NAD-dependent protein deacetylases. Proc. Natl. Acad. Sci. USA 97**:**5807-5811. [DOI] [PMC free article] [PubMed] [Google Scholar]
- 24.Larsson, K., R. Ansell, P. Eriksson, and L. Adler. 1993. A gene encoding sn-glycerol 3-phosphate dehydrogenase (NAD+) complements an osmosensitive mutant of Saccharomyces cerevisiae. Mol. Microbiol. 10**:**1101-1111. [DOI] [PubMed] [Google Scholar]
- 25.Le Bourg, E., and N. Minois. 1997. Increased longevity and resistance to heat shock in Drosophila melanogaster flies exposed to hypergravity. C. R. Acad. Sci. Ser. III 320**:**215-221. [DOI] [PubMed] [Google Scholar]
- 26.Lin, S. J., P. A. Defossez, and L. Guarente. 2000. Requirement of NAD and SIR2 for life-span extension by calorie restriction in Saccharomyces cerevisiae. Science 289**:**2126-2128. [DOI] [PubMed] [Google Scholar]
- 27.Lin, S. J., M. Kaeberlein, A. Andalis, L. Sturtz, P. A. Defossez, V. Culotta, G. Fink, and L. Guarente. 2002. Calorie restriction extends Saccharomyces cerevisiae life span by increasing respiration. Nature 418**:**344-348. [DOI] [PubMed] [Google Scholar]
- 28.Maeda, T., S. M. Wurgler-Murphy, and H. Saito. 1994. A two-component system that regulates an osmosensing MAP kinase cascade in yeast. Nature 369**:**242-245. [DOI] [PubMed] [Google Scholar]
- 29.McCay, C. M., M. F. Crowell, and L. A. Maynard. 1935. The effect of retarded growth upon the length of life and upon ultimate size. J. Nutr. 10**:**63-79. [PubMed] [Google Scholar]
- 30.Melov, S., J. Ravenscroft, S. Malik, M. S. Gill, D. W. Walker, P. E. Clayton, D. C. Wallace, B. Malfroy, S. R. Doctrow, and G. J. Lithgow. 2000. Extension of life-span with superoxide dismutase/catalase mimetics. Science 289**:**1567-1569. [DOI] [PubMed] [Google Scholar]
- 31.Millar, J. B. 1999. Stress-activated MAP kinase (mitogen-activated protein kinase) pathways of budding and fission yeasts. Biochem. Soc. Symp. 64**:**49-62. [PubMed] [Google Scholar]
- 32.Norbeck, J., A. K. Pahlman, N. Akhtar, A. Blomberg, and L. Adler. 1996. Purification and characterization of two isoenzymes of dl-glycerol-3-phosphatase from Saccharomyces cerevisiae. Identification of the corresponding GPP1 and GPP2 genes and evidence for osmotic regulation of Gpp2p expression by the osmosensing mitogen-activated protein kinase signal transduction pathway. J. Biol. Chem. 271**:**13875-13881. [DOI] [PubMed] [Google Scholar]
- 33.Park, P. U., P. A. Defossez, and L. Guarente. 1999. Effects of mutations in DNA repair genes on formation of ribosomal DNA circles and life span in Saccharomyces cerevisiae. Mol. Cell. Biol. 19**:**3848-3856. [DOI] [PMC free article] [PubMed] [Google Scholar]
- 34.Rep, M., M. Krantz, J. M. Thevelein, and S. Hohmann. 2000. The transcriptional response of Saccharomyces cerevisiae to osmotic shock. Hot1p and Msn2p/Msn4p are required for the induction of subsets of high osmolarity glycerol pathway-dependent genes. J. Biol. Chem. 275**:**8290-8300. [DOI] [PubMed] [Google Scholar]
- 35.Rep, M., V. Reiser, U. Gartner, J. M. Thevelein, S. Hohmann, G. Ammerer, and H. Ruis. 1999. Osmotic stress-induced gene expression in Saccharomyces cerevisiae requires Msn1p and the novel nuclear factor Hot1p. Mol. Cell. Biol. 19**:**5474-5485. [DOI] [PMC free article] [PubMed] [Google Scholar]
- 36.Rine, J., and I. Herskowitz. 1987. Four genes responsible for a position effect on expression from HML and HMR in Saccharomyces cerevisiae. Genetics 116**:**9-22. [DOI] [PMC free article] [PubMed] [Google Scholar]
- 37.Shama, S., C. Y. Lai, J. M. Antoniazzi, J. C. Jiang, and S. M. Jazwinski. 1998. Heat stress-induced life span extension in yeast. Exp. Cell Res. 245**:**379-388. [DOI] [PubMed] [Google Scholar]
- 38.Sherman, F., and J. Hicks. 1991. Micromanipulation and dissection of asci. Methods Enzymol. 194**:**21-37. [DOI] [PubMed] [Google Scholar]
- 39.Sikorski, R. S., and P. Hieter. 1989. A system of shuttle vectors and yeast host strains designed for efficient manipulation of DNA in Saccharomyces cerevisiae. Genetics 122**:**19-27. [DOI] [PMC free article] [PubMed] [Google Scholar]
- 40.Sinclair, D. A., and L. Guarente. 1997. Extrachromosomal rDNA circles—a cause of aging in yeast. Cell 91**:**1033-1042. [DOI] [PubMed] [Google Scholar]
- 41.Smith, J. S., and J. D. Boeke. 1997. An unusual form of transcriptional silencing in yeast ribosomal DNA. Genes Dev. 11**:**241-254. [DOI] [PubMed] [Google Scholar]
- 42.Smith, J. S., C. B. Brachmann, I. Celic, M. A. Kenna, S. Muhammad, V. J. Starai, J. L. Avalos, J. C. Escalante-Semerena, C. Grubmeyer, C. Wolberger, and J. D. Boeke. 2000. A phylogenetically conserved NAD+-dependent protein deacetylase activity in the Sir2 protein family. Proc. Natl. Acad. Sci. USA 97**:**6658-6663. [DOI] [PMC free article] [PubMed] [Google Scholar]
- 43.Tissenbaum, H. A., and L. Guarente. 2001. Increased dosage of a sir-2 gene extends lifespan in Caenorhabditis elegans. Nature 410**:**227-230. [DOI] [PubMed] [Google Scholar]
- 44.Weindruch, R. H., J. A. Kristie, K. E. Cheney, and R. L. Walford. 1979. Influence of controlled dietary restriction on immunologic function and aging. Fed. Proc. 38**:**2007-2016. [PubMed] [Google Scholar]
