MicroRNA expression in the adult mouse central nervous system (original) (raw)
Abstract
microRNAs are ∼22 nucleotide endogenous noncoding RNAs that post-transcriptionally repress expression of protein-coding genes by base-pairing with the 3′-untranslated regions of the target mRNAs. We present here an inventory of miRNA expression profiles from 13 neuroanatomically distinct areas of the adult mouse central nervous system (CNS). Microarray profiling in combination with real-time RT-PCR and LNA (locked nucleic acid)-based in situ hybridization uncovered 44 miRNAs displaying more than threefold enrichment in the spinal cord, cerebellum, medulla oblongata, pons, hypothalamus, hippocampus, neocortex, olfactory bulb, eye, and pituitary gland. These findings suggest that a large number of mouse CNS-expressed miRNAs may be associated with specific functions within these regions. Notably, more than 50% of the identified mouse CNS-enriched miRNAs showed different expression patterns compared to those reported in zebrafish, although the mature miRNA sequences are nearly 100% conserved between the two vertebrate species. The inventory of miRNA profiles in the adult mouse CNS presented here provides an important step toward further elucidation of miRNA function and miRNA-related gene regulatory networks in the mammalian central nervous system.
Keywords: microRNA, brain, central nervous system, LNA-ISH, microarray
INTRODUCTION
MicroRNAs (miRNAs) are small, endogenous noncoding RNA molecules that post-transcriptionally regulate expression of protein-coding genes (Bartel 2004; Kloosterman and Plasterk 2006). To date, 442 murine miRNA sequences have been deposited in the miRBase (Griffiths-Jones et al. 2006), while computational predictions estimate that the vertebrate genomes may contain up to ∼1000 miRNA genes (Bentwich et al. 2005; Berezikov et al. 2005). miRNAs are generated from long primary transcripts that are processed in multiple steps to cytoplasmic ∼22 nucleotide (nt) mature miRNAs (Bartel 2004; Du and Zamore 2005; Zeng 2006). The mature miRNA is incorporated into the miRNA-induced silencing complex (miRISC), which guides it to target sequences. Most animal miRNAs recognize their target sites located in 3′ UTRs by incomplete base-pairing, resulting in mRNA destabilization or translational repression of the target genes (He and Hannon 2004; Bushati and Cohen 2007).
Animal miRNAs have emerged as important players in the control of diverse biological processes (Bartel 2004; Wienholds and Plasterk 2005; Kloosterman and Plasterk 2006). During development, many miRNAs are expressed in neurons or show distinct expression patterns within the developing central nervous system (CNS), implying their importance in brain development and function (Krichevsky et al. 2003; Miska et al. 2004; Sempere et al. 2004; Smirnova et al. 2005; Wienholds et al. 2005). However, functional studies of miRNAs in the vertebrate nervous system are still very limited. Maternal-zygotic dicer mutant zebrafish that lack all mature miRNAs display abnormal brain morphogenesis and neural differentiation (Giraldez et al. 2005). Notably, injection of miR-430 rescues the brain defects in the mutant embryos, inferring a general role in zebrafish brain morphogenesis. In the developing chick neural tube, miR-124a is a component of a regulatory network, which controls the transition between neural progenitors and post-mitotic neurons, by suppressing the anti-neural factor SCP1 (Visvanathan et al. 2007). While miR-124a expression can be detected in E11.5 mouse embryos and it continues to be expressed in neurons of adult mice (Miska et al. 2004; Visvanathan et al. 2007), other miRNAs are temporally expressed during development of the CNS being repressed in the mature CNS (Miska et al. 2004). On the other hand, expression profiling in adult tissues has identified miRNAs enriched in the CNS, suggesting that these miRNAs could play important regulatory roles in mature neurons (Babak et al. 2004; Barad et al. 2004; Miska et al. 2004; Sempere et al. 2004; Thomson et al. 2004). Interestingly, many neuronal miRNAs appear to be localized to actively translating polyribosomes in dendrites, where they may control localized translation of dendrite-specific mRNAs (Kim et al. 2004). This is supported by a study, which showed that miR-134, a brain-specific microRNA, is present in dendrites, where it represses the local synthesis of the protein kinase Limk1 to regulate spine size (Schratt et al. 2006). Stimulation of neurons relieves miR-134-mediated inhibition of Limk1 translation, which, in turn, may contribute to synaptic plasticity (Schratt et al. 2006).
Several studies have implicated miRNAs in diseases of the CNS. For example, a mutation in the target site of miR-189 in the human SLITRK1 gene has been shown to be associated with Tourette's syndrome (Abelson et al. 2005), while another study has reported altered miRNA profiles in the prefrontal cortex of patients with schizophrenia and schizoaffective disorder (Perkins et al. 2007). In addition, conditional ablation of Dicer in murine post-mitotic Purkinje cells resulted in progressive loss of miRNAs, cerebellar degeneration, and development of ataxia (Schaefer et al. 2007).
Despite the accumulating evidence that miRNAs play important roles in brain development and disorders, our knowledge of miRNA function in the vertebrate nervous system is still very limited. By combining microarray expression profiling with miRNA-specific real-time RT-PCR and LNA-based miRNA in situ detection, we have determined the spatial expression patterns of mouse CNS-expressed miRNAs, which serve as an important basis for detailed studies of individual miRNAs, their target genes, and the miRNA-related regulatory networks in the mammalian central nervous system.
RESULTS AND DISCUSSION
MicroRNA array profiling of the adult mouse CNS
To determine miRNA expression patterns in the adult mouse CNS, 13 different areas of the CNS were dissected from three male balb/c mice: the spinal cord, cerebellum, medulla oblongata, pons, mesencephalon, thalamus, hypothalamus, hippocampus, amygdala, neocortex, olfactory bulb, eye, and pituitary gland. Total RNA samples from these tissues were subsequently pooled, fluorochrome-labeled, and hybridized to spotted miRNA microarrays, comprising LNA-modified probes for all mouse miRNAs in release 7.1 of the miRBase microRNA Registry (Castoldi et al. 2006; Griffiths-Jones et al. 2006). Additionally, RNA from the whole brain of two mice was isolated and analyzed individually.
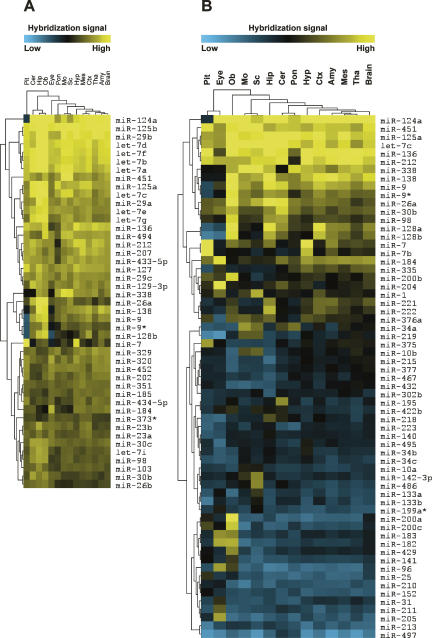
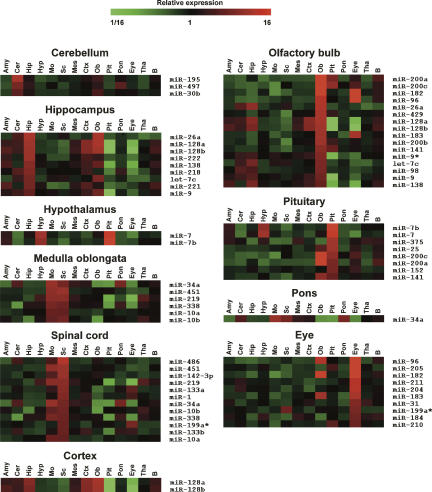
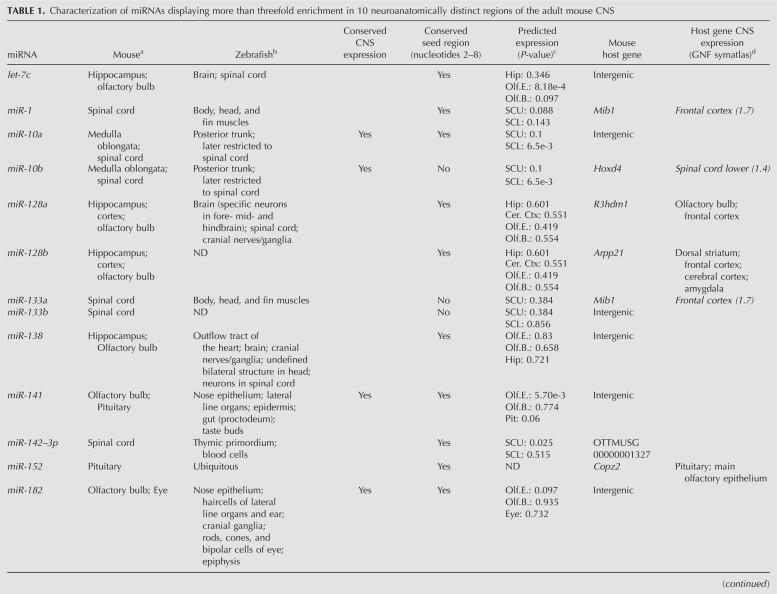
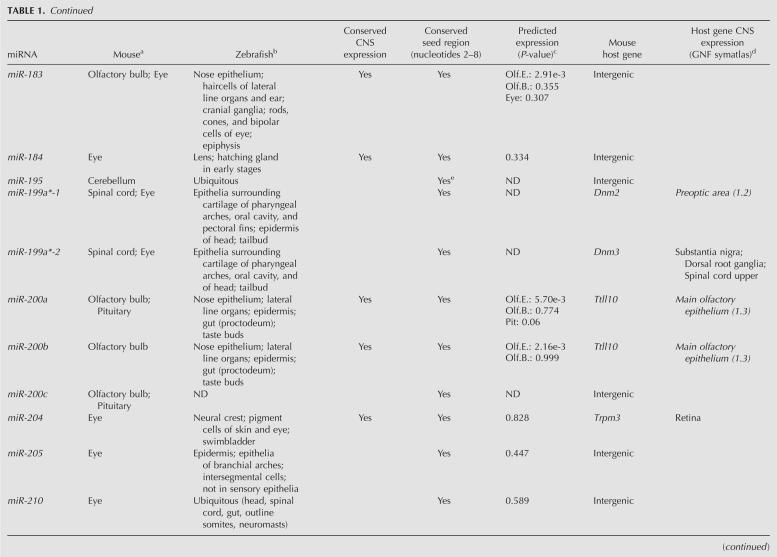
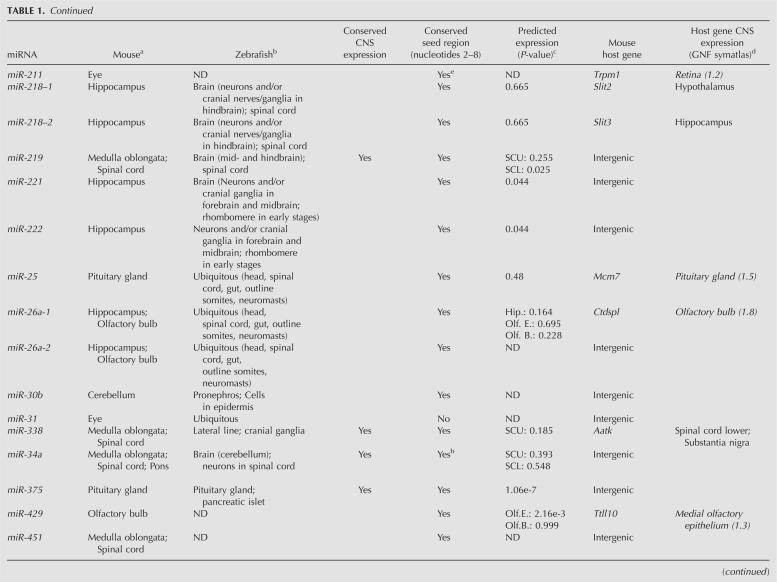
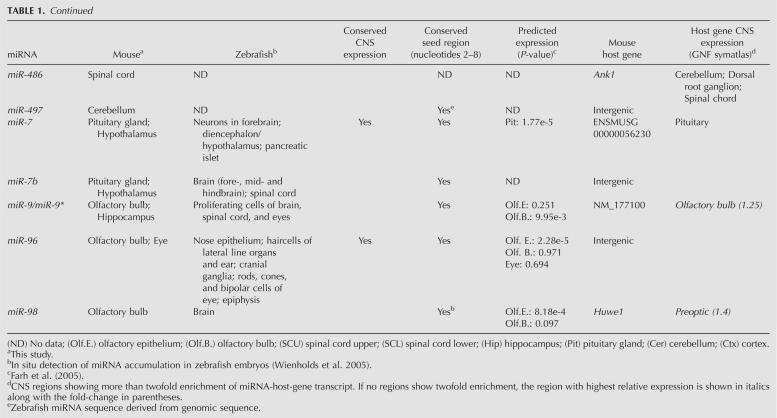
Expression profiling revealed that a large set of miRNAs is expressed in the adult mouse CNS. In agreement with previous reports, several miRNAs, including miR-9, miR-124a, miR-125b, miR-127, miR-128, and members of the let-7 family, were highly enriched in the mouse brain, giving strong hybridization signals on the miRNA arrays (Fig. 1A; Babak et al. 2004; Barad et al. 2004; Miska et al. 2004; Sempere et al. 2004; Shingara et al. 2005; Thomson et al. 2004). Many of these miRNAs appeared to be widely expressed in the central nervous system. However, 63 miRNAs showed evidence of being differentially expressed within the CNS (significance analysis of microarrays [SAM]; false discovery rate [ FDR = 0]) (Tusher et al. 2001), suggesting that they might be associated with region-specific functions (Fig. 1B). Compared to the average expression level across all the CNS regions included in this study, 44 miRNAs showed more than threefold enrichment in specific regions (Fig. 2). For example, miR-195, miR-497, and miR-30b were found to be enriched in the cerebellum. The medulla oblongata displayed enrichment of miR-34a, miR-451, miR-219, miR-338, miR-10a, and miR-10b. miR-7 and miR-7b were enriched in the hypothalamus. The hippocampus showed accumulation of miR-218, miR-221, miR-222, miR-26a, miR-128a/b, miR-138, and let-7c. We did not detect enrichment of any miRNAs in the amygdala, mesencephalon, and thalamus. Consistent with previous reports, we found that miR-7 and miR-7b were enriched in the pituitary and hypothalamus (Farh et al. 2005); miR-195 in the cerebellum (Hohjoh and Fukushima 2007); miR-375, miR-141, and miR-200a in the pituitary (Landgraf et al. 2007); whereas miR-10a and miR-10b were enriched in the spinal cord (Kloosterman et al. 2006). The results on miRNAs displaying more than threefold region-specific enrichment compared to the average expression levels across the entire CNS are summarized in Table 1.
FIGURE 1.
(A) Ubiquitously expressed miRNAs in the mouse central nervous system. Heat map of 45 miRNAs showing highest expression across all CNS regions including whole brain. (B) Region-specific miRNA expression in the adult mouse central nervous system identified by SAM analysis (FDR = 0). (Pit) Pituitary; (Ob) olfactory bulb; (Mo) medulla oblongata; (Sc) spinal cord; (Hip) hippocampus; (Cer) cerebellum; (Pon) pons; (Hyp) hypothalamus; (Ctx) cortex; (Amy) amygdala; (Mes) mesencephalon; (Tha) thalamus; (Brain) whole brain.
FIGURE 2.
Regionally enriched miRNAs in the mouse central nervous system. Heat maps of miRNAs displaying more than threefold enrichment in 10 areas of the adult mouse CNS compared to their average expression levels in all 13 regions (P < 0.05) as identified by multiclass SAM analysis (FDR = 0) followed by multiple one-sample _t_-tests. _P_-values were adjusted for multiple comparisons using the Bonferroni procedure. Shown are the average ratios of three replica hybridizations. (Pit) pituitary; (Ob) olfactory bulb; (Mo) medulla oblongata; (Sc) spinal cord; (Hip) hippocampus; (Cer) cerebellum; (Pon) pons; (Hyp) hypothalamus; (Ctx) neocortex; (Amy) amygdala; (Mes) mesencephalon; (Tha) thalamus; (B) whole brain.
TABLE 1.
Characterization of miRNAs displaying more than threefold enrichment in 10 neuroanatomically distinct regions of the adult mouse CNS
Assessment of miRNA expression by miRNA-specific real-time RT-PCR
To validate the microarray platform, we assessed the expression of a subset of miRNAs by real-time RT-PCR (Chen et al. 2005), using the same RNA samples that were applied to the microarrays. These included five differentially expressed miRNAs: miR-200a (olfactory bulb), miR-200c (olfactory bulb), miR-205 (eye), miR-195 (cerebellum), and miR-124a (absent from pituitary), as well as three miRNAs exhibiting a more uniform expression (let-7a, let-7d, and miR-29c). We found strong correlation between our microarray profiling and real-time RT-PCR data (R 2 = 0.63; R 2 = 0.93 when removing two outliers) (data not shown).
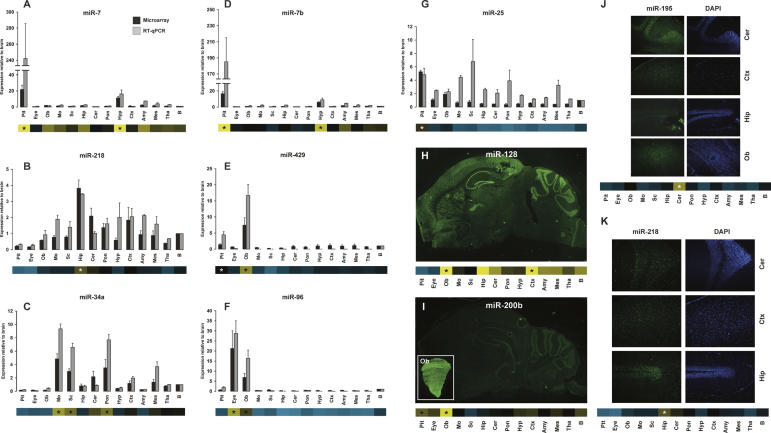
Next, we analyzed the expression patterns of seven miRNAs by real-time RT-PCR assays in 13 dissected CNS regions from three additional mice (Fig. 3A–G). miRNA-specific real-time RT-PCR data for miR-7, miR-7b, miR-34a, miR-96, miR-218, and miR-429 were consistent with our microarray profiling results. As shown in Figure 3, A and D, miR-7 and miR-7b were highly enriched in pituitary gland. Expression of miR-34a was approximately sixfold to ninefold higher in the spinal cord, medulla oblongata, and pons compared to whole mouse brain; miR-96 was highly enriched in the eye and olfactory bulb; and miR-218 in the hippocampus; while miR-429 was prevalent in the olfactory bulb, compared to whole brain. However, we could not confirm pituitary-specific enrichment of miR-25, as it was also found to be enriched in medulla oblongata, spinal cord, pons, and mesencephalon by real-time RT-PCR (Fig. 3G).
FIGURE 3.
microRNA expression in the adult mouse CNS assessed by miRNA-specific (A–G) real-time RT-PCR and (H–K) in situ hybridization. Expression of (A) miR-7, (B) miR-218, (C) miR-34a, (D) miR-7b, (E) miR-429, (F) miR-96, and (G) miR-25 in different adult mouse CNS regions relative to whole brain was determined by miRNA-specific real-time RT-PCR assays. Error bars of real-time RT-PCR data indicate the standard error of the mean of three biological replicates; error bars of microarray data indicate the standard error of the mean of three replica hybridizations. Heat maps below bar diagrams show the microarray expression profile for each investigated miRNA. Stars in heat maps indicate the brain areas in which the miRNA was enriched. Expression of (H) miR-128, (I) miR-200b, (J) miR-195, and (K) miR-218 detected by LNA-based in situ hybridization on saggital sections of the adult mouse brain. miR-128 is expressed in the neocortex, striatum, thalamus, hippocampus, and the cerebellum (H). (I, inset) LNA-ISH of miR-200b on a coronal section of the olfactory bulb. (I) miR-200b is highly expressed in the olfactory bulb as compared to other regions. (J) The strongest in situ hybridization signal for miR-195 was detected in the cerebellum, whereas (K) in situ detection of miR-218 showed weak expression in most regions. (Pit) pituitary; (Ob) olfactory bulb; (Mo) medulla oblongata; (Sc) spinal cord; (Hip) hippocampus; (Cer) cerebellum; (Pon) pons; (Hyp) hypothalamus; (Ctx) neocortex; (Amy) amygdala; (Mes) mesencephalon; (Tha) thalamus; (B) whole brain.
In situ detection of miRNA accumulation in the mouse CNS
The spatial expression patterns of two miRNAs identified as differentially expressed by microarray profiling were determined by in situ hybridization (ISH) using LNA probes (Fig. 3H,I; Wienholds et al. 2005; Kloosterman et al. 2006; Obernosterer et al. 2007; Silahtaroglu et al. 2007). LNA-ISH of miR-128 and miR-200b was carried out in sagittal sections of adult mouse brain. miR-128 accumulation was detected in the neocortex, striatum, hippocampus, thalamus, and granular layer of cerebellum. Microarray profiling inferred strong enrichment of miR-200b in the olfactory bulb. Consistent with our array results, we observed strong in situ signals for miR-200b in coronal sections of the olfactory bulb (Fig. 3I, inset), whereas weaker signals were observed in other regions of the brain (Fig. 3I). The strongest in situ hybridization signal for miR-195 was detected in the cerebellum (Fig. 3J), whereas in situ detection of miR-218 showed weak expression in most regions (Fig. 3K), concurring with our miRNA array data. Taken together, we find good correlation between our miRNA array expression profiling data and the LNA-ISH results. In addition, our data demonstrate the utility of ISH in the determination of spatial miRNA accumulation in the CNS at high resolution, which is a prerequisite for future studies of individual miRNAs and their target genes in the mammalian central nervous system.
Coordinated expression of miRNAs and their host genes
Many miRNAs located within protein-coding and non-protein-coding genes are transcriptionally linked to the expression of their host genes (Rodriguez et al. 2004). In order to investigate the coordinated expression of the differentially expressed miRNAs identified in this study with their predicted host transcripts, we compiled the mRNA expression data of the relevant protein-coding genes, which are summarized in Table 1 (GNF SymAtlas version 1.2.4) (Su et al. 2004). A large group of the CNS region-specific miRNAs that reside within other genes shows highest expression levels in the same regions as their host genes, implying that they are cotranscribed. For example, the hippocampus-enriched miR-218-1 and miR-218-2 genes are located within Slit2 and Slit3. Accordingly, the Slit3 gene displays highest expression in the hippocampus. Another example is the pituitary-specific miR-152, which at the genomic level is localized within the Copz2 gene, which also shows most prevalent expression in the pituitary. Furthermore, our results infer miR-204 as highly enriched in the eye, which is in good agreement with a previous study demonstrating coexpression of miR-204 and its host gene Trpm3 in adult mouse eye (Karali et al. 2007). Finally, miR-10a appears to be more prevalent in the spinal cord compared to other regions. This is consistent with miR-10a being located within Hoxd4 (ENSMUST00000047904), which also shows highest expression levels in the spinal cord and medulla oblongata. However, it is important to note that failure of identifying coexpression of miRNA and the host gene does not exclude the possibility that they share the same set of transcriptional control elements. Differences in turnover or processing of a miRNA and its host gene could result in highly different expression levels within the same tissue.
miRNAs that are closely linked at the genomic level often exhibit coordinated expression between different tissues, indicating that they share common _cis_-regulatory elements or are derived from polycistronic precursors (Sempere et al. 2004; Baskerville and Bartel 2005). In the present study, we found high correlation of expression of the miRNA cluster hosted by the protein-coding gene Ttll10: miR-429|miR-200a|miR-200b (R = 0.81–0.89) and the following, independently transcribed miRNA clusters: (1) miR-221|miR-222 (R = 0.89), (2) miR-96|miR-183 (R = 0.92), (3) miR-200c|miR-141 (R = 0.89), (4) miR-195|miR-497 (R = 0.86), and (5) miR-99a|let-7c (R = 0.80).
Expression of miRNAs and their predicted targets in the mouse CNS
A major challenge in understanding the biology of microRNAs is to identify their target genes. While plant miRNAs are generally perfectly complementary to their target mRNAs, most animal miRNAs pair to the 3′ UTRs of their targets by incomplete base-pairing, in which nucleotides 2–7 of the mature miRNA sequence, termed the seed region, appear to be critical for target site recognition (Lewis et al. 2005). Previous computational analyses of microarray data have shown that predicted mRNA targets of several highly tissue-specific miRNAs are expressed at significantly lower levels in the same tissues compared to tissues where such miRNAs are not expressed (Farh et al. 2005; Sood et al. 2006). For example, miR-1 is highly prevalent in the heart and skeletal muscle, whereas the predicted targets of miR-1 are expressed at significantly lower levels in heart and skeletal muscle compared to other tissues (Sood et al. 2006). This can be explained by miRNA-mediated destabilization of target mRNA levels, which lends experimental support from studies reporting degradation of large numbers of target mRNAs upon transfection of exogenous miRNA into cells or de-repression of targets upon antagonizing specific miRNAs by antagomirs in vivo (Krutzfeldt et al. 2005; Lim et al. 2005). On the basis of depletion of 7-mer seed sites in the 3′-UTRs of mammalian mRNAs, Farh et al. (2005) predicted the expression signatures of 73 miRNA families conserved among the four sequenced mammals and zebrafish in 61 tissues. In this study, we were able to experimentally confirm the predicted expression patterns for many of the aforementioned miRNAs (Table 1). For example, miR-375 and miR-7 are predicted to be expressed in the pituitary and, indeed, our results show highest accumulation of both miR-7 and miR-375 in the pituitary. Furthermore, miR-96, miR-200a, miR-200b, miR-141, and miR-183 all are predicted to be expressed in the olfactory epithelium, which is consistent with our results showing enrichment of these miRNAs in the olfactory bulb. We also find miR-10a and miR-10b to be enriched in both medulla oblongata and spinal cord, which is consistent with their predicted accumulation in the lower spinal cord (Farh et al. 2005). Notably, we also find enriched miRNAs in CNS regions in which they were not predicted to be expressed (Table 1). Our findings that miR-34a is more highly expressed in the medulla oblongata, pons, and spinal cord compared to other regions of the CNS, and that miR-204 and miR-205 are prevalently expressed in the eye, suggest that these miRNAs might be coexpressed with their targets. Regional coexpression of miRNAs and their targets has been reported. Coexpression of miR-200b and one of its targets Zfhx1b, as well as miR-189 and its target Slitrk1, is observed in several areas of the adult mouse brain (Abelson et al. 2005; Christoffersen et al. 2007). Additionally, luciferase reporter assays have identified myotrophin (Mtpn) as a target of miR-124 regulation (Krek et al. 2005), both of which are highly expressed in neurons throughout the brain (Fujigasaki et al. 1996). Hence, it is tempting to speculate that miRNAs expressed in the same tissues as their target genes might function by fine-tuning their expression rather than by completely suppressing them.
Comparison of miRNA expression between zebrafish and mouse
Highly divergent expression patterns of conserved miRNAs in zebrafish, medaka, chicken, and mouse have previously been reported (Ason et al. 2006). For example, while miR-125b is ubiquitously expressed in the brain and spinal cord of zebrafish, its expression is confined to the mid-hindbrain boundary in the mouse (Ason et al. 2006). Comparison of the expression profiles of the 44 differentially expressed mouse CNS miRNAs identified in this study with those reported by Wienholds et al. (2005) revealed conserved expression for 15 out of 36 miRNAs between zebrafish and mouse (Table 1). Examples of miRNAs with conserved expression include miR-200b and miR-375 and miR-204, which are enriched in the olfactory bulb, pituitary, and eye, respectively, as well as miR-96, which is enriched in the olfactory bulb and eye. In contrast, the expression patterns of 21 mouse CNS-enriched miRNAs appeared to be divergent from those of zebrafish, although the mature miRNA sequences are nearly 100% conserved between the two vertebrates, while all except four miRNAs show 100% conservation in their seed regions (Table 1). Clear examples of divergent expression patterns between zebrafish and mouse CNS are miR-31, which is enriched in the eye in mice, whereas it is ubiquitously expressed in zebrafish; and miR-195, which in mice is enriched in the cerebellum, whereas in zebrafish it displays widespread expression. Additionally, miR-142-3p expression is enriched in the medulla oblongata and spinal cord in mice but confined to the thymus and blood cells in zebrafish.
The mammalian CNS is highly complex with a broad, fine-tuned network of molecular interactions, in which processes such as learning and memory, neuronal repair, and regeneration are dependent on highly orchestrated gene expression programs. miRNAs have emerged as important post-transcriptional regulators of developmental and physiological processes, including neuronal differentiation and brain development and function. The previously reported differences in vertebrate miRNA expression patterns among four vertebrate species (Ason et al. 2006) along with our findings here may reflect differences in species physiology, including the complex cell-type compositions of the vertebrate nervous systems. Recent reports suggest that miRNAs can regulate dendritic spine size (Schratt et al. 2006) and neuronal morphogenesis (Vo et al. 2005), whereas massive parallel sequencing of small RNA libraries from human and chimpanzee brain has revealed highly complex miRNA repertoires in the primate brain (Berezikov et al. 2006). It is therefore tempting to speculate that miRNAs could play important roles in the complex gene-regulatory circuits of the mammalian CNS and may provide an important contribution to evolution of biological complexity. In conclusion, the inventory of miRNA profiles in the adult mouse CNS presented here provides an important step toward further elucidation of miRNA function and miRNA-related gene regulatory networks in the mammalian central nervous system.
MATERIALS AND METHODS
Mouse tissues
Brain regions from adult male Balb/c mice were dissected with RNaseZap (Ambion) treated tools and immediately transferred to RNAlater medium (Ambion). RNA was isolated using Trizol reagent (Invitrogen) as described by the manufacturer, except that 85% ethanol instead of 75% ethanol was used to wash the RNA pellet. Additionally, 10–15 μg of glycogen (Ambion) was added as carrier prior to precipitation. RNA integrity was assessed on 2% agarose gels stained with ethidium bromide and quantified using a Ribogreen RNA quantification kit (Invitrogen) and a fluorometer (Thermo Scientific).
Microarray printing, labeling, and hybridization
LNA-modified oligonucleotide probes for all mouse microRNAs annotated in miRBase version 7.1 were obtained from Exiqon (miRCURY version 7.1; Exiqon). Probes were diluted to a final concentration of 10 μM in printing buffer (150 mM sodium phosphate at pH 8.5) and printed onto Codelink slides (GE Healthcare) using a MicroGrid TAS II arrayer (Biorobotics). Spotted slides were post-processed according to the manufacturer's recommendations. Total RNA (2–4 μg) was 3′-end-labeled using T4 RNA ligase and a Cy3-labeled RNA linker (Cole et al. 2004; Wienholds et al. 2005) by the following procedure: RNA in 4.5 μL of water was combined with 0.8 μL of T4 RNA ligase buffer (10×) (Ambion), 1.1 μL of polyethyleneglycol (50% [w/v]), 0.8 μL of RNA-linker (250 μM; DNA Technology), and 0.8 μL of T4 RNA ligase (Ambion). The reaction was incubated for 2 h at 30°C, and terminated by incubation for 3 min at 80°C. Labeled RNA (8 μL) was combined with 6 μL of 20× SSC (Ambion), 1.5 μL of herring sperm DNA (10 mg/mL; Roche), 11.4 μL of formamide (Sigma), 0.6 μL of 5% SDS (Ambion), and 2.5 μL of DEPC-treated water. Samples were denatured for 1–2 min at 80°C and hybridized to the microarray for 16–20 h at 65°C under a lifterslip (Erie Scientific). Post-hybridization washes were in 4× SSC at 60°C to remove the coverslip, followed by three times in 2× SSC, 0.025% SDS for 5 min each, three times in 0.8× SSC for 2 min each, and two times in 0.4× SSC for 3 min each.
Microarray data analysis
Microarray slides were scanned using an ArrayWorx Biochip Reader (Applied Precision). Scanning images were analyzed using GridGrinder (http://gridgrinder.sourceforge.net/). Background-subtracted spot intensities were normalized using variance stabilization normalization (Huber et al. 2002). Significance analysis of microarrays (SAM) was used to identify miRNAs differentially expressed between samples (FDR = 0) (Tusher et al. 2001). Brain-area-enriched miRNAs were identified by one-sample _t_-tests using pooled variances (P < 0.05). _P_-values were adjusted for multiple comparisons using the Bonferroni procedure. Clustering and visualization of expression data were done with MultiExperimentViewer (www.tm4.org) (Saeed et al. 2003).
Real-time RT-PCR
Real-time RT-PCR analyses were carried out using TaqMan MicroRNA Assays (Applied Biosystems) according to the manual. Relative expression was calculated using the ΔΔCT method (Livak and Schmittgen 2001) and normalized to the expression of snoRNA202 (Applied Biosystems).
Detection of spatial miRNA accumulation by in situ hybridization
In situ hybridizations were performed in 10-μm cryosections from adult mouse brain. Sections were fixed in 4% paraformaldehyde and acetylated in acetic anhydride/triethanolamine, followed by washes in PBS. Sections were then pre-hybridized in hybridization solution (50% formamide, 5× SSC, 0.5 mg/mL yeast tRNA, 1× Denhardt's solution) at 25°C below the predicted T m value of the LNA probe for 30 min. Probes (3 pmol) (LNA miRCURY probe; Exiqon) were DIG-labeled (DIG Oligonucleotide 3′ Tailing Kit; Roche Applied Sciences) and hybridized to the sections for 1 h at the same temperature as pre-hybridization. After post-hybridization washes in 0.1× SSC at 55°C, the in situ hybridization signals were detected using the tyramide signal amplification system (PerkinElmer) according to the manufacturer's instructions. Slides were mounted in Prolong Gold containing DAPI (Invitrogen) and analyzed with an Olympus MVX10 microscope equipped with a CCD camera and Olympus CellF software.
ACKNOWLEDGMENTS
This study is supported by grants from the Lundbeck Foundation, the Danish National Advanced Technology Foundation, the Læge Sofus Carl Emil Friis and hustru Olga Friis' Legat, the Nationales Genomforschungsnetz (NGFN, 0313358A), and the European Commission as part of the RIBOREG EU FP6 project (LSHG-CT-2003503022). Wilhelm Johannsen Centre for Functional Genome Research is established by the Danish National Research Foundation.
Footnotes
REFERENCES
- Abelson, J.F., Kwan, K.Y., O'Roak, B.J., Baek, D.Y., Stillman, A.A., Morgan, T.M., Mathews, C.A., Pauls, D.L., Rasin, M.R., Gunel, M., et al. Sequence variants in SLITRK1 are associated with Tourette's syndrome. Science. 2005;310:317–320. doi: 10.1126/science.1116502. [DOI] [PubMed] [Google Scholar]
- Ason, B., Darnell, D.K., Wittbrodt, B., Berezikov, E., Kloosterman, W.P., Wittbrodt, J., Antin, P.B., Plasterk, R.H. Differences in vertebrate microRNA expression. Proc. Natl. Acad. Sci. 2006;103:14385–14389. doi: 10.1073/pnas.0603529103. [DOI] [PMC free article] [PubMed] [Google Scholar]
- Babak, T., Zhang, W., Morris, Q., Blencowe, B.J., Hughes, T.R. Probing microRNAs with microarrays: Tissue specificity and functional inference. RNA. 2004;10:1813–1819. doi: 10.1261/rna.7119904. [DOI] [PMC free article] [PubMed] [Google Scholar]
- Barad, O., Meiri, E., Avniel, A., Aharonov, R., Barzilai, A., Bentwich, I., Einav, U., Gilad, S., Hurban, P., Karov, Y., et al. MicroRNA expression detected by oligonucleotide microarrays: System establishment and expression profiling in human tissues. Genome Res. 2004;14:2486–2494. doi: 10.1101/gr.2845604. [DOI] [PMC free article] [PubMed] [Google Scholar]
- Bartel, D.P. MicroRNAs: Genomics, biogenesis, mechanism, and function. Cell. 2004;116:281–297. doi: 10.1016/s0092-8674(04)00045-5. [DOI] [PubMed] [Google Scholar]
- Baskerville, S., Bartel, D.P. Microarray profiling of microRNAs reveals frequent coexpression with neighboring miRNAs and host genes. RNA. 2005;11:241–247. doi: 10.1261/rna.7240905. [DOI] [PMC free article] [PubMed] [Google Scholar]
- Bentwich, I., Avniel, A., Karov, Y., Aharonov, R., Gilad, S., Barad, O., Barzilai, A., Einat, P., Einav, U., Meiri, E., et al. Identification of hundreds of conserved and nonconserved human microRNAs. Nat. Genet. 2005;37:766–770. doi: 10.1038/ng1590. [DOI] [PubMed] [Google Scholar]
- Berezikov, E., Guryev, V., van de Belt, J., Wienholds, E., Plasterk, R.H., Cuppen, E. Phylogenetic shadowing and computational identification of human microRNA genes. Cell. 2005;120:21–24. doi: 10.1016/j.cell.2004.12.031. [DOI] [PubMed] [Google Scholar]
- Berezikov, E., Thuemmler, F., van Laake, L.W., Kondova, I., Bontrop, R., Cuppen, E., Plasterk, R.H. Diversity of microRNAs in human and chimpanzee brain. Nat. Genet. 2006;38:1375–1377. doi: 10.1038/ng1914. [DOI] [PubMed] [Google Scholar]
- Bushati, N., Cohen, S.M. microRNA functions. Annu. Rev. Cell Dev. Biol. 2007;23:175–205. doi: 10.1146/annurev.cellbio.23.090506.123406. [DOI] [PubMed] [Google Scholar]
- Castoldi, M., Schmidt, S., Benes, V., Noerholm, M., Kulozik, A.E., Hentze, M.W., Muckenthaler, M.U. A sensitive array for microRNA expression profiling (miChip) based on locked nucleic acids (LNA) RNA. 2006;12:913–920. doi: 10.1261/rna.2332406. [DOI] [PMC free article] [PubMed] [Google Scholar]
- Chen, C., Ridzon, D.A., Broomer, A.J., Zhou, Z., Lee, D.H., Nguyen, J.T., Barbisin, M., Xu, N.L., Mahuvakar, V.R., Andersen, M.R., et al. Real-time quantification of microRNAs by stem–loop RT-PCR. Nucleic Acids Res. 2005;33:e179. doi: 10.1093/nar/gni178. [DOI] [PMC free article] [PubMed] [Google Scholar]
- Christoffersen, N.R., Silahtaroglu, A., Orom, U.A., Kauppinen, S., Lund, A.H. miR-200b mediates post-transcriptional repression of ZFHX1B. RNA. 2007;13:1172–1178. doi: 10.1261/rna.586807. [DOI] [PMC free article] [PubMed] [Google Scholar]
- Cole, K., Truong, V., Barone, D., McGall, G. Direct labeling of RNA with multiple biotins allows sensitive expression profiling of acute leukemia class predictor genes. Nucleic Acids Res. 2004;32:e86. doi: 10.1093/nar/gnh085. [DOI] [PMC free article] [PubMed] [Google Scholar]
- Du, T., Zamore, P.D. microPrimer: The biogenesis and function of microRNA. Development. 2005;132:4645–4652. doi: 10.1242/dev.02070. [DOI] [PubMed] [Google Scholar]
- Farh, K.K., Grimson, A., Jan, C., Lewis, B.P., Johnston, W.K., Lim, L.P., Burge, C.B., Bartel, D.P. The widespread impact of mammalian microRNAs on mRNA repression and evolution. Science. 2005;310:1817–1821. doi: 10.1126/science.1121158. [DOI] [PubMed] [Google Scholar]
- Fujigasaki, H., Song, S.Y., Kobayashi, T., Yamakuni, T. Murine central neurons express a novel member of the cdc10/SWI6 motif-containing protein superfamily. Brain Res. Mol. Brain Res. 1996;40:203–213. doi: 10.1016/0169-328x(96)00005-8. [DOI] [PubMed] [Google Scholar]
- Giraldez, A.J., Cinalli, R.M., Glasner, M.E., Enright, A.J., Thomson, J.M., Baskerville, S., Hammond, S.M., Bartel, D.P., Schier, A.F. MicroRNAs regulate brain morphogenesis in zebrafish. Science. 2005;308:833–838. doi: 10.1126/science.1109020. [DOI] [PubMed] [Google Scholar]
- Griffiths-Jones, S., Grocock, R.J., van Dongen, S., Bateman, A., Enright, A.J. miRBase: MicroRNA sequences, targets, and gene nomenclature. Nucleic Acids Res. 2006;34:D140–D144. doi: 10.1093/nar/gkj112. [DOI] [PMC free article] [PubMed] [Google Scholar]
- He, L., Hannon, G.J. MicroRNAs: Small RNAs with a big role in gene regulation. Nat. Rev. Genet. 2004;5:522–531. doi: 10.1038/nrg1379. [DOI] [PubMed] [Google Scholar]
- Hohjoh, H., Fukushima, T. Expression profile analysis of microRNA (miRNA) in mouse central nervous system using a new miRNA detection system that examines hybridization signals at every step of washing. Gene. 2007;391:39–44. doi: 10.1016/j.gene.2006.11.018. [DOI] [PubMed] [Google Scholar]
- Huber, W., von Heydebreck, A., Sultmann, H., Poustka, A., Vingron, M. Variance stabilization applied to microarray data calibration and to the quantification of differential expression. Bioinformatics. 2002;18(Suppl. 1):S96–S104. doi: 10.1093/bioinformatics/18.suppl_1.s96. [DOI] [PubMed] [Google Scholar]
- Karali, M., Peluso, I., Marigo, V., Banfi, S. Identification and characterization of microRNAs expressed in the mouse eye. Invest. Ophthalmol. Vis. Sci. 2007;48:509–515. doi: 10.1167/iovs.06-0866. [DOI] [PubMed] [Google Scholar]
- Kim, J., Krichevsky, A., Grad, Y., Hayes, G.D., Kosik, K.S., Church, G.M., Ruvkun, G. Identification of many microRNAs that copurify with polyribosomes in mammalian neurons. Proc. Natl. Acad. Sci. 2004;101:360–365. doi: 10.1073/pnas.2333854100. [DOI] [PMC free article] [PubMed] [Google Scholar]
- Kloosterman, W.P., Plasterk, R.H. The diverse functions of microRNAs in animal development and disease. Dev. Cell. 2006;11:441–450. doi: 10.1016/j.devcel.2006.09.009. [DOI] [PubMed] [Google Scholar]
- Kloosterman, W.P., Wienholds, E., de Bruijn, E., Kauppinen, S., Plasterk, R.H. In situ detection of miRNAs in animal embryos using LNA-modified oligonucleotide probes. Nat. Methods. 2006;3:27–29. doi: 10.1038/nmeth843. [DOI] [PubMed] [Google Scholar]
- Krek, A., Grün, D., Poy, M.N., Wolf, R., Rosenberg, L., Epstein, E.J., MacMenamin, P., da Piedade, I., Gunsalus, K.C., Stoffel, M., et al. Combinatorial microRNA target predictions. Nat. Genet. 2005;37:495–500. doi: 10.1038/ng1536. [DOI] [PubMed] [Google Scholar]
- Krichevsky, A.M., King, K.S., Donahue, C.P., Khrapko, K., Kosik, K.S. A microRNA array reveals extensive regulation of microRNAs during brain development. RNA. 2003;9:1274–1281. doi: 10.1261/rna.5980303. [DOI] [PMC free article] [PubMed] [Google Scholar]
- Krutzfeldt, J., Rajewsky, N., Braich, R., Rajeev, K.G., Tuschl, T., Manoharan, M., Stoffel, M. Silencing of microRNAs in vivo with “antagomirs.”. Nature. 2005;438:685–689. doi: 10.1038/nature04303. [DOI] [PubMed] [Google Scholar]
- Landgraf, P., Rusu, M., Sheridan, R., Sewer, A., Iovino, N., Aravin, A., Pfeffer, S., Rice, A., Kamphorst, A.O., Landthaler, M., et al. A mammalian microRNA expression atlas based on small RNA library sequencing. Cell. 2007;129:1401–1414. doi: 10.1016/j.cell.2007.04.040. [DOI] [PMC free article] [PubMed] [Google Scholar]
- Lewis, B.P., Burge, C.B., Bartel, D.P. Conserved seed pairing, often flanked by adenosines, indicates that thousands of human genes are microRNA targets. Cell. 2005;120:15–20. doi: 10.1016/j.cell.2004.12.035. [DOI] [PubMed] [Google Scholar]
- Lim, L.P., Lau, N.C., Garrett-Engele, P., Grimson, A., Schelter, J.M., Castle, J., Bartel, D.P., Linsley, P.S., Johnson, J.M. Microarray analysis shows that some microRNAs downregulate large numbers of target mRNAs. Nature. 2005;433:769–773. doi: 10.1038/nature03315. [DOI] [PubMed] [Google Scholar]
- Livak, K.J., Schmittgen, T.D. Analysis of relative gene expression data using real-time quantitative PCR and the
 method. Methods. 2001;25:402–408. doi: 10.1006/meth.2001.1262. [DOI] [PubMed] [Google Scholar]
 - Miska, E.A., Alvarez-Saavedra, E., Townsend, M., Yoshii, A., Sestan, N., Rakic, P., Constantine-Paton, M., Horvitz, H.R. Microarray analysis of microRNA expression in the developing mammalian brain. Genome Biol. 2004;5:R68. doi: 10.1186/gb-2004-5-9-r68. [DOI] [PMC free article] [PubMed] [Google Scholar]
- Obernosterer, G., Martinez, J., Alenius, M. Locked nucleic acid-based in situ detection of microRNAs in mouse tissue sections. Nat. Protoc. 2007;2:1508–1514. doi: 10.1038/nprot.2007.153. [DOI] [PubMed] [Google Scholar]
- Perkins, D.O., Jeffries, C.D., Jarskog, L.F., Thomson, J.M., Woods, K., Newman, M.A., Parker, J.S., Jin, J., Hammond, S.M. microRNA expression in the prefrontal cortex of individuals with schizophrenia and schizoaffective disorder. Genome Biol. 2007;8:R27. doi: 10.1186/gb-2007-8-2-r27. [DOI] [PMC free article] [PubMed] [Google Scholar]
- Rodriguez, A., Griffiths-Jones, S., Ashurst, J.L., Bradley, A. Identification of mammalian microRNA host genes and transcription units. Genome Res. 2004;14:1902–1910. doi: 10.1101/gr.2722704. [DOI] [PMC free article] [PubMed] [Google Scholar]
- Saeed, A.I., Sharov, V., White, J., Li, J., Liang, W., Bhagabati, N., Braisted, J., Klapa, M., Currier, T., Thiagarajan, M., et al. TM4: A free, open-source system for microarray data management and analysis. Biotechniques. 2003;34:374–378. doi: 10.2144/03342mt01. [DOI] [PubMed] [Google Scholar]
- Schaefer, A., O'Carroll, D., Tan, C.L., Hillman, D., Sugimori, M., Llinas, R., Greengard, P. Cerebellar neurodegeneration in the absence of microRNAs. J. Exp. Med. 2007;204:1553–1558. doi: 10.1084/jem.20070823. [DOI] [PMC free article] [PubMed] [Google Scholar]
- Schratt, G.M., Tuebing, F., Nigh, E.A., Kane, C.G., Sabatini, M.E., Kiebler, M., Greenberg, M.E. A brain-specific microRNA regulates dendritic spine development. Nature. 2006;439:283–289. doi: 10.1038/nature04367. [DOI] [PubMed] [Google Scholar]
- Sempere, L.F., Freemantle, S., Pitha-Rowe, I., Moss, E., Dmitrovsky, E., Ambros, V. Expression profiling of mammalian microRNAs uncovers a subset of brain-expressed microRNAs with possible roles in murine and human neuronal differentiation. Genome Biol. 2004;5:R13. doi: 10.1186/gb-2004-5-3-r13. http://genomebiology.com/2004/5/3/R13. [DOI] [PMC free article] [PubMed]
- Shingara, J., Keiger, K., Shelton, J., Laosinchai-Wolf, W., Powers, P., Conrad, R., Brown, D., Labourier, E. An optimized isolation and labeling platform for accurate microRNA expression profiling. RNA. 2005;11:1461–1470. doi: 10.1261/rna.2610405. [DOI] [PMC free article] [PubMed] [Google Scholar]
- Silahtaroglu, A.N., Nolting, D., Dyrskjot, L., Berezikov, E., Moller, M., Tommerup, N., Kauppinen, S. Detection of microRNAs in frozen tissue sections by fluorescence in situ hybridization using locked nucleic acid probes and tyramide signal amplification. Nat. Protoc. 2007;2:2520–2528. doi: 10.1038/nprot.2007.313. [DOI] [PubMed] [Google Scholar]
- Smirnova, L., Grafe, A., Seiler, A., Schumacher, S., Nitsch, R., Wulczyn, F.G. Regulation of miRNA expression during neural cell specification. Eur. J. Neurosci. 2005;21:1469–1477. doi: 10.1111/j.1460-9568.2005.03978.x. [DOI] [PubMed] [Google Scholar]
- Sood, P., Krek, A., Zavolan, M., Macino, G., Rajewsky, N. Cell-type-specific signatures of microRNAs on target mRNA expression. Proc. Natl. Acad. Sci. 2006;103:2746–2751. doi: 10.1073/pnas.0511045103. [DOI] [PMC free article] [PubMed] [Google Scholar]
- Su, A.I., Wiltshire, T., Batalov, S., Lapp, H., Ching, K.A., Block, D., Zhang, J., Soden, R., Hayakawa, M., Kreiman, G., et al. A gene atlas of the mouse and human protein-encoding transcriptomes. Proc. Natl. Acad. Sci. 2004;101:6062–6067. doi: 10.1073/pnas.0400782101. [DOI] [PMC free article] [PubMed] [Google Scholar]
- Thomson, J.M., Parker, J., Perou, C.M., Hammond, S.M. A custom microarray platform for analysis of microRNA gene expression. Nat. Methods. 2004;1:47–53. doi: 10.1038/nmeth704. [DOI] [PubMed] [Google Scholar]
- Tusher, V.G., Tibshirani, R., Chu, G. Significance analysis of microarrays applied to the ionizing radiation response. Proc. Natl. Acad. Sci. 2001;98:5116–5121. doi: 10.1073/pnas.091062498. [DOI] [PMC free article] [PubMed] [Google Scholar]
- Visvanathan, J., Lee, S., Lee, B., Lee, J.W., Lee, S.K. The microRNA miR-124 antagonizes the anti-neural REST/SCP1 pathway during embryonic CNS development. Genes & Dev. 2007;21:744–749. doi: 10.1101/gad.1519107. [DOI] [PMC free article] [PubMed] [Google Scholar]
- Vo, N., Klein, M.E., Varlamova, O., Keller, D.M., Yamamoto, T., Goodman, R.H., Impey, S. A cAMP-response element binding protein-induced microRNA regulates neuronal morphogenesis. Proc. Natl. Acad. Sci. 2005;102:16426–16431. doi: 10.1073/pnas.0508448102. [DOI] [PMC free article] [PubMed] [Google Scholar]
- Wienholds, E., Plasterk, R.H. microRNA function in animal development. FEBS Lett. 2005;579:5911–5922. doi: 10.1016/j.febslet.2005.07.070. [DOI] [PubMed] [Google Scholar]
- Wienholds, E., Kloosterman, W.P., Miska, E., Alvarez-Saavedra, E., Berezikov, E., de Bruijn, E., Horvitz, H.R., Kauppinen, S., Plasterk, R.H. microRNA expression in zebrafish embryonic development. Science. 2005;309:310–311. doi: 10.1126/science.1114519. [DOI] [PubMed] [Google Scholar]
- Zeng, Y. Principles of micro-RNA production and maturation. Oncogene. 2006;25:6156–6162. doi: 10.1038/sj.onc.1209908. [DOI] [PubMed] [Google Scholar]
