αE-catenin controls cerebral cortical size by regulating hedgehog signalling pathway (original) (raw)
. Author manuscript; available in PMC: 2008 Sep 29.
Published in final edited form as: Science. 2006 Mar 17;311(5767):1609–1612. doi: 10.1126/science.1121449
Abstract
During development cells monitor and adjust their rates of accumulation to produce predetermined-size organs; however, responsible for this mechanisms remain unknown. We show here that central nervous system-specific deletion of the essential adherens junction gene, αE-catenin, causes abnormal activation of the hedgehog pathway resulting in shortening of the cell cycle, decreased apoptosis and subsequent massive cortical hyperplasia. We propose that αE-catenin connects cell-density-dependent adherens junctions with the developmental hedgehog pathway and this connection may provide a negative feedback loop controlling the size of developing cerebral cortex.
Keywords: mammalian brain development, hedgehog pathway, neural progenitor cells
During brain development, proliferation of neural progenitor cells is tightly controlled to produce the organ of predetermined size. We hypothesized that cell-cell adhesion structures may be involved in this function because they can provide cells with information concerning the density of their cellular neighborhood. Intercellular adhesion in neural progenitors is mediated primarily by adherens junctions, which contain cadherins, β- and α-catenins (1). We found that progenitors express αE(epithelial)-catenin, while differentiated neurons express αN(neural)-catenin (Fig. S1A–D). Since α-catenin is critical for the formation of adherens junctions (2, 3), we decided to determine the role of these adhesion structures in neural progenitor cells by generating mice with CNS-specific deletion of αE-catenin. Mice with a conditional αE-catenin allele (αE-cateninloxP/loxP) (4) were crossed with mice carrying nestin-promoter-driven Cre recombinase (Nestin-Cre+/−), which is expressed in CNS stem/neural progenitors starting at embryonic day E10.5 (5) (Fig. S1E). The resulting αE-cateninloxP/loxP/Nestin-Cre+/− animals displayed loss of αE-catenin in neural progenitor cells and its presence in the blood vessels not targeted by Nestin-Cre (Figs. 2D–F, S1F).
Fig. 2.

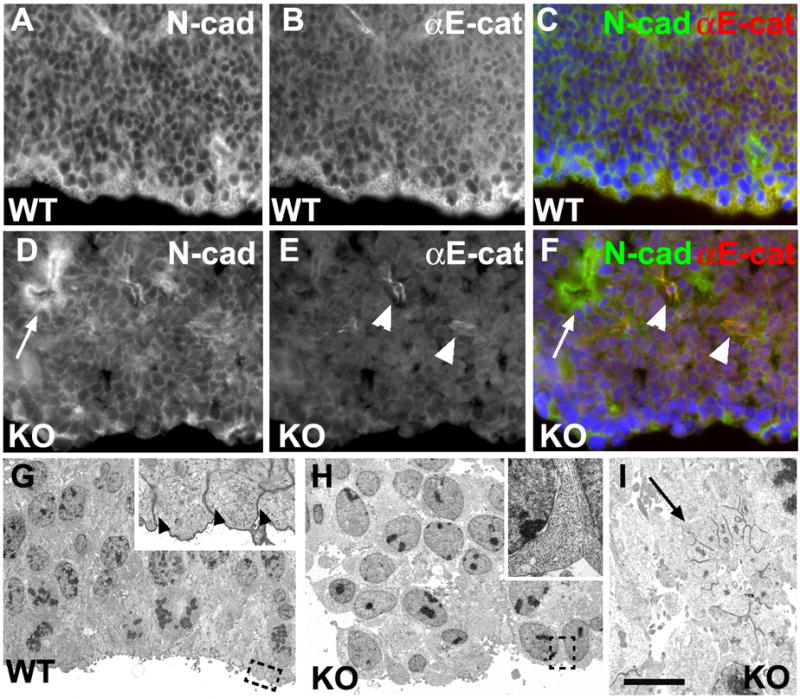
Loss of cell polarity and disruption of apical-junctional complex in αE-catenin_−/_−neural progenitor cells. (A–F) Disruption of apical adherens junctions in αE-catenin_−/_− neural progenitors. Staining with anti-N-cadherin (A, D; green in C, F) and anti-αE-catenin (B, E; red in C, F) antibodies. (G–I) Electron microscopy analysis of cortical neural progenitor cells of E12.5 wildtype (G) and αE-catenin_−/_− (H, I) embryos. Areas in dashed squares in G, H are magnified in insets. Arrowheads in inset to G denote missing in mutants apical-junctional complexes. Arrows indicate internalization of polarized neuroepithelium and formation of rosette-like structures maintaining apical-junctional complexes. Arrowheads in E, F denote blood vessels not targeted by Nestin-Cre. Bar in I corresponds to 30 km in A–F; 10 km in G–H, 4 km in I and 1.8 km in insets to G–H.
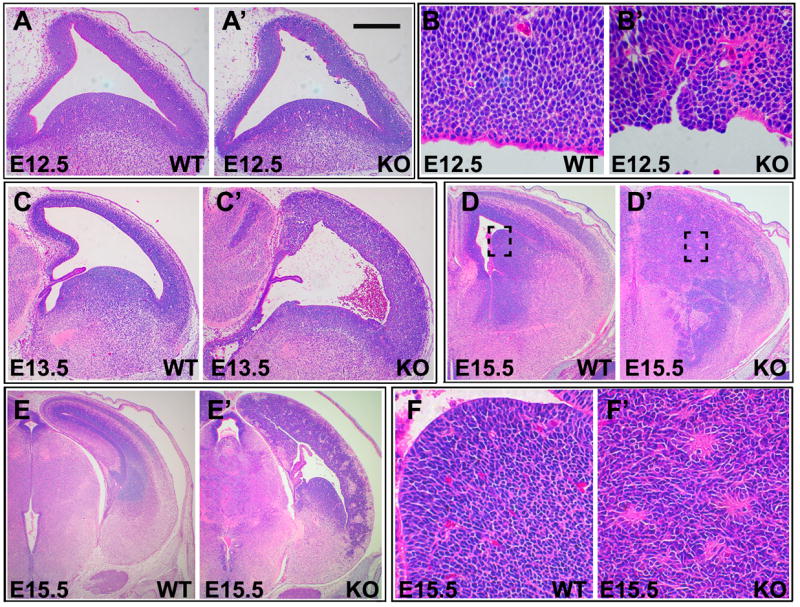
While no phenotype was observed in heterozygous αE-cateninloxP/+/Nestin-Cre+/−mice, the knockout αE-cateninloxP/loxP/Nestin-Cre+/− mice were born with bodies similar to their littermates, but with enlarged heads (Fig. S2A). After birth, the heads of these animals continued to grow, but their bodies were developmentally-retarded generating abnormal large-headed pups that failed to thrive and died between 2–3 weeks of age (Fig. S2B). Counting brain cell numbers at different points of embryonic development revealed massive hyperplasia in the mutant brains, with a 2-fold increase in total brain cell numbers by the time of birth (Fig. S2C). While no differences were found at E12.5, mutant brains displayed a 40% increase in total cell numbers only one day later at E13.5. In addition to an increase in brain cell numbers, the mutant animals displayed increases in brain weights and brain-to-bodyweight ratios (Fig. S2D, E). Histologic analysis of αE-cateninloxP/loxP/Nestin-Cre+/− animals revealed severe dysplasia and hyperplasia in the mutant brains (Fig. 1). _αE-catenin_−/−ventricular zone cells were dispersed throughout the developing brains, forming invasive tumor-like masses displaying widespread pseudopalisading and the formation of rosettes (Fig. 1F′), similar to Homer-Wright rosettes in human medulloblastoma, neuroblastoma, retinoblastoma, pineoblastoma, neurocytoma and pineocytoma tumors (6–8). While E12.5 _αE-catenin_−/− cortexes already showed some disorganization (Fig. 1B′), the general brain appearance was similar between the wildtype and _αE-catenin_−/− embryos (Fig. 1A–A′). In contrast, the E13.5 mutants exhibited a prominent increase in the thickness and size of the cerebral cortex (Fig. 1C–C′). Massive expansion of dysplastic cortical progenitor cells continued later in development, causing a posterior and ventral shift in localization of the lateral ventricle (Figs. 1D–E′, S3).
Fig. 1.

Severe dysplasia and hyperplasia in αE-catenin_−/_− brain. Histologic appearance of brains from wildtype (WT) and _αE-cateninLoxP/LoxP/Nestin-Cre+/_− (KO) mice. Sagittal sections through developing telencephalon from the wildtype (A, C) and αE-catenin_−/_− (A′, C′) brains of E12.5 (A, A′) and E13.5 (C, C′) embryos. Ventricular zone of the cerebral cortex from the E12.5 wildtype (B) and αE-catenin_−/_− (B′) brains. Coronal sections from the E15.5 wildtype (D, E, F) and αE-catenin_−/_− (D′, E′, F′) brains. Areas in dashed squares in D, D′ are shown at higher magnification in F, F′. Bar in A′ represents 0.27 mm in A, A′; 0.36 mm in C–C′; 0.42 mm in D, D′; 0.54 mm in E–E′; 50 km in F, F′, 40 km in B, B′.
We next analyzed the mechanisms responsible for dysplasia in _αE-catenin_−/− brains. Ventricular zone progenitors are bipolar, with one extension reaching the ventricular surface and another process reaching in the opposite direction (Fig. S4A). These cells form a prominent cell-cell adhesion structure at the ventricular interface, called an apical-junctional complex. Staining with cell adhesion and cell polarity markers showed disruption of apical-junctional complexes and loss of cell polarity in _αE-catenin_−/− neural progenitor cells (Figs. 2, S4). Electron microscopic analyses of _αE-catenin_−/− brains revealed nonpolarized, round and loosely connected to each other progenitors lacking apical-junctional complexes (Fig. 2G–H). Perhaps due to residual amounts of αN-catenin present in the progenitor cells, small fragments of _αE-catenin_−/− neuroepithelium were still capable of maintaining cell polarity, but they were often engulfed by protruding nonpolarized cells, folded back on themselves and internalized to form rosettes (Figs. 2D–F, I, S4B, D). We concluded that loss of apical-junctional complexes and subsequent loss of cell polarity may represent the mechanism responsible for dysplasia in _αE-catenin_−/− brains.
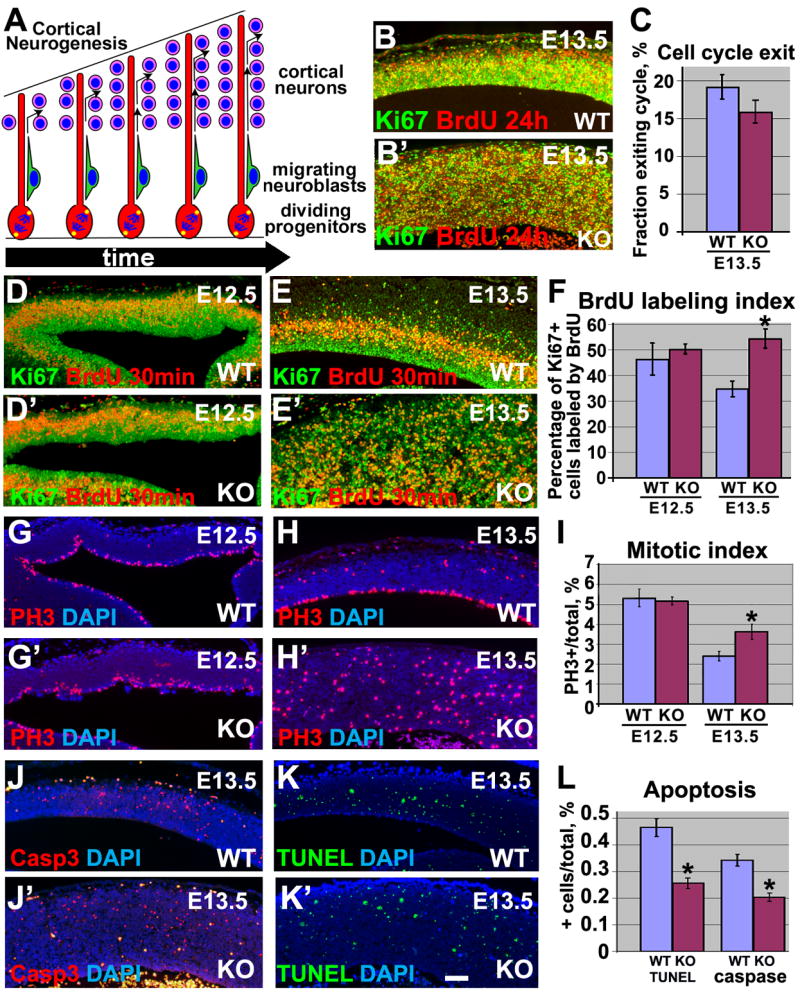
We next analyzed the mechanisms responsible for hyperplasia in _αE-catenin_−/− brains. Failure of cell cycle withdrawal is responsible for hyperplasia in brains with hyperactive β-catenin pathway (9). To analyze cell cycle withdrawal in _αE-catenin_−/− brains, we counted the proportion of cells that had exited the cell cycle after 24h labeling with BrdU (Fig. 3B, B′). We concentrated on E13.5 mutants, since we observed the most rapid increase in total brain cell numbers during the E12.5–E13.5 interval of development. We found no significant differences in cell cycle withdrawal between the wildtype and mutant cells (Fig. 3C). To determine if differentiation was affected in _αE-catenin_−/− brains, we used anti-β-tubulin III and anti-nestin antibodies, neuronal and progenitor cell markers, respectively (Fig. S5A–B′). While there were no differences in appearance of E12.5 wildtype and mutant cortexes (Fig. S5A, A′), E13.5 _αE-catenin_−/− cortexes were disorganized and thickened with neurons present not only in the cortical plate, but also elsewhere throughout the cortex (Fig. S5B, B′). Nevertheless, the overall ratio between differentiated and nondifferentiated cells remained unchanged (Fig. S5C). Moreover, western blot analyses of total brain proteins with cell-type-specific antibodies did not reveal consistent differences between the wildtype and _αE-catenin_−/− brains (Fig. S5D). In addition, we found no differences between the wildtype and _αE-catenin_−/− brains in the position and numbers of located at the surface of cerebral cortex Cajal-Retzius neurons (Fig. S6). We concluded that despite the loss of progenitor cell polarity, the general program governing differentiation is not affected in _αE-catenin_−/− brains.
Fig. 3.

Shortening of cell cycle and decreased apoptosis in αE-catenin_−/_− cerebral cortexes. (A) Model of cortical neurogenesis. (B, B′**)** Minor changes in cell cycle withdrawal in αE-catenin_−/_− cortexes. Pregnant females were injected with BrdU 24h before being sacrificed. Cells re-entering cell cycle are BrdU+/Ki67+, while cells withdrawn from cell cycle are BrdU+/Ki67−. (C) Quantitation of experiments shown in B-B′. Cell cycle exit is determined as a ratio of cells exited cell cycle (BrdU+/Ki67−) to all cells incorporated BrdU. n=3. (D–E′**)** Decrease in cell cycle length in αE-catenin_−/_− progenitors. Higher percentage of αE-catenin_−/_−progenitor cells (Ki67+) are labeled with BrdU after 30 min pulse. (F) Quantitation of experiments shown in D–E′. BrdU labeling index is a percentage of Ki67+ cells incorporated BrdU. n=3. *P<0.001. (G–H′**)** Immunostaining of cortical sections from wildtype and αE-catenin_−/_− brains with anti-phospho-histone 3 (red) antibodies reveals increase in mitotic cells in E13.5 mutants. DNA was counterstained by DAPI (blue). (I) Quantitation of the experiments shown in G–H′. Mitotic index is a ratio of mitotic cells to the total brain cell number. n=3. *P<0.001. (J–K′**)** Decrease in apoptosis in αE-catenin_−/_− cortexes. Apoptotic cells in the wildtype (J–K) and mutant (J′–K′) brains were detected by staining with anti-cleaved caspase 3 (Casp3) and TUNEL stainings. (L) Quantitation of experiments shown in J–K′. Ratios of Casp3+ or TUNEL+ cells per total cell numbers are shown. n=3. *P<0.001. Bar in frame K′ represents 100 km for B–B′, D–K′.
To analyze whether loss of αE-catenin led to changes in proliferation, we studied neural progenitor cell cycle length and number of cells in mitosis. To measure cell cycle length, we counted the proportion of neural progenitor cells labeled by a pulse of BrdU (9)(Fig. 3D–E′). We found significant shortening of the cell cycle in E13.5 _αE-catenin_−/− progenitor cells (Fig. 3F). In addition, E13.5 mutant brains displayed a 40% increase in the number of mitotic cells (Fig. 3G–I).
Apoptosis is also critical for regulation of total cell numbers in the developing brain (10). Counting of apoptotic cells revealed a 2-fold decrease in apoptosis in the _αE-catenin_−/−cortexes (Fig. 3J–L). We concluded that hyperplasia in the _αE-catenin_−/− brains was a combined outcome of the shortening of the cell cycle and decreased apoptosis in neural progenitor cells.
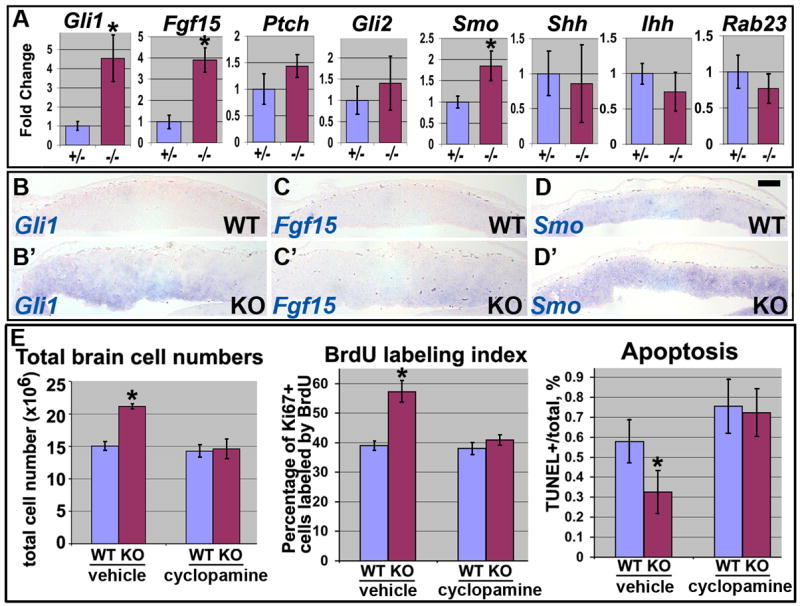
To determine the molecular mechanisms responsible for hyperplasia in _αE-catenin_−/−brains we utilized microarray approach. Surprisingly, a genome-wide analysis revealed only few changes in gene expression (Table 1), with only five transcripts upregulated and three downregulated in _αE-catenin_−/− brains. Interestingly, the two most upregulated cDNAs, Fgf15 and Gli1, represent well known endogenous transcriptional targets of the Hh pathway (11, 12). We performed quantitative reverse transcriptase PCR analysis of critical members and targets of the hedgehog pathway: smoothened (Smo), patched1 (Ptch), sonic hedgehog (Shh), indian hedgehog (Ihh), desert hedgehog (Dhh), Rab23, Gli1, Gli2, Gli3 and Fgf15. We found that the expression of Gli1, Fgf15 and Smo was significantly upregulated in _αE-catenin_−/−brains (Fig. 4A). To determine the compartment of the developing brain displaying upregulation of hedgehog signaling, we performed in situ hybridizations with Gli1, Fgf15 and Smo probes (Fig. 4B–D′). We found that Gli1 and Fgf15 transcripts are upregulated in the progenitor cell domain of _αE-catenin_−/− cerebral cortex, the area most severely affected by hyperplasia in _αE-catenin_−/− brains (Fig. 1C′).
Table 1. Differentially expressed genes in E12.5 αE-catenin−/− brains.
RNAs from α_E-cateninLoxP/+/Nestin-Cre+/_− and _αE-cateninLoxP/LoxP/Nestin-Cre+/_− brains were analyzed by Affymetrix expression arrays. Relative fold change is calculated with respect to heterozygous brains. Bayes.p is the p-value obtained using the CyberT Bayesian statistical framework.
| Name | Symbol | UGCluster | Relative fold change | Bayes.p |
|---|---|---|---|---|
| Upregulated | ||||
| fibroblast growth factor 15 | Fgf15 | Mm.3904 | 2.39 | 1.31E-06 |
| GLI-Kruppel family member GLI | Gli1 | Mm.336839 | 2.37 | 3.34E-06 |
| RIKEN cDNA A830059I20 gene | A830059I20Rik | Mm.113787 | 1.98 | 5.86E-07 |
| expressed sequence AU040576 | AU040576 | Mm.26700 | 1.93 | 2.27E-05 |
| high mobility group AT-hook 1 | Hmga1 | Mm.4438 | 1.59 | 1.60E-05 |
| Downregulated | ||||
| p53 binding protein 1 | Trp53bp1 | Mm.215389 | −3.91 | 6.70E-06 |
| RIKEN cDNA 2900097C17 gene | 2900097C17Rik | Mm.349235 | −2.63 | 5.41E-06 |
| RIKEN cDNA A730017C20 gene | A730017C20Rik | Mm.209711 | −1.92 | 2.55E-07 |
Fig. 4.

Activation of Hh pathway is responsible for shortening of cell cycle, decreased apoptosis and subsequent hyperplasia in αE-catenin_−/_− cerebral cortexes. (A) qPCR analysis of Hh pathway transcripts in E12.5 heterozygous and mutant brains. The levels of expression are shown in arbitrary units with mean heterozygous levels adjusted to one. Data represent means ± SD. N≥4. *P<0.002. (B–D′**)** Cortical sections from E12.5 wildtype and αE-catenin−/−embryos were analyzed by in situ hybridization with Gli1, Fgf15 and Smo probes. Bar in frame D represents 200km. (E) Inhibition of Hh pathway by cyclopamine eliminates thedifferences in total cell numbers, cell cycle length and apoptosis between the wildtype and αE-catenin_−/_− brains. Pregnant females were injected with 10mg/kg of cyclopamine in 2-hydropropyl-β-cyclodextrin (vehicle) or vehicle alone at E12.5 and embryos were analyzed 30h later. Quantitation was performed as described in Figs. 3, S2. Data represent means ± SD. N≥3. *P<0.001.
Upregulation of endogenous targets of the Hh signaling pathway suggests activation of this pathway in developing cortexes of the αE-cateninloxP/loxP/Nestin-Cre+/− mice. While the exact mechanism responsible for αE-catenin-mediated regulation of Gli1 and Fgf15 is presently unknown, an increase in expression of the activator of the Hh signaling Smo is likely to play a causal role in abnormal activation of the Hh pathway in _αE-catenin_−/− brains. Indeed, Smo upregulation is responsible for activation of Hh signaling in cancer cell lines, and it may be a focal point of regulation of the pathway in tissue regeneration and cancer (13).
The Hh pathway plays a critical role in mammalian CNS development and brain cancer (14). Sonic hedgehog stimulates proliferation of progenitor cells in the developing cerebral cortex (15, 16). In addition, Hh signaling promotes survival and blocks apoptosis of neuroepithelial cells (17). Therefore, abnormal activation of the Hh pathway may be responsible for cortical hyperplasia in _αE-catenin_−/− brains. To determine whether this is indeed the case, we used cyclopamine, a specific inhibitor of Smoothened (18), which can block the Hh pathway in vivo (19). We found that a single injection of cyclopamine at E12.5 (immediately before the onset of hyperplasia) did not interfere with depletion of αE-catenin (Fig. S7), but eliminated the differences in total cell numbers between the E13.75 wildtype and _αE-catenin_−/− brains (Fig. 4E). Injections of decreasing amounts of cyclopamine produced intermediate phenotypes demonstrating dose-dependence between the inhibitor and hyperplasia (Fig. S8). As expected, inhibition of Hh did not rescue cortical disorganization, which results from the disruption of adherens junctions in _αE-catenin_−/− brains (Fig. S9). Analyses of the cell cycle length and apoptosis showed rescue of the cell cycle and apoptosis abnormalities in cyclopamine-treated _αE-catenin_−/− brains (Figs. 4E, S9C-H′). As expected, cyclopamine injection led to a significant decrease in expression of the Hh pathway transcriptional targets Gli1 and Fgf15 (Fig. S10). We concluded that abnormal activation of the Hh pathway was responsible for shortening of the cell cycle, decreased apoptosis and subsequent hyperplasia in _αE-catenin_−/− cerebral cortexes.
Our findings allow us to propose a model of a negative feedback loop regulating the rates of cell proliferation to control the size of the cerebral cortex (Fig. S11). In this “crowd control” model, the increase in cell density, which is sensed by an increase in the per cell area occupied by adherens junctions (Fig. S11A), is translated into downregulation of Hh signaling and subsequent decrease in cell proliferation (Fig. S11B). The abnormal decrease in cell density, which is measured by destabilization and paucity of adherens junctions, is translated into activation of Hh pathway and subsequent acceleration of cell proliferation, until the normal cell density is achieved. Therefore, the density of cellular crowd ultimately regulates the rates of cell accumulation during normal development. Solid tumors may escape “crowd control” of cell proliferation by destabilizing the adherens junctions, one of the frequent events reported in human cancers (20).
Supplementary Material
SFig. 1
SFig. 10
SFig. 11
SFig. 2
SFig. 3
SFig. 4
SFig. 5
SFig. 6
SFig. 7_8
SFig. 9
Suppl Text
Acknowledgments
We thank Drs. Philippe Soriano, Susan Parkhurst, Stephen Tapscott, Daniel Gottschling and Bruce Edgar and all members of Dr. Vasioukhin’s laboratory for advice and encouragement, Drs. Nagafuchi, Tsukita and Developmental Studies Hybridoma Bank for generous gift of antibodies. Linda Cherepoff, Franque Remington, Manda Null and Brad Helbing for help with histology, electron microscopy, genotyping and manuscript preparation, respectively. This work was supported by the NCI grant R01 CA098161.
References
- 1.Chenn A, Zhang YA, Chang BT, McConnell SK. Mol Cell Neurosci. 1998 Jul;11:183. doi: 10.1006/mcne.1998.0680. [DOI] [PubMed] [Google Scholar]
- 2.Hirano S, Kimoto N, Shimoyama Y, Hirohashi S, Takeichi M. Cell. 1992 Jul 24;70:293. doi: 10.1016/0092-8674(92)90103-j. [DOI] [PubMed] [Google Scholar]
- 3.Vasioukhin V, Bauer C, Yin M, Fuchs E. Cell. 2000 Jan 21;100:209. doi: 10.1016/s0092-8674(00)81559-7. [DOI] [PubMed] [Google Scholar]
- 4.Vasioukhin V, Bauer C, Degenstein L, Wise B, Fuchs E. Cell. 2001 Feb 23;104:605. doi: 10.1016/s0092-8674(01)00246-x. [DOI] [PubMed] [Google Scholar]
- 5.Graus-Porta D, et al. Neuron. 2001 Aug 16;31:367. doi: 10.1016/s0896-6273(01)00374-9. [DOI] [PubMed] [Google Scholar]
- 6.Sangueza OP, Sangueza P, Valda LR, Meshul CK, Requena L. J Am Acad Dermatol. 1994 Aug;31:356. doi: 10.1016/s0190-9622(94)70172-5. [DOI] [PubMed] [Google Scholar]
- 7.Graham DI, Lantos PL. Greenfield’s Neuropathology. Arnold; New York, NY: 2002. [Google Scholar]
- 8.Burger PC, Scheithauer . Tumors of the central nervous system. Armed Forces Institute of Pathology; Washington, DC: 1994. Atlas of tumor pathology. [Google Scholar]
- 9.Chenn A, Walsh CA. Science. 2002 Jul 19;297:365. doi: 10.1126/science.1074192. [DOI] [PubMed] [Google Scholar]
- 10.Depaepe V, et al. Nature. 2005 Jun 30;435:1244. doi: 10.1038/nature03651. [DOI] [PubMed] [Google Scholar]
- 11.Ishibashi M, McMahon AP. Development. 2002 Oct;129:4807. doi: 10.1242/dev.129.20.4807. [DOI] [PubMed] [Google Scholar]
- 12.Saitsu H, et al. Dev Dyn. 2005 Feb;232:282. doi: 10.1002/dvdy.20236. [DOI] [PubMed] [Google Scholar]
- 13.Karhadkar SS, et al. Nature. 2004 Oct 7;431:707. [Google Scholar]
- 14.Ruiz IAA, Palma V, Dahmane N. Nat Rev Neurosci. 2002 Jan;3:24. doi: 10.1038/nrn704. [DOI] [PubMed] [Google Scholar]
- 15.Dahmane N, et al. Development. 2001 Dec;128:5201. doi: 10.1242/dev.128.24.5201. [DOI] [PubMed] [Google Scholar]
- 16.Palma V, Ruiz i Altaba A. Development. 2004 Jan;131:337. doi: 10.1242/dev.00930. [DOI] [PubMed] [Google Scholar]
- 17.Thibert C, et al. Science. 2003 Aug 8;301:843. doi: 10.1126/science.1085405. [DOI] [PubMed] [Google Scholar]
- 18.Chen JK, Taipale J, Cooper MK, Beachy PA. Genes Dev. 2002 Nov 1;16:2743. doi: 10.1101/gad.1025302. [DOI] [PMC free article] [PubMed] [Google Scholar]
- 19.Berman DM, et al. Science. 2002 Aug 30;297:1559. doi: 10.1126/science.1073733. [DOI] [PubMed] [Google Scholar]
- 20.Cavallaro U, Christofori G. Nat Rev Cancer. 2004 Feb;4:118. doi: 10.1038/nrc1276. [DOI] [PubMed] [Google Scholar]
Associated Data
This section collects any data citations, data availability statements, or supplementary materials included in this article.
Supplementary Materials
SFig. 1
SFig. 10
SFig. 11
SFig. 2
SFig. 3
SFig. 4
SFig. 5
SFig. 6
SFig. 7_8
SFig. 9
Suppl Text