Phosphorylation Networks Regulating JNK Activity in Diverse Genetic Backgrounds (original) (raw)
. Author manuscript; available in PMC: 2009 Apr 17.
Published in final edited form as: Science. 2008 Oct 17;322(5900):453–456. doi: 10.1126/science.1158739
Abstract
Cellular signaling networks have evolved to enable swift and accurate responses, even in the face of genetic or environmental perturbation. Thus, genetic screens may not identify all the genes that regulate different biological processes. Moreover, although classical screening approaches have succeeded in providing parts lists of the essential components of signaling networks, they typically do not provide much insight into the hierarchical and functional relations that exist among these components. We describe a high-throughput screen in which we used RNA interference to systematically inhibit two genes simultaneously in 17,724 combinations to identify regulators of Drosophila JUN NH2-terminal kinase (JNK). Using both genetic and phosphoproteomics data, we then implemented an integrative network algorithm to construct a JNK phosphorylation network, which provides structural and mechanistic insights into the systems architecture of JNK signaling.
Signaling networks, especially those maintaining cell viability and proliferation in response to environmental fluctuations and stress, may be more robust to perturbation than others (1). One signaling network dedicated to maintaining cell, tissue, and organism fidelity in the face of cellular stress involves stress-activated protein kinases (SAPKs), also known as JUN NH2-terminal kinases (JNKs) (2). Classical in vivo genetic approaches in Drosophila have identified a highly conserved pathway consisting of a single JNK, a JNK-kinase (JNKK), and a mixed-lineage kinase (MLK) that serves as a JNKK-kinase (3), but little is known as to how other signaling networks feed into this canonical cascade. To expand our understanding of JNK regulation, we conducted cell-based RNA interference (RNAi) screens to systematically investigate JNK activity in various genetic backgrounds. Furthermore, to gain insight into the systems architecture of JNK signaling, we used a probabilistic computational framework to reconstruct a JNK phosphorylation network among components identified in the screen on the basis of phosphoproteomics data.
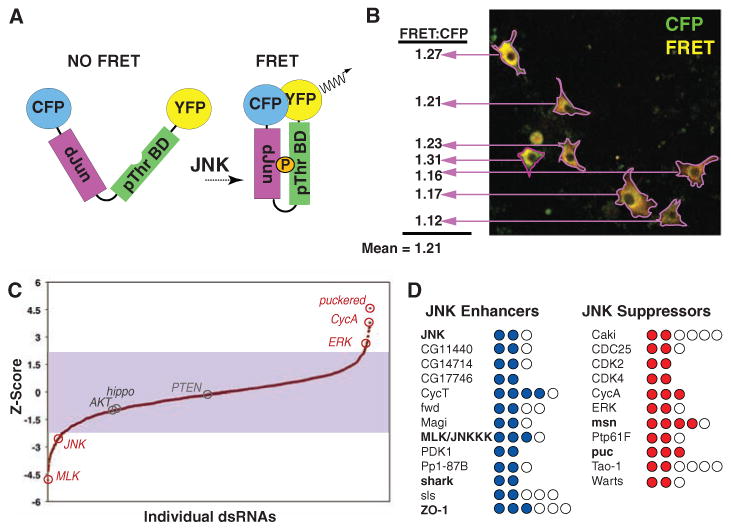
To measure JNK activity in live migratory Drosophila cells, we devised an RNAi screen based on a dJUN-FRET sensor (fluorescence resonance energy transfer or FRET). dJUN-FRET is a single polypeptide composed of a modified Drosophila JUN phosphorylation domain and a FHA phosphothreonine-binding module (4) separated by a flexible linker and flanked by a cyan fluorescent protein (CFP) donor and yellow fluorescent protein (YFP) acceptor modules (Fig. 1A). Drosophila BG-2 migratory cells were transfected with a plasmid that drives dJUN-FRET expression from an actin promoter and, 2 days later, were transfected with a set of 1565 double-stranded RNAs (dsRNAs) targeting all 251 known Drosophila kinases, 86 phosphatases (PPases), and predicted kinases and PPases, as well as regulatory subunits and adapters (the “KP” set). JNK activity in single cells was determined by calculating the ratio of FRET signal (generated by FRET between YFP and CFP) to the level of CFP intensity (which provides the baseline level of dJUN-FRET expression in each cell regardless of JNK activity) within each cell boundary. A mean ratio is then derived for all cells treated with a particular dsRNA (Fig. 1B). The mean fold change in dJUN-FRET reporter activity for 16,404 control wells was 1.00 ± 0.04 (SD); however, in a screen of the KP set, multiple dsRNAs targeting JNK (Z = −2.06 and −2.05) and MLK (Z = −5.06, −2.60, and −2.13) produced significant decreases in dJUN-FRET reporter activity (5). Moreover, dsRNAs targeting the JNK PPase puckered (puc) (6) resulted in significant increases in reporter activity (Z = 2.13, 3.44, and 4.81), consistent with the role of Puc as a negative regulator of JNK (Fig. 1C). In the KP screen, we identified 24 genes (5% of genes tested) as putative JNK regulators and reidentified the 6 out of 7 positive and negative JNK regulators previously identified in vivo (3) (Fig. 1D). Although the KP screen identified both previously known and novel JNK components and regulators, the results are notable in the genes that the screen failed to isolate. For example, the only Drosophila JNKK, encoded by the hemipterous gene (7), was not identified in the KP screen. Furthermore, although ERK emerged from the KP screen as a JNK suppressor because of ERK's potential positive effects on puc transcription (fig. S1), we did not identify dsRNAs targeting other components of the ERK pathway. A high false-negative rate appears to be present in this genetic screen; therefore, we developed a combinatorial strategy to further enhance the sensitivity of the screen.
Fig. 1.

Overview of FRET-based screen for JNK regulators. (A) Schematic of dJUN-FRET construct. (B) Representative image of dJUN-FRET transfected BG-2 cells and image analysis protocol. (C) Graph of Z scores for individual dsRNAs in KP screen. (D) List of 11 JNK suppressors and 13 enhancers identified in the KP screen. Genes are considered JNK regulators if two or more independent dsRNAs result in mean changes in dJUN-FRET activity above or below a Z score of +2.0 or −2.0, respectively. Circles represent the number of dsRNAs tested per gene; filled circles represent dsRNAs that contribute to the average Z score. Genes in bold indicate previously described JNK regulators (3).
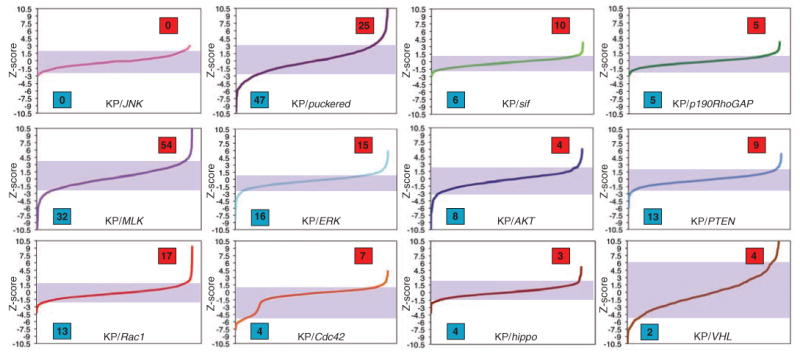
We performed 12 different sensitized screens in which we incubated cells with dsRNAs targeting a “query” gene in combination with dsRNAs of the KP set. In choosing query genes, we focused primarily on components of Rho guanosine triphosphatase (GTPase) signaling, such as Rac1, Cdc42, the Rho guanine nucleotide exchange factor still-life (sif), and p190RhoGAP (GTPase-activating protein), because Rho activity couples JNK activation to a number of upstream signaling events (3). We also sensitized cells by targeting canonical JNK components, such as JNK, puc, and MLK; other strong candidates from the KP screen, such as ERK; and genes, such as AKT, PTEN, hippo, and VHL, whose inhibition could result in the activation stress pathways even though they were themselves not identified in the KP screen (4). Genes were then identified as likely JNK regulators if two or more independent dsRNAs resulted in average increases or decreases in dJUN-FRET reporter activity in each screen, and we assigned a significance score based on how many total dsRNAs were tested for each gene across all screens (4, 26). For example, a gene targeted by two to four dsRNAs was considered a JNK regulator if isolated in two or more screens, but a gene targeted by five to seven dsRNAs must be isolated in three or more screens to be included in the list of high-confidence regulators. No genes were isolated in the background of JNK inhibition (Fig. 2), which showed that increases or decreases in dJUN-FRET reporter activity in both unmodified and modified backgrounds are JNK-dependent. Using this combinatorial approach, we identified 55 new JNK suppressors and enhancers in a test of 17,724 dsRNA combinations, which, together with results from the nonsensitized initial screen, provide a list of 79 likely JNK regulators (17% of the genes tested) (26). We validated some of the hits identified in multiple screens as bona fide JNK regulators by quantifying mRNA abundance of the JNK-specific transcriptional target MMP1 (8, 9) after dsRNA-mediated inhibition of candidate genes by quantitative real-time polymerase chain reaction (fig. S2).
Fig. 2.

Overview of the ability of dsRNAs to enhance or suppress dJUN-FRET reporter activity in diverse sensitized backgrounds. Genes are considered hits in individual screens if two or more independent dsRNAs result in a mean dJUN-FRET reporter activity that is considered in the top or bottom 5% of each screen. Shading indicates 0.05 to 0.95 percentile in each screen. Blue boxes indicate the number of JNK enhancers in each screen; red boxes indicate the number of JNK suppressors.
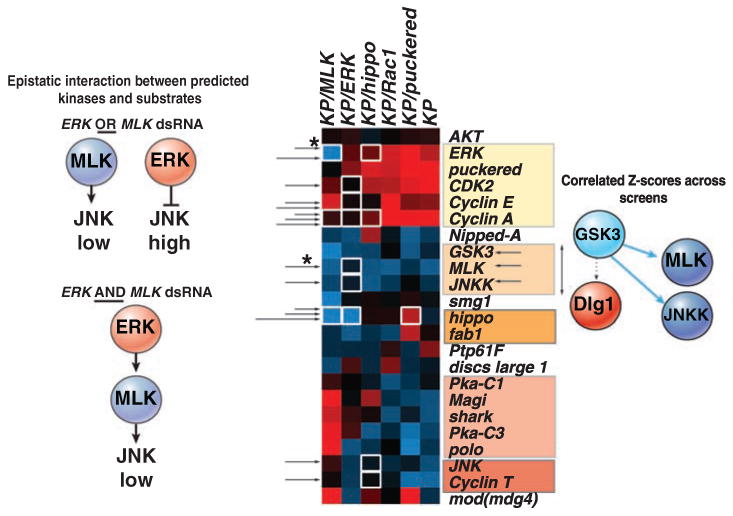
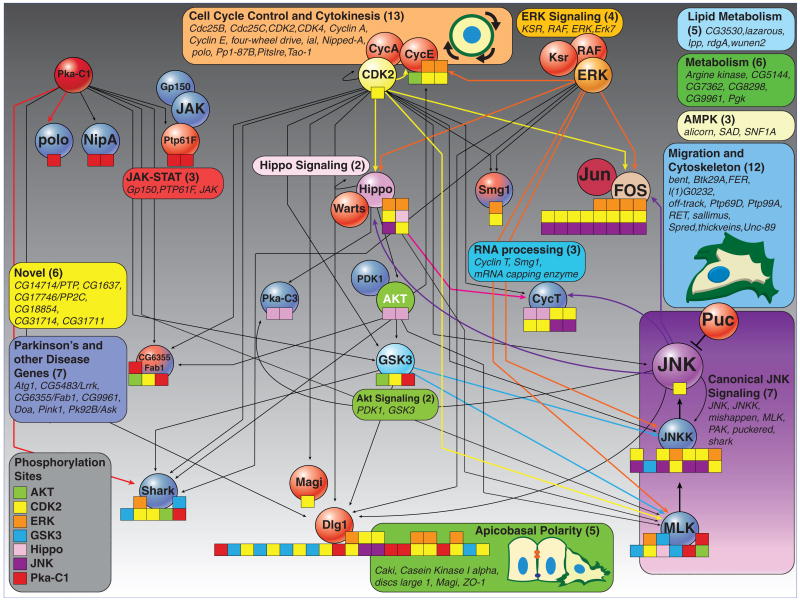
We wished to obtain insight into why depletion of certain kinases and PPases had effects in both unmodified and modified backgrounds, while others were isolated only in sensitized contexts. Therefore, we integrated our genetic screen with phosphoproteomics data and computational models of kinase specificity to derive networks on the basis of all of these experimental sources using the NetworKIN algorithm (10). NetworKIN was deployed on more than 10,000 unique high-confidence phosphorylation sites identified in a recent mass spectrometry study of Drosophila cells (11). This resulted in an initial network that was subsequently overlaid with the genetic hits in order to derive a model of the JNK phosphorylation network (Fig. 3) (25, 26). Last, to determine which phosphorylation events make functional contributions to JNK signaling, we looked in data sets derived from combinatorial screens for epistatic interactions among kinases and substrates and performed hierarchical clustering of mean Z scores for components of the JNK phosphorylation network across several combinatorial RNAi screens to look for shared patterns of genetic interaction (Fig. 4). Thus, through integrating genetic and phosphoproteomics data using a computational framework, we undertook a systems-level strategy to describe the protein networks underlying genetic interactions.
Fig. 3.
Information flow through the JNK network. Kinases with predicted substrates in the JNK signaling network are shown in various colors, and the corresponding phosphorylation sites are indicated with similarly colored boxes on the corresponding targets. Stacked boxes indicate instances where the same motif is predicted to be phosphorylated by multiple kinases. Colored lines indicate either that we have detected an epistatic interaction among kinases and substrates or that kinase and substrate have correlated scores across sensitized screens (Fig. 4). Curved arrows emanating from JNK represent instances for which we predict the existence of regulatory feedback in the JNK network. Additionally, we show components of the networks that we did not predict as either kinases or substrates, but that have well-characterized functional relations with particular components of the JNK phosphorylation network. For example, KSR (kinase suppressor of Ras), RAF (a family of serine-threonine protein kinases), and ERK are well-characterized components of the same pathway (26). Unless predicted as a kinase by NetworKIN, JNK regulators are colored according to whether they were identified as JNK enhancers (blue) or JNK suppressors (red) in this study. AKT, FOS, and JUN were not isolated in this screen. All other JNK regulators are listed in the colored boxes and were grouped according to GO annotation (www.flybase.org). AMPK, adenosine monophosphate (AMP)–activated protein kinase. Numbers in parentheses correspond to the number of JNK regulators identified in this study that make up each group.
Fig. 4.

Determining functional interactions among kinases and substrates in the JNK network. Hierarchical clustering of average dJUN-FRET Z scores after inhibition by RNAi of components in the JNK phosphorylation network in unmodified (KP), as well as in backgrounds deficient in ERK, hippo, MLK, or puc. Functional interactions are defined by the detection of an epistatic interaction between kinase and substrate (white boxes) or when the average Z scores of kinases and substrate dsRNAs across all sensitized screens cluster together with a cluster distance metric (an average of uncentered Pearson correlation coefficients) greater than 0.67 (shaded boxes). For example, whereas typically ERK acts as a JNK suppressor, ERK RNAi in _MLK_-deficient background (asterisk) leads to a notable decrease in dJUN-FRET reporter activity, which suggests that the ERK can act upstream of JNK via predicted phosphorylation of MLK and JNKK. Alternatively, GSK3 is predicted to target MLK, JNKK, and Dlg1, but only Z scores for GSK3, MLK, or JNKK dsRNAs cluster across screens, which suggests that GSK3-mediated phosphorylation of MLK and JNKK, but not Dlg1, is functionally relevant to JNK signaling.
JNK regulators identified in all screens could be broadly grouped into different classes on the basis of previously described biological functions and/or structural similarity of protein products (Fig. 3). Specifically, we identified a number of protein and lipid kinases involved in axon guidance and cell migration, such as FER (12), Ptp69d (13), otk (14, 15), thickveins (16), RET (17), wunen2 (18), GSK3 (19), PDK1 (20), and JAK (21). We also identified genes encoding components of apicobasal polarity complexes, such as ZO-1, Caki, Magi, and discs large 1 (dlg1), largely as JNK suppressors (22), which is consistent with in vivo studies demonstrating unrestrained JNK activation associated with breakdown of polarity in backgrounds of hyperactivated Ras/ERK signaling (8, 23). Furthermore, our results implicate the Warts-Hippo complex (24) as a potential link between JNK activity and the remodeling of cytoskeletal structures (Fig. 3). NetworKIN predicts that Hippo-mediated activation of JNK can occur through phosphorylation of MLK and that Hippo is also a direct target for JNK, which suggests that a feedback loop exists between JNK and Warts-Hippo signaling. Notably, we also predict Dlg1 to be extensively phosphorylated by a number of kinases in the JNK network, including JNK itself (Fig. 3). This suggests that JNK, and other kinases such as ERK and CDK2, can act upstream of Dlg1 to remodel or dismantle polarized cell-cell adhesion complexes, which, in turn, promote the morphological changes required to complete division, migration, or extrusion from tissue during apoptosis. Compelling support of this idea is provided by the fact that mammalian Dlg1 is regulated by phosphorylation, is a substrate of JNKs, and becomes highly phosphorylated during mitosis (25). These findings highlight the ability of integrated genetic and computational approaches to provide systems-level insight into the complex regulation of JNK activity.
In summary, we demonstrate that combinatorial RNAi screening is a powerful strategy to reduce the false-negatives present in current screens and reveals functions for a large fraction of genes. Moreover, our data-integrative–powered approach unraveled both mechanistic and hierarchical associations of components in the JNK regulatory system and provides an invaluable starting point for understanding the genetic interactions and signaling networks that underpin various diseases.
Supplementary Material
Acknowledgments
This work is supported by Genome Canada through the Ontario Genomics Institute, the Spanish Ministerio de Ciencía e Innovación (BFU/Consolider 2007), and the European Union (FP6). C.B. is a Fellow of the Leukemia and Lymphoma Society. N.P. is an Investigator of the Howard Hughes Medical Institute.
References and Notes
- 1.Felix MA, Wagner A. Heredity. 2008;100:132. doi: 10.1038/sj.hdy.6800915. [DOI] [PubMed] [Google Scholar]
- 2.Weston CR, Davis RJ. Curr Opin Cell Biol. 2007;19:142. doi: 10.1016/j.ceb.2007.02.001. [DOI] [PubMed] [Google Scholar]
- 3.Xia Y, Karin M. Trends Cell Biol. 2004;14:94. doi: 10.1016/j.tcb.2003.12.005. [DOI] [PubMed] [Google Scholar]
- 4.Materials and methods are available as supporting material on Science Online.
- 5.Supplemental tables and files are available at http://genepath.med.harvard.edu/∼cbakal/Supplemental.
- 6.Martin-Blanco E, et al. Genes Dev. 1998;12:557. doi: 10.1101/gad.12.4.557. [DOI] [PMC free article] [PubMed] [Google Scholar]
- 7.Glise B, Bourbon H, Noselli S. Cell. 1995;83:451. doi: 10.1016/0092-8674(95)90123-x. [DOI] [PubMed] [Google Scholar]
- 8.Uhlirova M, Bohmann D. EMBO J. 2006;25:5294. doi: 10.1038/sj.emboj.7601401. [DOI] [PMC free article] [PubMed] [Google Scholar]
- 9.Srivastava A, Pastor-Pareja JC, Igaki T, Pagliarini R, Xu T. Proc Natl Acad Sci USA. 2007;104:2721. doi: 10.1073/pnas.0611666104. [DOI] [PMC free article] [PubMed] [Google Scholar]
- 10.Linding R, et al. Cell. 2007;129:1415. doi: 10.1016/j.cell.2007.05.052. [DOI] [PMC free article] [PubMed] [Google Scholar]
- 11.Bodenmiller B, et al. Mol Biosyst. 2007;3:275. doi: 10.1039/b617545g. [DOI] [PubMed] [Google Scholar]
- 12.Murray MJ, Davidson CM, Hayward NM, Brand AH. Development. 2006;133:3063. doi: 10.1242/dev.02467. [DOI] [PubMed] [Google Scholar]
- 13.Desai CJ, Gindhart JG, Jr, Goldstein LS, Zinn K. Cell. 1996;84:599. doi: 10.1016/s0092-8674(00)81035-1. [DOI] [PubMed] [Google Scholar]
- 14.Winberg ML, et al. Neuron. 2001;32:53. doi: 10.1016/s0896-6273(01)00446-9. [DOI] [PubMed] [Google Scholar]
- 15.Lu X, et al. Nature. 2004;430:93. doi: 10.1038/nature02677. [DOI] [PubMed] [Google Scholar]
- 16.Affolter M, Nellen D, Nussbaumer U, Basler K. Development. 1994;120:3105. doi: 10.1242/dev.120.11.3105. [DOI] [PubMed] [Google Scholar]
- 17.Chiariello M, et al. Oncogene. 1998;16:2435. doi: 10.1038/sj.onc.1201778. [DOI] [PubMed] [Google Scholar]
- 18.Starz-Gaiano M, Cho NK, Forbes A, Lehmann R. Development. 2001;128:983. doi: 10.1242/dev.128.6.983. [DOI] [PubMed] [Google Scholar]
- 19.Etienne-Manneville S, Hall A. Nature. 2003;421:753. doi: 10.1038/nature01423. [DOI] [PubMed] [Google Scholar]
- 20.Primo L, et al. J Cell Biol. 2007;176:1035. doi: 10.1083/jcb.200607053. [DOI] [PMC free article] [PubMed] [Google Scholar]
- 21.Hou SX, Zheng Z, Chen X, Perrimon N. Dev Cell. 2002;3:765. doi: 10.1016/s1534-5807(02)00376-3. [DOI] [PubMed] [Google Scholar]
- 22.Funke L, Dakoji S, Bredt DS. Annu Rev Biochem. 2005;74:219. doi: 10.1146/annurev.biochem.74.082803.133339. [DOI] [PubMed] [Google Scholar]
- 23.Igaki T, Pagliarini RA, Xu T. Curr Biol. 2006;16:1139. doi: 10.1016/j.cub.2006.04.042. [DOI] [PubMed] [Google Scholar]
- 24.Saucedo LJ, Edgar BA. Nat Rev Mol Cell Biol. 2007;8:613. doi: 10.1038/nrm2221. [DOI] [PubMed] [Google Scholar]
- 25.Massimi P, Gardiol D, Roberts S, Banks L. Exp Cell Res. 2003;290:265. doi: 10.1016/s0014-4827(03)00317-3. [DOI] [PubMed] [Google Scholar]
- 26.Friedman A, Perrimon N. Nature. 2006;444:230. doi: 10.1038/nature05280. [DOI] [PubMed] [Google Scholar]
- 27.We are deeply indebted to the Drosophila RNAi Screening Center and to J. Aach, S. Lee, C. Jørgensen, B. Mathey-Prevot, and B. Bodenmiller. The NetworKIN and NetPhorest algorithms are available at http://networkin.info and http://NetPhorest.info, respectively.
Associated Data
This section collects any data citations, data availability statements, or supplementary materials included in this article.
