Functional atlas of the integrin adhesome (original) (raw)
. Author manuscript; available in PMC: 2009 Aug 31.
Published in final edited form as: Nat Cell Biol. 2007 Aug;9(8):858–867. doi: 10.1038/ncb0807-858
Abstract
A detailed depiction of the ‘integrin adhesome’, consisting of a complex network of 156 components linked together and modified by 690 interactions is presented. Different views of the network reveal several functional ‘subnets’ that are involved in switching on or off many of the molecular interactions within the network, consequently affecting cell adhesion, migration and cytoskeletal organization. Examination of the adhesome network motifs reveals a relatively small number of key motifs, dominated by three-component complexes in which a scaffolding molecule recruits both a signalling molecule and its downstream target. We discuss the role of the different network modules in regulating the structural and signalling functions of cell–matrix adhesions.
Top-down and bottom-up approaches for studying the integrin adhesome
Cell–extracellular matrix (ECM) interactions are mediated through specialized subcellular sites that contain specific adhesion receptors, cytoskeletal elements and a wide variety of inter-connecting adaptor proteins1–3. These adhesion complexes permit cells to sense multiple extracellular signals that specify the chemical identity, geometry and physical properties of the ECM4,5. Thus, cells behave differently on two- and three-dimensional matrices6, distinguish between different ECM components7, can detect differences in adhesive ligand density8, and respond to mechanical perturbation and surface rigidity9,10.
To understand the mechanisms underlying these diverse responses, in-depth characterization of individual proteins or pathways11,12, and collection of information about multiple components that concertedly form the presumed adhesome13,14, have been undertaken. Each of these approaches has limitations, and individually is unlikely to explain how the adhesion machinery senses environmental cues and responds to them. However, combining data from the two approaches could produce new mechanistic insights into the structure–function relationships of the adhesome.
Here, we used data derived from published experimental studies to address the molecular basis for integrin-mediated adhesion and signalling at multiple hierarchical levels. We prepared an updated version of the integrin adhesome interaction map, presented as a network where we consider the various molecular components as nodes and their direct physiological or biochemical interactions as links. In contrast with previous schemes15, here we distinguish between ‘binding interactions’ (which are always non-directional) and ‘signalling interactions’ that have direction and can, in principle, be activating or inhibitory (see below). These extracted interaction records were used to construct functional subnetworks, and further examine their integration into the entire adhesome network. Computational methods were used to identify specific network motifs, which allowed us to identify several design principles in the adhesome network.
Constructing the adhesome network database
Progress in the past few years in integrin-associated adhesion research, and in the related area of functional genomics, has considerably increased the number of known adhesion components and interactions. The number of components that have been reported to physically reside within adhesion sites (focal complexes, focal adhesions, fibrillar adhesions and podosomes, herein collectively referred to as ‘integrin adhesions’) has increased to 90 components, and the number of ‘peripheral components’ that interact with the intrinsic adhesion components and affect their activity and fate has increased to 66. An annotated list of proteins and other intracellular components (such as lipids and ions) compiled from our recent literature search is shown in the Supplementary Information, Table S1 (see also http://www.adhesome.org). The distinction between ‘intrinsic’ and ‘associated’ adhesion components is based on specific adhesion-localization data, and draws an operationally defined boundary between what is presumed to be a fuzzy border. Many associated proteins may reside, at least under some conditions, in the adhesion complex, and have evaded detection by current experimental methods. Conversely, some of the intrinsic proteins may be transient members of the adhesion site, performing their function and then leaving. The updated list combines data from different cell types and consolidates all the different forms of integrin-mediated adhesions to develop a ‘canonical’ adhesome. Combining all the proteins and interactions into one network introduces some artificial combinations of connectivity. In our view, such limitations are outweighed by our ability to obtain a ‘bird's-eye’ view of the adhesome.
We assembled a list of 156 components (151 proteins plus four lipids and calcium ions) and mapped most of the known interactions between the components. Large protein–protein interaction databases (such as BIND16 and HPRD17) were used, in addition to extensive literature searches in Pubmed, including only seemingly direct protein–protein interactions. The primary literature was accessed for each interaction, so that we were able to determine its type. Interactions were characterized as binding or directional modification of a target by a source, defined here operationally as activation or inhibition, according to the molecular nature of the modification (rather than the presumed effect on the target molecule). Thus, phosphorylation, GEF activity and GTPase activation were considered activation events, whereas inhibition events included dephosphorylation, GAP action and ubiquitination or proteolytic degradation processes.
Characteristics of the adhesome network
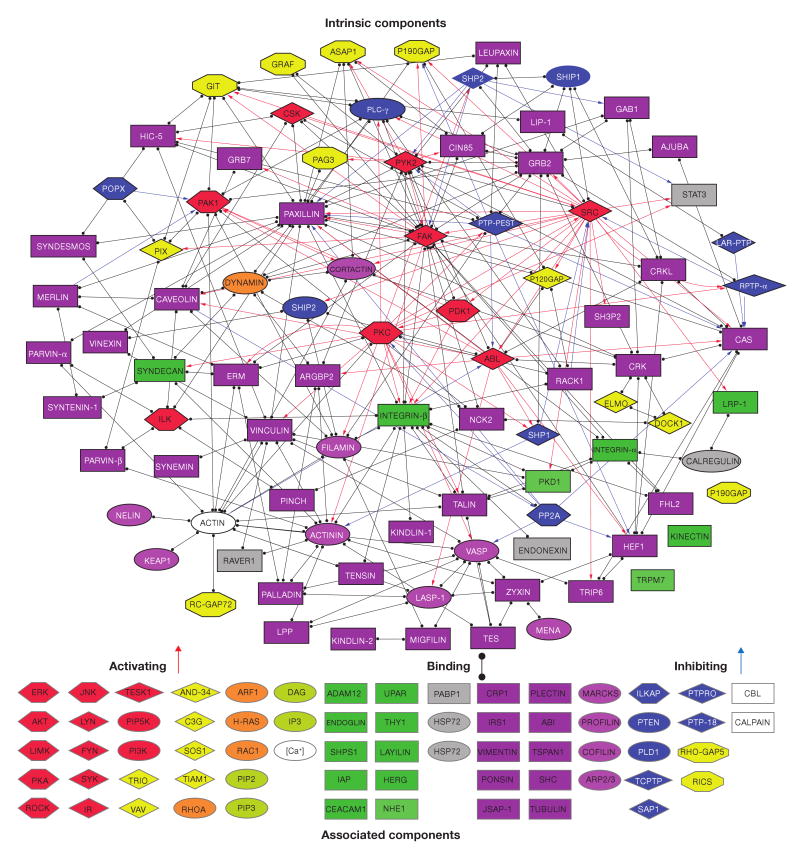
To construct the in silico adhesome network, we subdivided the 156 component molecules into functional groups, including 25 adaptor proteins, 24 cytoskeletal proteins, nine actin-binding proteins, 10 serine/threonine protein kinases, three serine/threonine protein phosphatases, nine tyrosine phosphatases, eight tyrosine kinases, eight GAPs, eight GEFs, seven transmembrane receptors, six adhesion proteins, five GTPases and 32 other types of components. Ninety components were designated intrinsic components, whereas 66 were adhesion-associated. The network contains 690 links, 379 of which are binding interactions, without direction. There are 213 activation interactions and 98 interactions defined as inhibitory. A partial view of the network, constructed with Cytoscape18, is illustrated in Fig. 1 — it includes only the interactions between intrinsic components and a list of the adhesion-associated components. For some proteins, especially the adaptors, the interactions within the adhesome constitute the vast majority of all their known interactions (for example, 15 out of 16 for vinculin), whereas other proteins (notably protein kinases and phosphatases) have many additional interactions outside the adhesome (for example, Abl has only 21 targets in adhesions out of 74 known interactions). The full list of interactions is shown in the Supplementary Information, Table S2 (see also http://www.adhesome.org).
Figure 1.
Interactions between all intrinsic components of the adhesome and a grouped list of the associated components. Black lines with full circles at their ends denote non-directional binding interactions, blue arrows represent directional inhibition (for example, dephosphorylation, G-protein inactivation or proteolysis) and red arrows represent directional activation (for example, phosphorylation or G-protein activation) interactions. The nodes are shape- and colour-coded according to the function of the proteins, as detailed in Fig. 2. Intrinsic components are surrounded by a black frame and associated components by a grey frame. For details see supplementary information, S2.
Compared with other mammalian intracellular-interaction networks constructed from literature, the adhesome network has a high number of links per node ratio. On average, each component has 8.66 direct interactions in the adhesome network, compared with 5.54 in BIND16, 7.23 in HPRD17, 5.14 in PPID19, 4.03 in IntAct20, 3.53 in MINT21 and 2.46 in DIP22, or compared with high-throughput experiments23,24. This high ratio may be attributed to the fact that the components in the adhesome form a dense complex. Additionally, systems that have been studied for a long time, such as the adhesome, are well characterized. This high ratio of links per component results in a high clustering coefficient25 of 0.24, and a high grid coefficient26 of 0.0343 — clustering coefficient measures the abundance of triangles (three components that are connected through three links), whereas the grid coefficient measures the density of both triangles and rectangles.
The distribution of connectivity within the adhesome (see Supplementary Information, Fig. S1) is likely to make it robust to failures because of the dense connectivity within the network. These network properties keep the adhesome intact, even after the removal of many nodes. In fact, even when all the proteins with 16 or more interactions are removed, the network remains intact (see Supplementary Information, Fig. S2). It is expected that proteins with more than 20 interactions, forming prominent hubs, will be more essential for the function of the network27,28: loss of integrin, paxillin, Grb2 and FAK, which all have 30 or more interactions, were shown to be embryonic lethal in mice, whereas loss of tensin, vimentin and IAP, which have fewer than seven interactions, did not have a devastating consequence (http://www.bioscience.org/knockout/alphabet.htm). An interesting exception to this rule is the knockout of Src — deletion of the most highly connected protein in the adhesome results in viable mice suffering only from osteopetrosis29. This may be explained by compensation provided by other Src family members such as Lyn and Fyn30.
Visualization of the whole adhesome network by including all the adhesion-associated components is a major graphic challenge because the resultant map consists of numerous links that cannot be readily resolved. To overcome this difficulty, we developed a web interface that allows dynamic navigation between hyperlinked subnets created for each component, and for many network motifs within the adhesome network. This interface allows zooming and panning functionality similar to the functionality provided by sites such as STKE connections maps31 (http://stke.sciencemag.org/). The web-based network interface can be accessed at http://www.adhesome.org.
Interactions between functional families
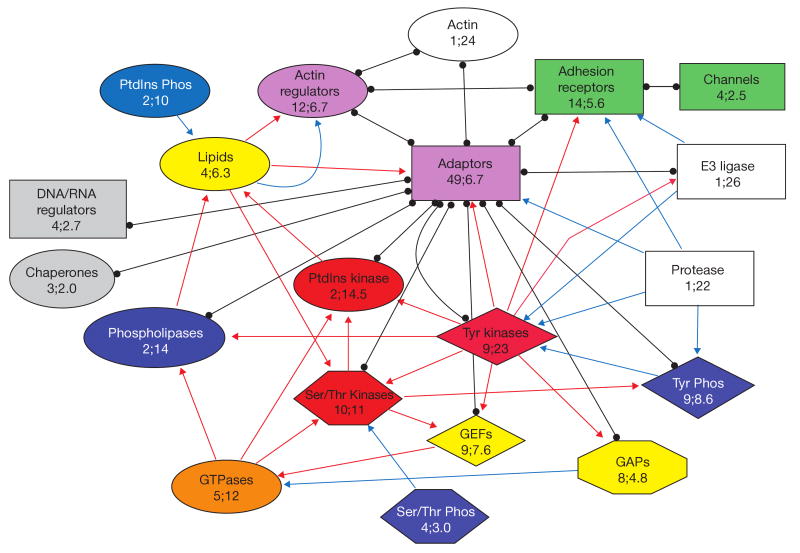
A utility-based approach to construct subnets is used to unite proteins with similar activities into functional families and then examine the interactions between these families. Each protein in the adhesome was categorized into one of 20 groups according to its known biological activity (see Supplementary Information, Table S1). The largest families are of adaptor proteins, adhesion receptors and actin regulators. Taken together, these three groups form the physical structure of the adhesome — connecting the membrane with the actin cytoskeleton. The remaining groups consist of mostly enzymes that have roles in regulating the assembly and turnover of the adhesion, as well as signalling from the adhesion into the cell. The number of family members and the average number of interactions for each family, in addition to the dominating interactions between protein families, are shown in Fig. 2, which also serves as a legend for the shape and colour of the different families as they appear in other figures. Notably, there is no correlation between the size and interaction density of the functional families.
Figure 2.
Interactions between functional families of adhesome components. Each protein in the adhesome was categorized into one of 20 groups according to its known biological activity. The families are shown in unique combinations of colour and shape, indicating the number of family members followed by the average number of their interactions. In addition, the dominating interactions between families (red arrows, activating interactions; blue arrows, inhibiting interactions; black lines, binding interactions) are shown. For details see supplementary information, S2.
If the probability for an interaction between any two given proteins was independent of their functional category, we would expect the number of interactions between any two given functional families to be proportional to the number of interactions each family has. However, using a hypergeometric test we found that the interactions between certain groups was favoured, whereas interaction between other groups was strongly discouraged. We interpret this as a manifestation of regulatory rules, determining hierarchies and control elements. Some of the results shown in Fig. 2 were expected (for example, that actin regulators interact with actin; interactions between adhesion receptors; and interactions of GAPs and GEFs with GTPases). However, other significant connections were quite revealing: GAP and GEF proteins are regulated by tyrosine kinases; GTPases regulate PtIns kinases and serine/threonine kinases, and PtdIns kinases are also regulated by tyrosine and serine/threonine kinases; lipids regulate adaptors and actin regulators; serine/threonine and tyrosine phosphatases dephosphorylate serine/threonine and tyrosine kinases, correspondingly.
The significant tendency not to interact can also be instructive. As expected, adhesion receptors do not interact with actin and GTPases do not interact with themselves. Of interest are the findings that the E3 ligase Cbl does not target actin regulators, adhesion receptors, GAPs, serine/threonine or tyrosine phosphatases, and, on the other hand, the protease calpain does not target GAPs or PtdIns kinases, whereas tyrosine kinases phosphorylate far fewer actin regulators than expected based on their group sizes. In addition, the following principles can be recognized from this analysis: first, adaptors are major ‘hubs’ — other than serine/threonine phosphatases, PtdIns phosphatases, GTPases and lipids, all other adhesome protein groups have connections with adaptors; second, tyrosine kinases regulate all the protein groups bound to adaptors, except tyrosine phosphatases and actin, and they do not regulate the groups that do not bind adaptors; third, GAPs and GEFs have opposite effects on GTPases, but they share great similarity in their position and regulation; fourth, serine/threonine kinases mainly regulate other kinases; fifth, most of the regulation is on kinases — phosphatases are either constitutively active or their regulators have yet to be identified; sixth, lipids modulate the activity of actin regulators and adaptors; and seventh, proteolytic activity is aimed mostly at adhesion receptors, adaptors and tyrosine kinases.
Dissection of the adhesome into subnets
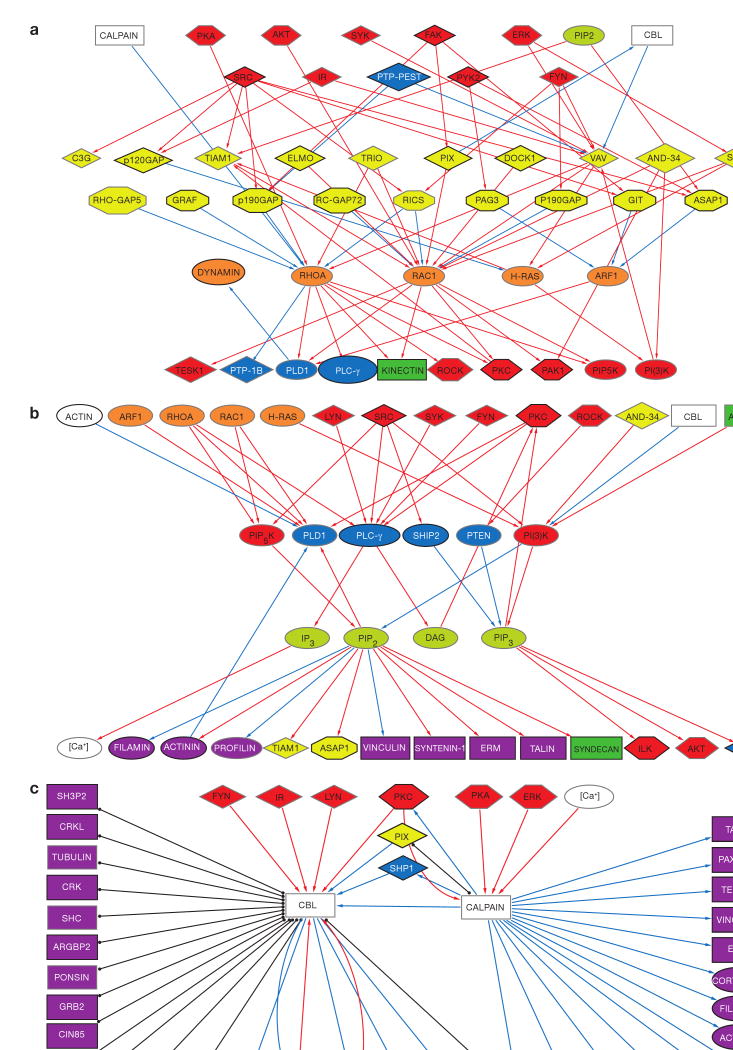
An emerging approach to understand the complexity of molecular interaction networks, which can be readily digested by both experimentalists and quantitative modellers, is to extract functional subnets from the entire network32. Towards this end, six such subnets were defined within the adhesome: one subnet is structural (Fig. 3), and the other five focus on major regulatory mechanisms: serine/threonine and tyrosine phosphorylation (Fig. 4) and Rho GTPases, lipids, and proteolytic activity (Fig. 5). In each subnet, we viewed only the relevant proteins, allowing us to reach the following insights.
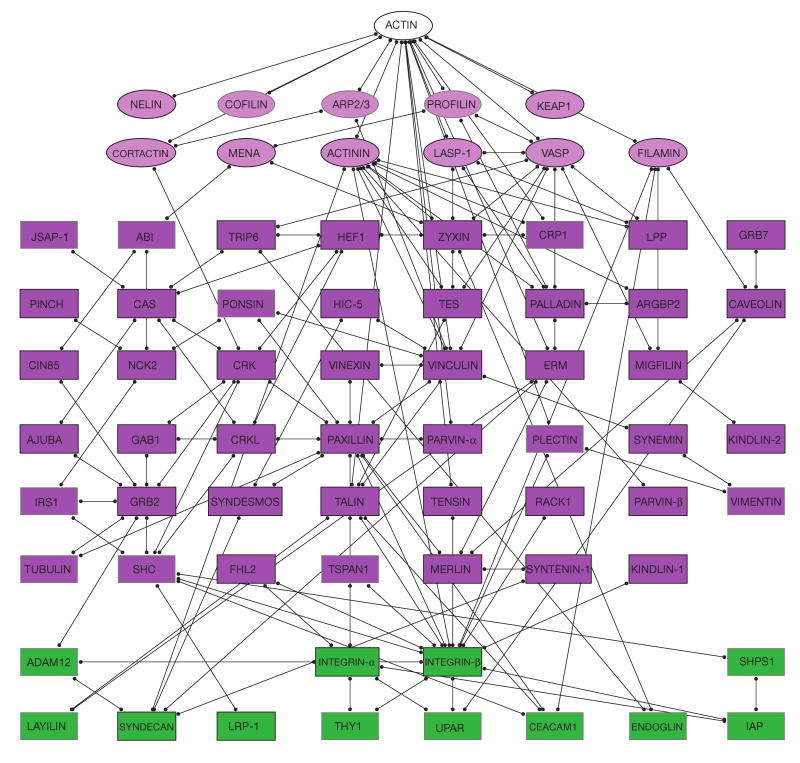
Figure 3.
Actin–integrin subnet interconnecting the membrane receptors (mainly integrin) with actin. Only binding interactions are shown. This subnet consists of actin, actin modulators (11 molecules), adaptor proteins (46 molecules) and transmembrane molecules (mainly integrin receptors). For details see supplementary information, S2.
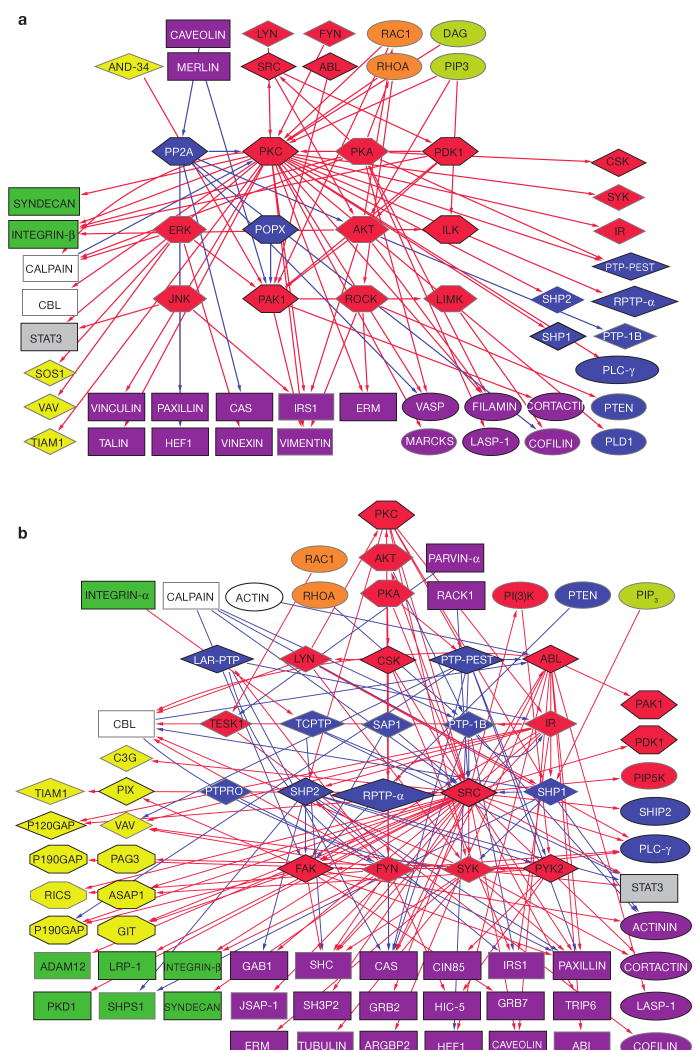
Figure 4.
Phosphorylation subnets mapping serine/threonine kinases and phosphatases (a) and tyrosine kinases and phosphatases (b). The figure depicts the corresponding kinases and phosphatases (in the centre), their diverse substrates (bottom and sides) and their regulators (top). The schematic shows hubs of activities (for example, PKC, Src) and a wide variety of substrates. For details see supplementary information, S2.
Figure 5.
GTPase, lipid and proteolytic subnets. (a) The G-proteins associated with the adhesome (mainly RhoA and Rac1) are shown above their main substrates and below their direct positive (GEFs) and negative (GAPs) regulators. Regulators of the GEFs and GAPs are mainly kinases (top). (b) Signalling lipids are shown with their diverse substrates, the regulatory kinases and phosphatases and their regulators (mainly kinases and G-proteins). (c) The two proteolytic systems associated with the adhesome (Cbl and calpain) affect multiple substrates, and are affected mainly by tyrosine kinases (Cbl) or serine/threonine kinases (calpain). For details see supplementary information, S2.
Subnet 1: connecting the membrane with actin
This subnet (75 nodes, 144 links; Fig. 3) consists of adhesion receptors, adaptors, actin regulators and actin, linked through binding interactions. Notably, adhesion receptors and actin are indirectly connected through adaptor and actin-binding proteins. There are five proteins (talin, tensin, plectin, filamin and α-actinin) that were reported to form a single bridge between integrin and actin. More commonly, there are two or more interlinking proteins. Importantly, in addition to integrins, there are ten other adhesion-receptor proteins with connections either to integrin and/or to adhesion-plaque proteins. Recent data suggest that such receptors (for example, syndecan33) can synergize with integrins in adhesion formation.
Subnet 2: serine/threonine phosphorylation
This subnet (54 nodes, 79 links; Fig. 4a) consists of all serine/threonine kinases and phosphatases with their substrates and regulators (binding interactions are not shown). Substrates include: tyrosine kinases and phosphatases, adaptors, actin regulators, Rac GEFs, integrins and calpain. Serine/threonine kinases are themselves phosphorylated by serine/threonine kinases and dephosphorylated by serine/threonine phosphatases. The serine/threonine phosphatases, however, are not regulated by serine/threonine kinases. Serine/threonine kinases are also regulated by tyrosine kinases, lipids and Rho GTPases. Notably, they are not cleaved by calpain (except PKC) or ubiquitinated by Cbl. There seems to be an effector–target hierarchy in serine/threonine kinase action, with PKC, PKA and PDK1 on top, AKT, ILK and ERK below, and PAK1, ROCK and LIMK at the bottom.
Subnet 3: tyrosine phosphorylation
This subnet (69 nodes, 154 links; Fig. 4b) consists of all tyrosine kinases and phosphatases with their substrates and regulators (binding interactions are not shown). With respect to their substrates, there is a significant representation of GTPase regulators, especially GAP proteins. Tyrosine phosphorylation regulates a large number of adaptors in addition to adhesion receptors, actin regulators and serine/threonine and PtdIns kinases. Notably, paxillin, CAS, IRS1 and SHC can be tyrosine phosphorylated by multiple kinases. Significantly, serine/threonine phosphatases are not regulated by tyrosine phosphorylation. Similarly, although tyrosine kinases are themselves targets for tyrosine kinases and phosphatases, tyrosine phosphatases are significantly not phosphorylated by kinases. Cbl activity is regulated by tyrosine phosphorylation. Tyrosine kinases are regulated mostly by serine/threonine kinases (PKA and PKC) and by themselves and tyrosine phosphatases, in addition to being cleaved by calpain. A striking feature of the subnet, is the overwhelmingly large number of red edges (activations) in comparison to a small number of blue edges (inhibitions). It is still not clear whether this is attributable to higher promiscuity of the tyrosine phosphatases, or merely reflects lack of sufficient knowledge.
Subnet 4: Rho GTPases
This subnet (44 nodes, 63 links; Fig. 5a) consists of GTPases and their effectors, GAPs, GEFs and the upstream regulators of the GAPs and GEFs. Only activating and inhibiting interactions are shown. GAPs and GEFs are primarily regulated by phosphorylation. GAP proteins are primarily regulated by tyrosine kinases and GEFs by serine/threonine kinases. In addition to being regulated by GAPs and GEFs, Rho GTPases are also regulated by serine/threonine kinases. Rho GTPases significantly regulate PtdIns kinases and also serine/threonine kinases that are lower in hierarchy than those regulating the GTPases. Rac has many more GEFs than GAPs, and Rho has many more GAPs than GEFs. Interestingly, all the regulators of Rho GEFs and GAPs are intrinsic components of adhesion, whereas all the regulators of Rac GEFs and GAPs are associated components.
Subnet 5: lipids
This subset contains 31 nodes and 37 links (Fig. 5b). The formation of PtsInsP2 and PtdsInsP3 is regulated by PtdIns kinases and phosphatases, which are regulated by GTPases, and also by tyrosine and serine/threonine kinases. The lipids themselves are mainly involved in the regulation of actin-binding capabilities of adaptor proteins (for example, talin and vinculin), and in control of actin bundling and cross-linking proteins (such as filamin and α-actinin). In some cases, binding of a lipid turns on the actin-binding activity, and in some cases it turns it off. Lipids also regulate serine/threonine kinases.
Subnet 6: proteolytic activity
This subset contains 43 nodes and 46 links (Fig. 5c). There is only one protease (calpain isoforms 1 and 2) and one ubiquitin E3 ligase protein (Cbl) responsible for degradation of adhesome proteins. Calpain is regulated by calcium and serine/threonine phosphorylation, and its substrates for cleavage are mostly adaptors and actin regulators, and two important tyrosine kinases. Calpain also degrades two tyrosine phosphatases — one of them, shp1, is a regulator of Cbl. Cbl is activated by tyrosine phosphorylation and through its E3-ligase activity it downregulates tyrosine kinase signalling and promotes proteasomal degradation of integrins. Interestingly, although both Cbl and calpain are negative regulators, they do not share substrates, suggesting a clear division in the target assignment of each of these components.
Interplay between subnets and interaction switches
While splitting the adhesome network into smaller, manageable subnets, it is important to remember that there is also a considerable interplay between the different subnets: for example, tyrosine phosphorylation and activation of GEF proteins (subnet 3) leads to GTPase activation and the subsequent activation of PtdIns kinases (subnet 4), leading to the formation of PtdInsP2, which regulates actin regulators (subnet 5).
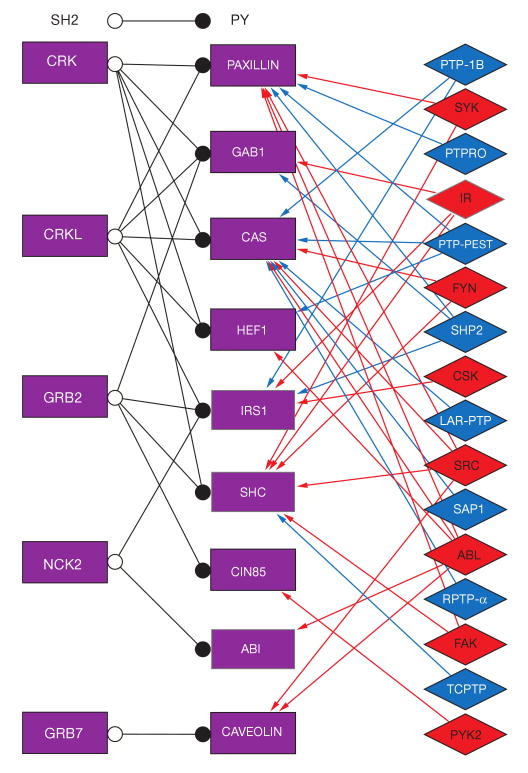
Many of the interactions between adaptor proteins depicted in subnet 1 and between adaptors and other proteins (see Fig. 1) are regulated by signalling events shown in the other subnets. This regulation of binding interactions is very important, because although anchoring of adhesion components through multiple links supports a robust scaffold structure, it is inconsistent with being a dynamic, regulatable structure, needed to respond to external stimuli and to support morphogenesis and cell migration. We estimate that more than half of the links interconnecting different adhesome components can be switched on or off by signalling elements. There are several types of regulated interaction switches: conformational switches, GTPase switches, lipid switches, proteolytic switches and PY–SH2 switches. Several adhesion proteins can be found in a folded, inactive state, and after binding of a lipid or GTPase, or after a phosphorylation or dephosphorylation event, they change conformation into an open, active state, in which new binding sites become available. Construction of a comprehensive ‘switch map’ is a highly ambitious undertaking that holds prospects for dynamic modelling of adhesion structure formation. Here, we partially demonstrate this type of map for adaptor interactions mediated by PY–SH2 interactions and regulated by tyrosine kinases and phosphatases (Fig. 6). Five adaptors contain one or more SH2 domains, which can mediate binding to a phosphorylated PY motif presented on one of nine other adaptor proteins. The binding depends on the tyrosine phosphorylation status of the PY motif, which is determined by the balance between activities of specific tyrosine kinases and phosphatases.
Figure 6.
Phosphorylation switches regulating specific phosphotyrosine–SH2 domain interactions. The adaptor proteins on the left contain SH2 domains, which can bind to phosphotyrosine residues present on the adaptor proteins in the centre. The interaction between the pairs of adaptor proteins is regulated by the phosphorylation state of the tyrosine residues, which depends on the activity of the tyrosine kinases or phosphatases shown on the right. For details see supplementary information, S2.
Network motifs of the adhesome
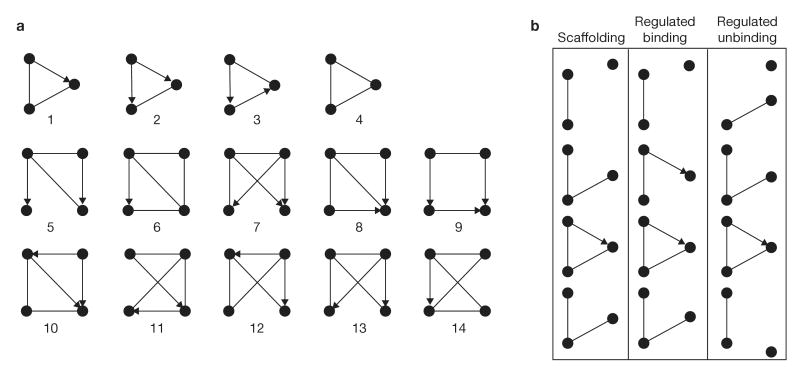
The above division into subnetworks was driven by previous biological knowledge and thus, although useful, is biased. An unbiased method to search for structural topological elements in the configuration of a network is to look for unique patterns of interactions between proteins that appear significantly more often in the real network compared with randomized networks. Such patterns, which may have been selected by evolution, are called network motifs. In transcription networks, they were shown to have important information-processing functions34–37. To detect network motifs in the adhesome, we applied the Mfinder software37,38. The software enumerates all _n_-node patterns and classifies them into one of several topologically distinct subgraphs. The counts for each subgraph are compared with the counts obtained in 100 randomized networks with the same number of nodes and equal number of links in and out of each node, as in the real network, but with randomized connections. Subgraphs that are observed significantly more frequently in the real network than in randomized networks are regarded as network motifs. The list of all three-node and four-node motifs is presented in Table 1, and graphical representations are shown in Fig. 7.
Table 1. Significant network motifs of the adhesome.
| Motif number | Number in adhesome network | Number in randomly shuffled nets | Z score | P value |
|---|---|---|---|---|
| 1 | 181 | 135.5 ± 12.5 | 3.65 | 0.000 |
| 2 | 105 | 82.3 ± 10.2 | 2.22 | 0.020 |
| 3 | 57 | 47.8 ± 7.4 | 1.24 | 0.110 |
| 4 | 138 | 124.4 ± 10.4 | 1.31 | 0.110 |
| 5 | 273 | 144.0 ± 46.2 | 2.79 | 0.000 |
| 6 | 201 | 127.3 ± 26.6 | 2.77 | 0.000 |
| 7 | 66 | 20.2 ± 9.4 | 4.85 | 0.000 |
| 8 | 39 | 18.2 ± 6.1 | 3.39 | 0.000 |
| 9 | 84 | 52.0 ± 12.7 | 2.53 | 0.010 |
| 10 | 84 | 50.1 ± 13.0 | 2.61 | 0.010 |
| 11 | 59 | 30.4 ± 9.5 | 3.02 | 0.010 |
| 12 | 171 | 110.1 ± 26.8 | 2.28 | 0.020 |
| 13 | 83 | 48.9 ± 14.5 | 2.36 | 0.020 |
| 14 | 98 | 64.2 ± 16.4 | 2.07 | 0.040 |
Figure 7.
Network motifs of the adhesome. (a) A schematic representation of the most significant three-node and four-node network motifs found in the adhesome. The statistical significance of each of these is listed in Table 1. (b) Three possibilities for the dynamic assembly or disassembly of a protein complex, based on interactions such as those depicted in motif 1. This motif acts as a signalling scaffold when binding of the substrate to the third protein precedes the enzymatic reaction: for example, the binding of PAK1 to PIX is a pre-requisite for its dephosphorylation by POPX, which is also bound to PIX. In other cases, the binding of the substrate to the third protein is positively or negatively regulated by the enzymatic reaction. An example of positive regulation would be the binding of HEF1 to paxillin only after it is phosphorylated by PYK2, which is also bound to paxillin. An example for negative regulation would be when SHP2 dephosphorylates IRS1 and breaks its binding to GRB2.
Motif 1 is made of an enzyme and its substrate, both having binding interactions with a third protein. This motif, which appears on its own 181 times, is also embedded within the vast majority of the four-node motifs. Noteworthy are: motif 8, in which one protein scaffolds two separate enzymes to act on one substrate; motif 13, in which one protein scaffolds an enzyme and two alternative substrates; and motif 14, in which two proteins can serve as a scaffold for one enzyme–substrate interaction. It is likely that these network motifs represent alternative pathways; in other words, not all links take place simultaneously (for example, Abl phosphorylates Cas, which then can bind to either Crk or CrkL). Motif 2 describes two substrates of an enzyme that are coupled by a binding interaction. Motifs 3 and 4 are statistically not as significant as motifs 1 and 2; however they do appear in the adhesome reasonably frequently. Motif 3 describes a cascade of two enzymes in which the substrate also binds the first enzyme, and motif 4 represents a tricomplex. What seems to be emerging as an underlying prominent property of the adhesome motifs is that if protein A interacts with proteins B and C, it is likely that proteins B and C will also interact — the only two exceptions to this rule are motifs 5 and 9. Motifs 9 and 10 both contain a feed-forward loop (FFL), in which there are both direct and indirect arrows leading from one node to another. Depending on the nature of interactions of the three arrows, several different coherent and incoherent FFL can exist. Motif 9 is most often an incoherent FFL (for example, Trio activates RhoA directly and it also binds FAK, which activates p190RhoGAP that inactivates RhoA), whereas motif 10 was found to be either a scaffold motif with the addition of an inhibitor (phosphatase or protease) that inhibits both enzyme and substrate, or a coherent FFL (for example, Src phosphorylates paxillin directly and indirectly by activating Abl, which phosphorylates paxillin).
As shown in Fig. 7a, the basic building blocks of almost all four-node motifs are the three node motifs, which indicates nesting of network motifs. We also searched for and found five-node motifs and, interestingly, they also consist of combinations of the same three node motifs (data not shown).
Network motifs are usually considered to be static circuits that process transient information34–37. However, we found that many of the adhesome network motifs were themselves dynamic. All the motifs consist of binding interactions, which are, as discussed above, regulated by on/off switches. In fact, the combination of binding and signalling elements of a motif is a manifestation of the interplay between the scaffold and regulatory subnets, and the ability to switch many of these interactions. In Fig. 7b we demonstrate how, for example, motif 1 could result from three different dynamic scenarios.
Conclusions and future prospects
Here, we describe a new approach for addressing the functional architecture of matrix adhesions, based, primarily, on published information about their scaffolding and signalling components. Our approach provides an opportunity to visualize the entire network, based on the currently available information, and characterize its architecture, internal molecular hierarchy and functional modularity. We demonstrate that breaking the ‘global net’ into functional modules (subnets), provides important insights into the fundamental design principles of the network. Similar insight was obtained about the basic network motifs, which are dominated by ‘scaffolding’ loops, capable of triggering local signalling events. Given the highly variable quality of the data which was used to construct the adhesome network, it is clear that the statistical significance of the identified network motifs cannot be unequivocally determined, yet the very high abundance of specific motifs strongly suggests that they are specific, and have a prominent physiological role and significance. It will be interesting to study experimentally the functional roles of these motifs in the adhesome context, as has been done for transcription networks34.
One of the main values of studies such as this, is the capacity to stimulate the generation of novel working hypotheses concerning specific adhesion-mediated signalling processes, and suggest possible perturbation strategies (such as the use of enzyme inhibitors or small interfering RNA), to challenge these hypotheses. Moreover, the simple outline described here, based on published data, can instigate modelling and simulations, which will further our understanding of how adhesion sites are formed and regulated, and how these molecular machines are capable of sensing the chemical and physical properties of their environment.
Supplementary Material
Figure S1 Connectivity distribution histogram of the adhesome network. Nodes/components are grouped based on their number of direct interactions. The six most connected proteins in decending order are: Src, FAK, PKC, Paxillin, Integrin-beta, and Grb2.
Figure S2 The adhesome network was decomposed by constructing subnetworks made only with nodes that have a certain maximum interactions per node (degree) connectivity. The number of islands (isolated connected clusters), characteristic path length (CPL), clustering coefficient (CC), and grid coefficient (GC) were computed for subnetworks with various connectivity thresholds (x-axis [allowed connectivity]). CPL was computed only when the network became one connected cluster.
Table S1 Annotated list of 156 components of the adhesome, providing the protein name, its synonyms, Gene name and Swiss port ID, as well as its general function and category (as in Fig 2). The proteins are classified as “intrinsic” or “associated, and a brief description is provided.
Table S2 A list of 690 interactions covering the known interactions between the 156 components of the adhesome. Interactions are listed in the order: source, type of interaction, target. Types of interaction are 1 = activating; 2 = inhibiting; 3 = binding.
Acknowledgments
This project is funded in part by a National Institutes of Health (NIH) NanoMedicine Center for Mechanical Biology (GM-54508), Advanced Research Center Grant NYSTAR from New York State to R.I. and National Institute of General Medical Science (NIGMS) grant for the Cell Migration Consortium (NIH Grant U54 GM64346), and the United States-Israel Bionational Science Foundation. B.G. holds the Erwin Neter Professorial Chair in Cell and Tumor Biology.
Footnotes
Competing Financial Interests: The authors declare no competing financial interests.
Website – www.adhesome.org contains the adhesome database of components and interactions with an interface that allows dynamical navigation between hyperlinked subnets created for each component and for many network motifs within the adhesome network.
Publisher's Disclaimer: Disclaimer: Nature Publishing Group has a collaboration with the Cell Migration Consortium for the creation and maintenance of the Cell Migration gateway (http://www.cellmigration.org/), but has no role in generating or curating the Cell Migration Consortium database content. As always, Nature Cell Biology Editors have been fully independent and solely responsible for the editorial content and peer review of this Analysis article.
Contributor Information
Ronen Zaidel-Bar, Department of Molecular Cell Biology, Weizmann Institute of Science, Rehovot, 76100, Israel.
Shalev Itzkovitz, Department of Molecular Cell Biology, Weizmann Institute of Science, Rehovot, 76100, Israel.
Avi Ma'ayan, Department of Pharmacology & Biological Chemistry, Mount Sinai School of Medicine, New York, NY 10029, USA.
Ravi Iyengar, Department of Pharmacology & Biological Chemistry, Mount Sinai School of Medicine, New York, NY 10029, USA.
Benjamin Geiger, Email: benny.geiger@weizmann.ac.il, Department of Molecular Cell Biology, Weizmann Institute of Science, Rehovot, 76100, Israel.
References
- 1.Burridge K, Fath K, Kelly T, Nuckolls G, Turner C. Focal adhesions: transmembrane junctions between the extracellular matrix and the cytoskeleton. Annu Rev Cell Biol. 1988;4:487–525. doi: 10.1146/annurev.cb.04.110188.002415. [DOI] [PubMed] [Google Scholar]
- 2.Geiger B, Bershadsky A, Pankov R, Yamada KM. Transmembrane crosstalk between the extracellular matrix — cytoskeleton crosstalk. Nature Rev Mol Cell Biol. 2001;2:793–805. doi: 10.1038/35099066. [DOI] [PubMed] [Google Scholar]
- 3.Critchley DR, et al. Integrin-mediated cell adhesion: the cytoskeletal connection. Biochem Soc Symp. 1999;65:79–99. [PubMed] [Google Scholar]
- 4.Geiger B, Bershadsky A. Exploring the neighborhood: adhesion-coupled cell mechanosensors. Cell. 2002;110:139–142. doi: 10.1016/s0092-8674(02)00831-0. [DOI] [PubMed] [Google Scholar]
- 5.Bershadsky A, Kozlov M, Geiger B. Adhesion-mediated mechanosensitivity: a time to experiment, and a time to theorize. Curr Opin Cell Biol. 2006;18:472–481. doi: 10.1016/j.ceb.2006.08.012. [DOI] [PubMed] [Google Scholar]
- 6.Cukierman E, Pankov R, Stevens DR, Yamada KM. Taking cell-matrix adhesions to the third dimension. Science. 2001;294:1708–1712. doi: 10.1126/science.1064829. [DOI] [PubMed] [Google Scholar]
- 7.Humphries MJ. The molecular basis and specificity of integrin-ligand interactions. J Cell Sci. 1990;97:585–592. doi: 10.1242/jcs.97.4.585. [DOI] [PubMed] [Google Scholar]
- 8.Cavalcanti-Adam EA, et al. Lateral spacing of integrin ligands influences cell spreading and focal adhesion assembly. Eur J Cell Biol. 2006;85:219–224. doi: 10.1016/j.ejcb.2005.09.011. [DOI] [PubMed] [Google Scholar]
- 9.Lo CM, Wang HB, Dembo M, Wang YL. Cell movement is guided by the rigidity of the substrate. Biophys J. 2000;79:144–152. doi: 10.1016/S0006-3495(00)76279-5. [DOI] [PMC free article] [PubMed] [Google Scholar]
- 10.Zaidel-Bar R, Kam Z, Geiger B. Polarized downregulation of the paxillin–p130CAS–Rac1 pathway induced by shear flow. J Cell Sci. 2005;118:3997–4007. doi: 10.1242/jcs.02523. [DOI] [PubMed] [Google Scholar]
- 11.Brown MC, Turner CE. Paxillin: adapting to change. Physiol Rev. 2004;84:1315–1339. doi: 10.1152/physrev.00002.2004. [DOI] [PubMed] [Google Scholar]
- 12.Legate KR, Montanez E, Kudlacek O, Fassler R. ILK, PINCH and parvin: the tIPP of integrin signalling. Nature Rev Mol Cell Biol. 2006;7:20–31. doi: 10.1038/nrm1789. [DOI] [PubMed] [Google Scholar]
- 13.Lo SH. Focal adhesions: what's new inside. Dev Biol. 2006;294:280–291. doi: 10.1016/j.ydbio.2006.03.029. [DOI] [PubMed] [Google Scholar]
- 14.Zamir E, Geiger B. Molecular complexity and dynamics of cell-matrix adhesions. J Cell Sci. 2001;114:3583–3590. doi: 10.1242/jcs.114.20.3583. [DOI] [PubMed] [Google Scholar]
- 15.Zamir E, Geiger B. Components of cell-matrix adhesions. J Cell Sci. 2001;114:3577–3579. doi: 10.1242/jcs.114.20.3577. [DOI] [PubMed] [Google Scholar]
- 16.Bader GD, Betel D, Hogue CW. BIND: the Biomolecular Interaction Network Database. Nucleic Acids Res. 2003;31:248–250. doi: 10.1093/nar/gkg056. [DOI] [PMC free article] [PubMed] [Google Scholar]
- 17.Mishra GR, et al. Human protein reference database — 2006 update. Nucleic Acids Res. 2006;34:D411–D414. doi: 10.1093/nar/gkj141. [DOI] [PMC free article] [PubMed] [Google Scholar]
- 18.Shannon P, et al. Cytoscape: a software environment for integrated models of biomolecular interaction networks. Genome Res. 2003;13:2498–2504. doi: 10.1101/gr.1239303. [DOI] [PMC free article] [PubMed] [Google Scholar]
- 19.Collins MO, et al. Molecular characterization and comparison of the components and multiprotein complexes in the postsynaptic proteome. J Neurochem. 2005;97:16–23. doi: 10.1111/j.1471-4159.2005.03507.x. [DOI] [PubMed] [Google Scholar]
- 20.Iragne F, Nikolski M, Mathieu B, Auber D, Sherman D. ProViz: protein interaction visualization and exploration. Bioinformatics. 2005;21:272–274. doi: 10.1093/bioinformatics/bth494. [DOI] [PubMed] [Google Scholar]
- 21.Zanzoni A, et al. MINT: a Molecular INTeraction database. FEBS Lett. 2002;513:135–140. doi: 10.1016/s0014-5793(01)03293-8. [DOI] [PubMed] [Google Scholar]
- 22.Xenarios I, et al. DIP: the database of interacting proteins. Nucleic Acids Res. 2000;28:289–291. doi: 10.1093/nar/28.1.289. [DOI] [PMC free article] [PubMed] [Google Scholar]
- 23.Rual JF, et al. Towards a proteome-scale map of the human protein-protein interaction network. Nature. 2005;437:1173–1178. doi: 10.1038/nature04209. [DOI] [PubMed] [Google Scholar]
- 24.Stelzl U, et al. A human protein-protein interaction network: a resource for annotating the proteome. Cell. 2005;122:957–968. doi: 10.1016/j.cell.2005.08.029. [DOI] [PubMed] [Google Scholar]
- 25.Watts DJ, Strogatz SH. Collective dynamics of ‘small-world’ networks. Nature. 1998;393:440–442. doi: 10.1038/30918. [DOI] [PubMed] [Google Scholar]
- 26.Caldarelli G, Pastor-Satorras R, Vespignani A. Structure of cycles and local ordering in complex networks. Eur Phys J B. 2004;38:183–186. [Google Scholar]
- 27.Jeong H, Mason SP, Barabasi AL, Oltvai ZN. Lethality and centrality in protein networks. Nature. 2001;411:41–42. doi: 10.1038/35075138. [DOI] [PubMed] [Google Scholar]
- 28.Albert R, Jeong H, Barabasi AL. Error and attack tolerance of complex networks. Nature. 2000;406:378–382. doi: 10.1038/35019019. [DOI] [PubMed] [Google Scholar]
- 29.Soriano P, Montgomery C, Geske R, Bradley A. Targeted disruption of the c-src proto-oncogene leads to osteopetrosis in mice. Cell. 1991;64:693–702. doi: 10.1016/0092-8674(91)90499-o. [DOI] [PubMed] [Google Scholar]
- 30.Parsons SJ, Parsons JT. Src family kinases, key regulators of signal transduction. Oncogene. 2004;23:7906–7909. doi: 10.1038/sj.onc.1208160. [DOI] [PubMed] [Google Scholar]
- 31.Gough NR, Ray LB. Mapping cellular signaling. Sci STKE. 2002;135:EG8. doi: 10.1126/stke.2002.135.eg8. [DOI] [PubMed] [Google Scholar]
- 32.Ma'ayan A, Blitzer RD, Iyengar R. Toward predictive models of mammalian cells. Annu Rev Biophys Biomol Struct. 2005;34:319–349. doi: 10.1146/annurev.biophys.34.040204.144415. [DOI] [PMC free article] [PubMed] [Google Scholar]
- 33.Mostafavi-Pour Z, et al. Integrin-specific signaling pathways controlling focal adhesion formation and cell migration. J Cell Biol. 2003;161:155–167. doi: 10.1083/jcb.200210176. [DOI] [PMC free article] [PubMed] [Google Scholar]
- 34.Mangan S, Alon U. Structure and function of the feed-forward loop network motif. Proc Natl Acad Sci USA. 2003;100:11980–11985. doi: 10.1073/pnas.2133841100. [DOI] [PMC free article] [PubMed] [Google Scholar]
- 35.Alon U. Biological networks: the tinkerer as an engineer. Science. 2003;301:1866–1867. doi: 10.1126/science.1089072. [DOI] [PubMed] [Google Scholar]
- 36.Shen-Orr SS, Milo R, Mangan S, Alon U. Network motifs in the transcriptional regulation network of Escherichia coli. Nature Genet. 2002;31:64–68. doi: 10.1038/ng881. [DOI] [PubMed] [Google Scholar]
- 37.Milo R, et al. Network motifs: simple building blocks of complex networks. Science. 2002;298:824–827. doi: 10.1126/science.298.5594.824. [DOI] [PubMed] [Google Scholar]
- 38.Kashtan N, Itzkovitz S, Milo R, Alon U. Efficient sampling algorithm for estimating subgraph concentrations and detecting network motifs. Bioinformatics. 2004;20:1746–1758. doi: 10.1093/bioinformatics/bth163. [DOI] [PubMed] [Google Scholar]
Associated Data
This section collects any data citations, data availability statements, or supplementary materials included in this article.
Supplementary Materials
Figure S1 Connectivity distribution histogram of the adhesome network. Nodes/components are grouped based on their number of direct interactions. The six most connected proteins in decending order are: Src, FAK, PKC, Paxillin, Integrin-beta, and Grb2.
Figure S2 The adhesome network was decomposed by constructing subnetworks made only with nodes that have a certain maximum interactions per node (degree) connectivity. The number of islands (isolated connected clusters), characteristic path length (CPL), clustering coefficient (CC), and grid coefficient (GC) were computed for subnetworks with various connectivity thresholds (x-axis [allowed connectivity]). CPL was computed only when the network became one connected cluster.
Table S1 Annotated list of 156 components of the adhesome, providing the protein name, its synonyms, Gene name and Swiss port ID, as well as its general function and category (as in Fig 2). The proteins are classified as “intrinsic” or “associated, and a brief description is provided.
Table S2 A list of 690 interactions covering the known interactions between the 156 components of the adhesome. Interactions are listed in the order: source, type of interaction, target. Types of interaction are 1 = activating; 2 = inhibiting; 3 = binding.
