Neurofibromatosis-1 Heterozygosity Increases Microglia in a Spatially- and Temporally-Restricted Pattern Relevant to Mouse Optic Glioma Formation and Growth (original) (raw)
. Author manuscript; available in PMC: 2012 Jan 1.
Published in final edited form as: J Neuropathol Exp Neurol. 2011 Jan;70(1):51–62. doi: 10.1097/NEN.0b013e3182032d37
Abstract
While carcinogenesis requires the acquisition of driver mutations in progenitor cells, tumor growth and progression is heavily influenced by the local microenvironment. Previous studies from our laboratory have employed Neurofibromatosis-1 (NF1) genetically engineered mice to characterize the role of stromal cells and signals to optic glioma formation and growth. Previously, we have shown that Nf1+/- microglia in the tumor microenvironment are critical cellular determinants of optic glioma proliferation. To define the role of microglia in tumor formation and maintenance further, we employed CD11b-TK mice, in which resident brain microglia (CD11b+, CD68+, Iba1+, CD45low cells) can be ablated at specific times following ganciclovir (GCV) administration. GCV-mediated microglia reduction reduced Nf1 optic glioma proliferation during both tumor maintenance and tumor development. We identified the developmental window during which microglia are increased in the Nf1+/- optic nerve and demonstrated that this accumulation reflected delayed microglia dispersion. The increase in microglia in the Nf1+/- optic nerve was associated with reduced expression of the chemokine receptor, CX3CR1, such that reduced Cx3cr1 expression in Cx3cr1-GFP heterozygous knockout mice led to a similar increase in optic nerve microglia. These results establish a critical role for microglia in the development and maintenance of Nf1 optic glioma.
Keywords: Astrocytoma, Chemokine, Fractalkine receptor, Microenvironment, Optic glioma, Stroma
Introduction
The concept that the tumor microenvironment plays instructive roles in oncogenesis and cancer growth has gained considerable traction over the past 10 years (1). In other cancers, stroma-tumor interactions involve immune system cells (leukocytes, mast cells, and macrophages) and fibroblasts, which secrete extracellular proteins, cytokines, and growth factors (2-5). Unlike other cancers, fibroblasts and mast cells are not relevant stromal cell types in brain tumors (gliomas), suggesting that other cell types may contribute to microenvironmental influences on central nervous system (CNS) tumorigenesis and growth. Moreover, the stromal signals that influence glioma formation and growth are likely distinct from those implicated in non-CNS cancers and may be regulated in a spatial and temporal pattern during postnatal brain development.
Previous studies from our laboratory have employed Nf1 genetically engineered mouse (GEM) strains to define the role of the tumor microenvironment in glioma formation and growth. Neurofibromatosis-1 is a common tumor predisposition syndrome in which children are prone to the development of low-grade glial cell neoplasms (gliomas) along the optic pathway (optic pathway gliomas). These low-grade gliomas are classified as World Health Organization (WHO) grade I pilocytic astrocytomas and are typically found in the optic nerve and chiasm of young children before 7 years of age (6). Children with NF1 are born with one non-functional copy of the NF1 gene in all cells of their body, (NF1 heterozygosity; Nf1+/-), but develop gliomas only upon loss of the one remaining functional allele in glial progenitor cells. To model this genetic condition in mice, we previously generated mice with Nf1 inactivation in glial progenitors; however, none of these mice developed gliomas (7). In contrast, glioma formation was only observed in Nf1+/- mice with glial cell Nf1 inactivation, thus establishing an absolute requirement for Nf1 heterozygosity in glioma formation (8). The observation that Nf1 loss in glial progenitors is necessary, but not sufficient, for tumorigenesis supported the hypothesis that non-neoplastic Nf1+/- cells provide a permissive environment required for glioma formation. By leveraging Nf1 GEM strains with highly penetrant tumor phenotypes we showed that microglia represented one of the critical cell types present in the tumor microenvironment of Nf1 optic glioma mice (9).
Microglia have long been recognized as a major cellular constituent of the glioma microenvironment (10-13). Rio-Hortega and Asua first identified microglia in brain tumors in 1921 (14); however, their role in glioma formation and continued growth (maintenance) remains unclear. In this regard, microglia may have anti-tumor activity (15, 16) or promote glioma growth by producing cytokines, such as interleukin (interleukin)-1, IL-10, basic fibroblast growth factor, and transforming growth factor-β (17-19). To define the role of microglia in glioma growth, we previously employed 2 independent approaches to microglia inactivation in Nf1 GEM optic gliomas. First, using minocycline to inactivate microglia in 10- to 12-week-old Nf1 optic glioma mice, we found that reduced microglia activation, as assessed by morphological change, reduced tumor proliferation (20). Second, we identified that Nf1+/- microglia, but not _Nf1_-deficient astroglial cells, exhibited hyperactivation of c-Jun-NH2-kinase (JNK) such that treatment of Nf1 optic glioma mice with a relatively non-selective pharmacologic JNK inhibitor attenuated tumor proliferation (21). These proof-of-principle experiments demonstrated that Nf1+/- microglia inactivation decreased Nf1 optic glioma proliferation in vivo, but the inhibitors used in these studies did not directly target microglia and may have had additional effects. Moreover, these studies did not address the importance of microglia during Nf1 optic glioma development.
In the current study, we employ a novel CD11b-TK transgenic mouse strain to ablate microglia genetically and demonstrate that microglia are important stromal cell types during gliomagenesis and for glioma maintenance. In addition, we define a spatially- and temporally-restricted window in which increased numbers of microglia are present in the Nf1+/- optic nerve. We further demonstrate that this increase in microglia likely reflects impaired microglial dispersal during postnatal optic nerve development as a result of reduced CX3CR1 expression. Collectively, these findings establish a critical role for microglia in promoting tumor proliferation throughout gliomagenesis.
Materials and Methods
Mouse and human specimens
Mice were used in accordance to established Animal Studies Protocols at the Washington University School of Medicine. Nf1flox/-; GFAP-Cre (Nf1+/-GFAPCKO), Nf1flox/-; GFAP-Cre; CD11b-TK (Nf1+/-GFAPCKO-TK), CD11b-TK (22), Cx3cr1+/GFP (23), Nf1+/-;Cx3cr1+/GFP, wild type (WT) and Nf1+/- mice were all maintained on a C57BL/6 background. The Nf1+/-GFAPCKO optic gliomas lack the Rosenthal fibers and eosinophilic granular bodies that are characteristic of human pilocytic astrocytomas, but otherwise closely resemble pediatric low-grade gliomas, based on the presence of discrete optic nerve/chiasm masses composed of hyperproliferating astrocytes with large hyperchromatic nuclei, low proliferative indices, new blood vessel formation, microglia infiltration, Olig2-immunoreactive cells, and contrast enhancement on small-animal MRI (8); there is no evidence of endothelial hyperplasia or necrosis.
Human tumor specimens were used in accordance with established guidelines under an active and approved Human Studies Protocol. Human glioma specimens were studied using 2 individual tissue microarrays developed at the Mayo Clinic Foundation and Washington University School of Medicine, as previously reported (24, 25). Non-neoplastic human brain samples from the neocortex were obtained from autopsy materials acquired under an approved Human Studies Protocol at the Washington University School of Medicine.
Immunohistochemistry
Mice were perfused transcardially with 4% paraformaldehyde in 0.1M sodium phosphate buffer (pH 7.4). Optic nerves and optic chiasms were dissected and post-fixed in 4% paraformaldehyde overnight at 4°C. All specimens were then processed for paraffin embedding and sectioning in the Ophthalmology Histology Core or the Histology and Microscopy Core at Washington University School of Medicine. Slides were deparaffinized in xylene and subjected to antigen retrieval. After the washing and blocking steps, sections were incubated overnight with rabbit anti-Iba1 (1:3000; Wako, Richmond, VA), mouse anti-Ki67 (1:500; BD Biosciences, San Jose, CA), or rat anti-CD34 (1:50; BD Biosciences) followed by incubation with biotinylated secondary antibodies (1:200; Vector Laboratories, Burlingame, CA) at room temperature (RT) for 1 hour. Immunoreactivity was visualized with the Vectastain ABC system and 3,3′-diaminobenzidine, Vector NovaRED, or Vector SG (Vector Laboratories, Burlingame, CA).
All sections were photographed using a digital camera attached to a Nikon Eclipse E600 microscope. For each optic nerve counted, 3 photographs were taken at a magnification of 10× for at least 4 mice/group, including the optic chiasm and the right or left optic nerve just anterior to the chiasm (Supplemental Fig. 1A). For brainstem and neocortex regions, 4 photographs were taken at a magnification of 10× for at least 4 mice/group (Supplemental Fig. 1B, C). The total number of Iba1-positive cells was quantitated in the mouse pre-chiasmatic optic nerves, chiasm, brainstem, and neocortex, as previously described, with the investigator blinded to the genotype and treatment (26). All Iba1-positive cells were counted regardless of morphology (amoeboid vs. ramified). In the human tumors, the number of Iba1-positive cells was calculated as a percentage of the total number of nucleated cells.
Immunofluorescence
After transcardial perfusion with Ringer's solution (147 mM NaCl, 4 mM KCl, 2.2 mM CaCl2·2H2O, with 2.5 USP units/mL heparin sodium injection, 0.02mg/mL lidocaine HCL), WT mouse optic nerves and chiasms were dissected and post-fixed in 4% paraformaldehyde overnight at 4°C. Tissues were cryoprotected in 30% sucrose in 0.1 M sodium phosphate buffer (pH 7.4), embedded in OCT embedding media (Tissue-Tek, Miles, Inc., Elkhart, IN), cut into 10-μm sections in a cryostat, collected on Superfrost Plus slides (Fisher Scientific, Waltham, MA), and stored at -20°C. Slides were washed, permeabilized in 0.2% Triton X-100 in phosphate buffer, blocked, incubated overnight at 4°C with rabbit anti-Iba1 (1:2000), rat anti-CD11b (M1/70, 1:10; BD Biosciences), or mouse anti-Ki67 (1:500; BD Biosciences), followed by incubation with fluorescent secondary antibodies (1:200 goat anti-rat A488, goat anti-rabbit A568, or goat anti-mouse A488; Invitrogen, Carlsbad, CA) for 1 hour at RT. In all cases, no specific immunostaining was observed in the negative control samples. Images were acquired using an Olympus multichannel confocal microscope in the Washington University Bakewell Neuroimaging Core Facility and Image J image analysis software (http://rsbweb.nih.gov/ij/; Wayne Rasband, National Institute of Mental Health, Bethesda, MD) was used to obtain a single collapsed image from an optical stack.
Ganciclovir treatment
Ganciclovir (GCV; Sigma-Aldrich, St. Louis, MO) was dissolved in phosphate buffered saline (PBS) and administered at a dosage of 50 mg/kg. For the experiments focused on determining the acute effects of microglia ablation on optic glioma proliferation, Nf1+/-GFAPCKO-TK mice were divided into 2 groups: One group received daily intraperitoneal GCV injections for 2 weeks starting at 3 weeks or 3 months of age, while the other group received daily intraperitoneal injections of vehicle (PBS) starting at 3 weeks or 3 months of age.
Flow cytometry
Microglia from mice were collected using previously described procedures with minor modifications (27). Briefly, for each experiment, optic nerves and chiasms harvested from 7 to 10 mice, transcardially perfused with Ringer's solution, were homogenized through a 70-μm nylon filter (Fisher Scientific, Waltham, MA), enzymatically digested in Hanks Buffered Salt Solution without calcium and magnesium containing 0.05% collagenase I (Sigma-Aldrich), 0.1 μg/mL Nα-Tosyl-L-lysine chloromethyl ketone hydrochloride (TLCK, Sigma-Aldrich), 0.01 mg/mL bovine deoxyribonuclease I (DNase I, Sigma-Aldrich), 10 mM Hepes buffer (pH7.4) for 1 hour at RT, and filtered through a 40-μm nylon filter (Fisher Scientific, Waltham, MA). Brainstem specimens were similarly processed to obtain cells for flow cytometry controls. A discontinuous Percoll gradient (Amersham/GE Healthcare, Waukesha, WI) of 30%, 37%, and 70% allowed for collection of an enriched macrophage and microglia sample from the 37% to 70% interface. Alternately, magnetic cell sorting using CD11b microbeads after myelin removal (Miltenyi Biotec, Bergisch Gladbach, Germany) were used to extract the CD11b+ microglia population. After Fc blocking with a CD16/32 antibody (BD Biosciences), cell surface staining was performed with anti-CD45-APC (30-F11, BD Biosciences) and anti-CD11b-PerCP-Cy5.5 antibodies. In some experiments, cells were fixed and permeabilized with the BD Cytofix/Cytoperm Fixation/Permeabilization Kit (BD Biosciences) and then stained with CD68-R-PE (FA-11, AbD Serotec, Oxford, UK) or rabbit anti-Iba1 (Wako) conjugated to R-PE using the Zenon Rabbit IgG Labeling Kit (Molecular Probes, Invitrogen). Isotype and fluorescence minus one controls were used to determine nonspecific staining. Flow cytometry data were collected on a BD FACScan flow cytometer retrofitted with a second laser (Cytek, Fremont, CA) using CellQuest (BD Biosciences) and Rainbow software (Cytek) in the High Speed Cell Sorter Core Facility at the Siteman Cancer Center, Washington University, and the data were subsequently analyzed using FlowJo (Tree Star, Inc., Ashland, OR). Viable cells were gated by FSC and SSC characteristics, and the appropriate controls were used for compensation and to determine negatively and positively stained populations, as previously described (28).
Quantitative reverse transcription-PCR
Real-time PCR (quantitative PCR) was performed using SYBR Green detection according to the manufacturer's instructions. Total RNA was extracted from Nf1+/- and WT optic nerve using Trizol. cDNA was synthesized from total RNA samples using the Ominiscript kit (Qiagen, Alameda, CA). Amplification was performed in 96 well plates in a real-time sequence detection system instrument (Bio-Rad CFX96 Real-Time System, Hercules, CA). Primer sequences for Cx3cr1 were 5′-AGGCCTGTTATTTGGGCGACAT-3′ (forward) and 5′AGCGAGGACCACCAACAGATTT-3′ (reverse). Primer sequences for Cx3cl1 were 5′-AAATGGGTCCAAGACGCCATGA-3′ (forward) and 5′-ACATTGTCCACCCGCTTCTCAA-3′ (reverse). Bio-Rad CFX Manager software was used to convert the fluorescent data into cycle threshold (CT) measurements. The ΔΔCT method was used to calculate changes in fold expression relative to WT optic nerve using β-actin as an internal control.
Statistical analyses
Student t tests, along with Grubbs' test to determine outliers, were performed for all statistical analyses. Mean and SEM were used for all graphs. For all experiments involving cell quantitation, the investigators were blinded to mouse genotype and treatment.
Results
Increased microglia in NF1-associated pilocytic astrocytomas
Several previous studies have reported increased numbers of microglia in human gliomas, constituting as many as a third of all cells in glioma biopsies (10-13). We also found a 2-fold increase in the percentage of Iba1-postive cells (microglia) in high-grade human astrocytomas (Fig. 1A, B). Previous studies had suggested that it is a highly selective marker of brain microglia in both human (29) and rodent tissues (30). By contrast, anti-CD68 antibodies label resident brain microglia (CD68+, CD11b+, CD45low cells), (31, 32), lymphocytes (CD68+, CD11b+/-, CD45high) (33, 34), neutrophils (CD68+, CD11b+, CD45high) (35, 36), dendritic cells (CD68+, CD11b+, CD45high cells) (37, 38), and bone marrow-derived monocytes (CD68+, CD11b+, CD45high cells) (32, 39). Similar percentages of microglia were generally found in WHO grade I low-grade gliomas as in the high-grade tumors, but NF1-associated pilocytic astrocytomas (NF1-PA) had higher percentages of microglia than their sporadic counterparts (SP-PA) (p = 0.0008) (Fig. 1A, C).
Figure 1.
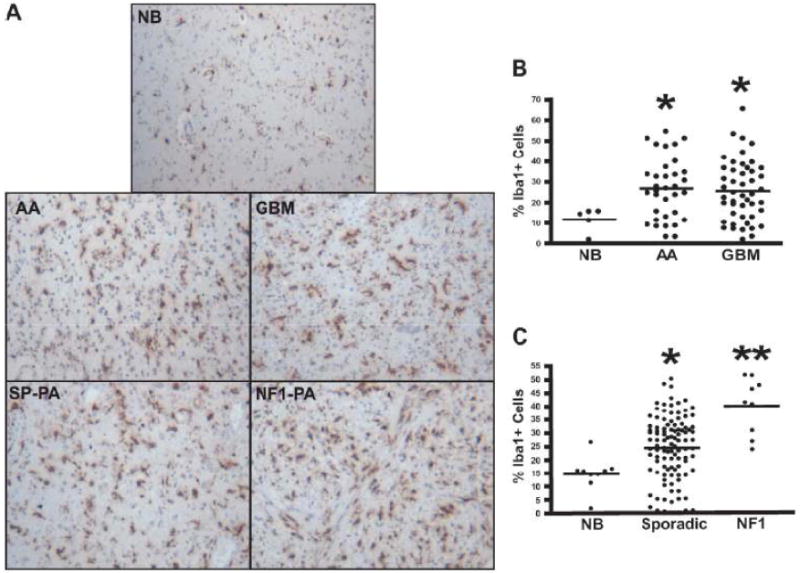
Increased microglia in neurofibromatosis type 1 (NF1)-associated pilocytic astrocytomas. (A-C) Iba1 immunohistochemistry demonstrates increased percentages of microglia in anaplastic astrocytomas (AA) (p = 0.0236) and glioblastoma multiforme (GBM) tumors (p = 0.0377) vs. non-neoplastic brain (NB). (C) Sporadic pilocytic astrocytomas (SP-PA) have a greater percentage of Iba1+ cells compared to NB (p < 0.0001) (A, C), but the greatest percentage of microglia is seen in NF1-associated pilocytic astrocytomas (NF1-PA) (p < 0.0001 vs. NB) (p = 0.0008 vs. SP-PA).
Because previous reports employed CD68 as a marker for microglia in brain tumors (40, 41), we analyzed numbers of CD68-positive cells in the PA tumors. There was a trend towards increased numbers of CD68-positive cells in NF1-PA tumors vs. both their sporadic counterparts and non-neoplastic brain (NB) tissue, the results did not reach statistical significance (Supplemental Fig. 2A, B). We suspect the differences between the results obtained using Iba1 and CD68 immunostaining reflects the labeling of blood-derived macrophages and neutrophils by the anti-CD68, but not the Iba1 antibody. We also observed stronger immunoreactivity with the Iba1 antibody in the formalin-fixed, paraffin-embedded specimens. Moreover, in studies of CD68 and Iba1 co-labeling in areas of brain ischemia, numerous CD68+ cells lacked Iba1 co-labeling and, therefore, likely represented bone marrow-derived macrophages, leukocytes, neutrophils or dendritic cells (35, 39) (Supplemental Fig. 2C). The finding of greater numbers of Iba1-positive microglia in NF1-PA than in SP-PA raised suggested that these stromal cells play a particularly important role in NF1-associated gliomas.
Genetic ablation of microglia in established tumors decreases Nf1 mouse optic glioma proliferation
Our prior study on microglia in human pilocytic astrocytomas suggested that the number of microglia in the tumors correlated with glioma proliferation rate (42). We also previously showed that minocycline- or JNK inhibitor-mediated microglia inactivation decreased optic glioma tumor cell proliferation in vivo (20). However, these pharmacologic approaches are limited by potential off-target effects affecting other cell types in the tumor microenvironment and do not directly address the role of microglia in tumor proliferation. To establish a more definitive role for microglia in regulating Nf1 optic glioma proliferation in _Nf1+/-_GFAPCKO mice at 3 months of age with radiographically and histologically obvious tumors, we employed a novel transgenic mouse in which CD11b+ cells express the thymidine kinase (TK) gene (22). Upon the administration of GCV, CD11b+ cells are killed.
To characterize the CD11b+ population in the mouse optic nerve and to determine whether the ablated CD11b+ cells were primarily microglia, we performed flow cytometry and immunohistochemistry studies using several established monocyte markers. First, we found that CD11b and CD68 label the same population of cells in the optic nerves of 6-week-old WT mice (Fig. 2A). The majority of this population expressed low levels of CD45 characteristic of resident microglia (R1 = 95% of the CD11b+ cell population), rather than high levels of CD45 indicative of bone marrow-derived macrophages (Fig. 2B). Iba1 co-labeled these CD11b+ cells, as determined by flow cytometry (Fig. 2C) and Iba1/CD11b double labeling in optic nerve sections (Fig 2D). In both cases, over 99% of the cells analyzed were positive for both CD11b and Iba1. Iba1+ cells also express low levels of CD45 (Fig. 2E, R1 = 95% of Iba1+ cells), consistent with their classification as resident microglia. Moreover, using CD11b magnetic bead capture of microglia from optic gliomas of 3-month-old Nf1+/-GFAPCKO mice, the majority of the CD11b+ population isolated had low CD45 expression (Fig. 2F), thereby establishing that GCV/TK-mediated ablation of CD11b+ cells in Nf1 mouse optic gliomas mainly targets the resident microglia population.
Figure 2.
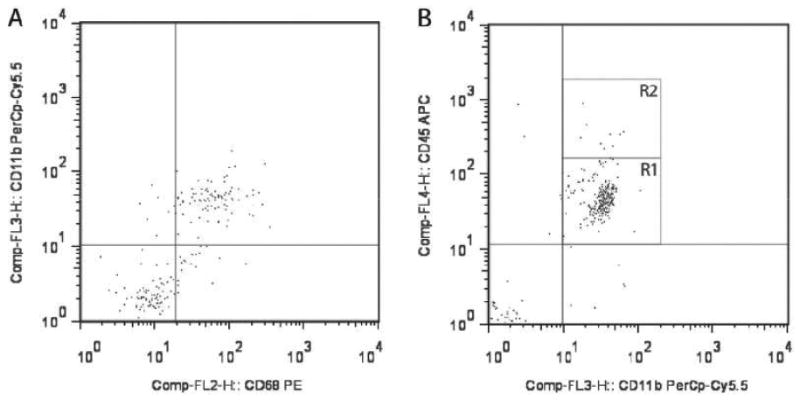
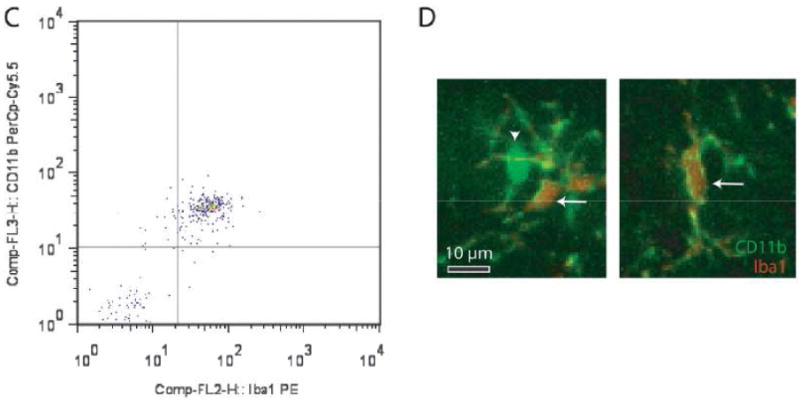
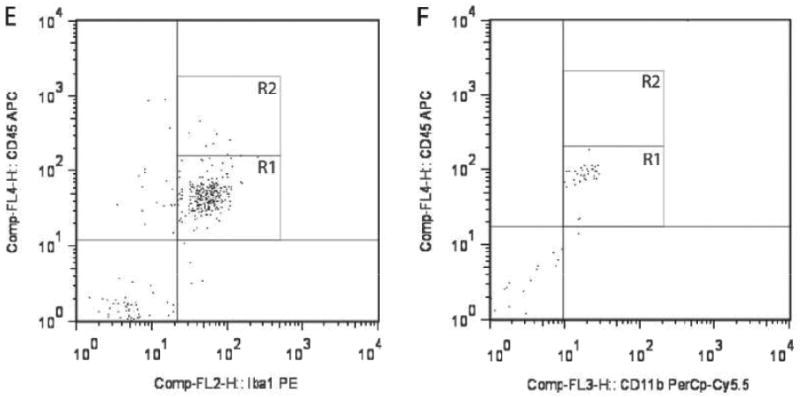
Microglia in the mouse optic nerve at 6 weeks of age and in mouse optic gliomas at 3 months of age are mainly resident microglia. (A) Flow cytometry demonstrates that the majority of cells from 6-week-old wild type (WT) optic nerves (10 pooled optic nerves) are doubly positive for both CD11b and CD68. (B) The majority of these CD11b+ cells express low levels of CD45 (R1). (C) CD11b+ microglia in the 6-week-old optic nerve are also Iba1+. (D) Using double-labeling immunofluorescence, there are rare cells in the 6-week-old WT optic nerve that label with CD11b antibodies (green) alone (inset, arrowhead), whereas the vast majority (∼99%) of the microglia co-label with both CD11b and Iba1 antibodies (inset, arrows) (n = 5). (E) Iba1+ cells express low levels of CD45 (R1). (F) CD11b magnetic cell capture of microglia from 3-month-old _Nf1+/-_GFAPCKO mouse optic gliomas (7 pooled optic nerves), followed by flow cytometry demonstrates that the CD11b+ cells are also almost exclusively CD45-low (R1).
Based on these findings, we intercrossed CD11b-TK mice with our Nf1+/-GFAPCKO mice to generate Nf1+/-GFAPCKO-TK mice and injected GCV intraperitoneal daily for 2 weeks into 3-month-old Nf1+/-GFAPCKO-TK mice. For controls, vehicle (PBS) was injected into 3-month-old Nf1+/-GFAPCKO-TK mice. At the completion of the 2-week treatment, the optic nerves were removed for analysis. Following GCV administration there was a 49% reduction in the numbers of Iba1-positive microglia in the optic nerves of the GCV-treated vs. vehicle-treated control mice (Fig. 3A). No differences in numbers of Iba1-positive cells or Ki67-positive cells between PBS-treated Nf1+/-GFAPCKO-TK mice were found compared to GCV-treated Nf1+/-GFAPCKO mice lacking the CD11b-TK transgene (data not shown). Consistent with previous studies using minocycline (20), GCV-mediated microglia ablation reduced optic glioma proliferation (Ki67-positive staining), by 94% (Fig. 3B). This reduction in proliferation reflects reduced glial cell proliferation and not microglia proliferation, as demonstrated by a lack of double labeling for Ki67 and Iba1 (Supplemental Fig. 3) (20). In contrast to the effects of GCV treatment on microglia cell numbers and optic glioma proliferation there was no significant change in the number of CD34-positive+ cells within the optic nerves of GCV-treated Nf1+/-GFAPCKO-TK mice compared to vehicle-treated controls (Fig. 3C). Together with previous studies, these new findings establish a critical role for microglia in the maintenance of Nf1 mouse optic glioma proliferation.
Figure 3.
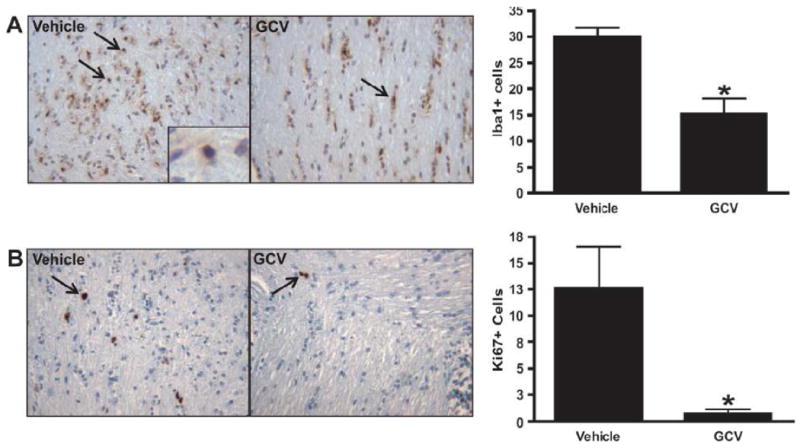

Microglia ablation at 3 months of age reduces optic glioma proliferation. (A, B) Treatment of Nf1+/-GFAPCKO-TK mice (n = 7) with ganciclovir (GCV) at 3 months of age reduces the number of Iba1-positive cells by 49% (p = 0.0280) and results in a 94% decrease in the number of Ki-67-positive cells in the optic nerve (p = 0.0118) vs. Nf1+/-GFAPCKO-TK mice treated with vehicle (n = 7). (C) GCV treatment did not affect endothelial cell numbers, as assessed by CD34 immunohistochemistry (p = 0.2864).
Microglia ablation during optic glioma development reduces tumor proliferation
We hypothesized that microglia might also have important functions during optic glioma formation that may be distinct from their growth-promoting role in glioma maintenance. Previously, we showed that the earliest changes in optic nerve organization were observed between 3 and 6 weeks of age, as evidenced by increased numbers of microglia (20), increased glial cell proliferation (9, 26) and disruption of the relationship between optic nerve axons and their associated glia (43). To determine the impact of microglia inactivation/ablation during the early phase of optic glioma formation, we treated Nf1+/-GFAPCKO-TK mice with GCV or control vehicle (PBS) for 2 weeks beginning at 3 weeks of age.
Similar to the GCV-treated 3-month-old Nf1+/-GFAPCKO-TK mice, there was a 43% decrease in the number of Iba1-positive cells in the optic nerves of GCV-treated mice at 3 to 5 weeks of age vs. controls (Fig. 4A). Following GCV treatment, optic glioma proliferation was decreased by 63% (Fig. 4B), with no change in the number of CD34+ cells (Fig. 4C). These results demonstrate for the first time that microglia also facilitate glial cell proliferation during the early phases of optic glioma development.
Figure 4.
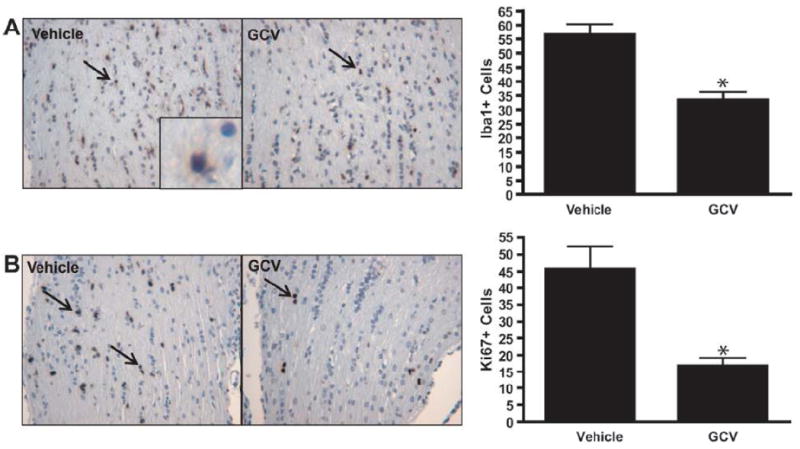

Microglia ablation at 3 weeks of age reduces early optic glioma proliferation. (A, B) Nf1+/-GFAPCKO-TK mice (n = 6) treated with ganciclovir (GCV) beginning at 3 weeks of age reduces the number of Iba1+ cells by 43% (p = 0.0012) and results in a 63% decrease in Ki-67-positive cells in the optic nerve vs. Nf1+/-GFAPCKO-TK mice (n = 6) treated with vehicle (p = 0.0013). (C) GCV treatment did not affect endothelial cell numbers as assessed by CD34 immunohistochemistry (p = 0.5405).
Nf1+/- optic nerves have increased numbers of microglia at 6 weeks, but not at 3 weeks or 3 months of age
We next sought to determine whether Nf1 heterozygosity resulted in a temporally- and spatially-restricted increase in microglia numbers. For these studies, we performed Iba1 immunostaining in the optic nerves and brains of Nf1+/- and WT mice at 2 time points: before obvious glioma formation (3 weeks and 6 weeks of age), and a time point when radiographically and histologically evident gliomas are seen (3 months of age). At 3 weeks of age, Nf1+/- and WT mice had equivalent numbers of Iba1-positive cells in the optic nerve, but at 6 weeks of age, microglia numbers in the WT optic nerve had decreased compared to the WT optic nerve at 3 weeks, whereas the number of microglia in the Nf1+/- optic nerve did not decline (Fig. 5A, B). This difference in microglia dispersal resulted in a 2-fold increase in the number of microglia in the optic nerves of Nf1+/- mice compared to their WT littermates. By 3 months of age, no differences in optic nerve microglia numbers were observed between Nf1+/- and WT mice (Fig. 5A, B). These results support the notion that there is developmental (temporal) regulation of microglia numbers in the optic nerve resulting from Nf1 heterozygosity, suggesting that Nf1+/- microglia have delayed or defective dispersion.
Figure 5.
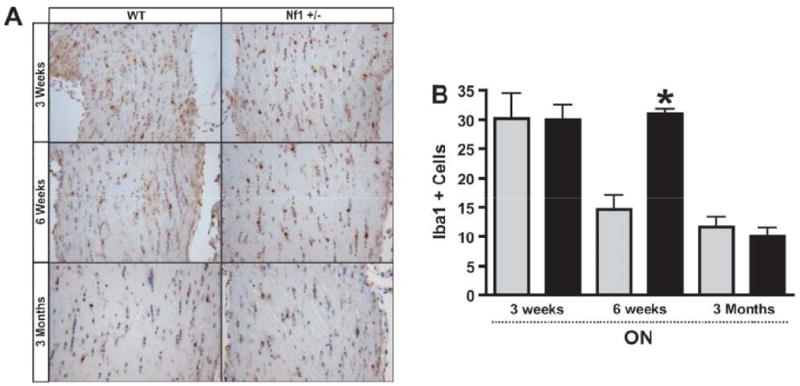
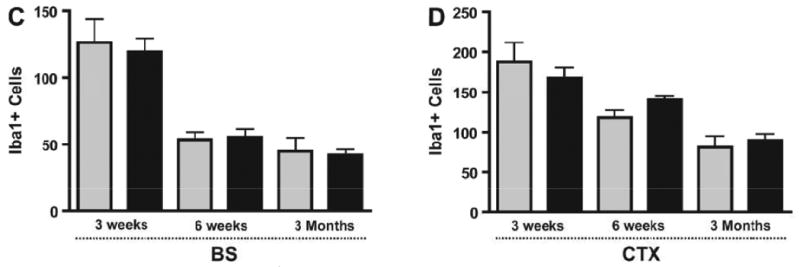
Iba1+ cells are increased in Nf1+/- optic nerve (ON) at 6 weeks of age, but not at 3 weeks or 3 months of age. (A, B) Equivalent numbers of Iba1-positive cells were found in the ON of Nf1+/- (n = 5) (black bars) and wild type (WT) (gray bars) mice (n = 5) at 3 weeks of age (p = 0.9712). By 6 weeks of age, there was a 2-fold increase in the number of Iba1-positive microglia in the ONs of Nf1+/- mice (n = 5) vs. WT littermates (n = 5) (p = 0.0002). By 3 months of age, Nf1+/- (n = 4) and WT (n = 4) mice had equivalent numbers of Iba1-postive cells (p = 0.5155). (C, D) Nf1+/- mice (n = 5) have similar numbers of Iba1-positive microglia in the brainstem (BS) and cortex (CTX) vs. WT (n = 5) at 3 weeks (BS, p = 0.7531) (CTX, p = 0.5248), 6 weeks (BS, p = 0.8260) (CTX, p = 0.0911) and 3 months of age (BS, p = 0.8138) (CTX, p = 0.6162).
To determine whether this effect of Nf1 heterozygosity on microglia number was also spatially regulated, we counted microglia in the brainstem and neocortex of the Nf1+/- and WT mice. In striking contrast to the temporal effects of Nf1 heterozygosity in optic nerves, no differences in brainstem or neocortex microglia numbers were observed at 3 weeks, 6 weeks or 3 months of age between Nf1+/- mice and their WT littermates (Fig. 5C, D). Thus, Nf1 heterozygosity results in both a temporal and spatial increase in microglia within the mouse optic nerve.
CX3CR1 expression is reduced in optic nerves of Nf1+/- mice
One of the key chemokines that regulates microglia dispersal in the brain is fractalkine or CX3CL1 (44, 45). CX3CL1 acts on its receptor, CX3CR1, to regulate microglia migration and function (46) and loss of CX3CR1 expression has been reported to lead to subretinal microglia cell accumulation (47). To determine whether altered CX3CL1/CX3CR1 expression could account for abnormal accumulation of microglia in the optic nerves of 6-week-old Nf1+/- mice, we first measured Cx3cl1 mRNA levels by quantitative PCR (qPCR) in Nf1+/- and WT optic nerves at different ages. No differences in Cx3cl1 expression were observed in Nf1+/- optic nerves relative to their WT counterparts at any time point (Fig. 6A). Next, we examined Cx3cr1 mRNA expression by qPCR using total RNA isolated from Nf1+/- and WT mice optic nerves at different ages. There was a trend increase towards increased Cx3cr1 mRNA expression at 3 weeks of age in Nf1+/- optic nerves (p = 0.0855), whereas there was a 2.5-fold decrease in Cx3cr1 mRNA in Nf1+/- compared to WT optic nerves at 6 weeks of age (Fig. 6B). By 3 months, Cx3cr1 mRNA expression in the Nf1+/- optic nerves was equivalent to that in the WT mice. Attempts to confirm these results at the protein level were unsuccessful due to the lack of suitable CX3CR1 antibodies for immunohistochemistry.
Figure 6.
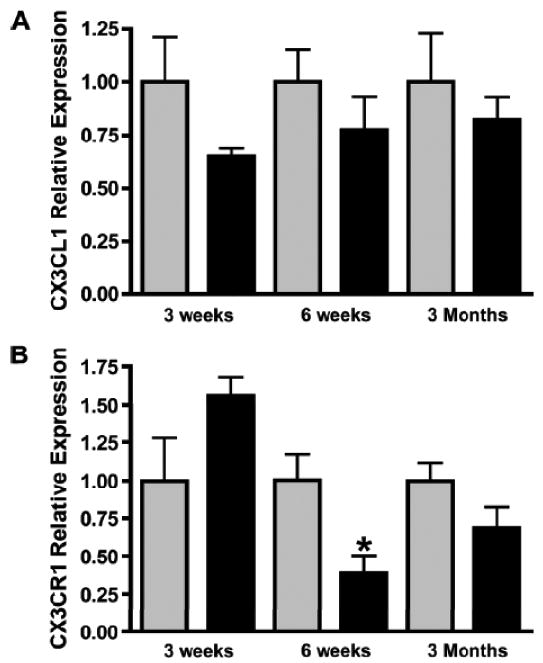
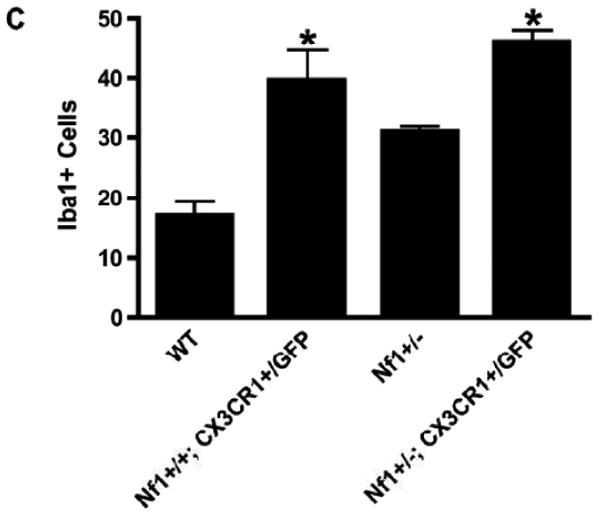
Reduced CX3CR1 expression in the Nf1+/- optic nerve (ON). (A) Real-time qPCR reveals no change in Cx3cl1 mRNA levels in ONs from Nf1+/- (n = 5) (black bars) and wild type (WT) (n = 5) (gray bars) mice at 3 weeks (p = 0.1558), 6 weeks (p = 0.3478), or 3 months (p = 0.4788) of age. (B) qPCR reveals a >2-fold decrease in Cx3cr1 mRNA expression in the ONs of 6-week-old Nf1+/- mice (n = 5) vs. WT controls (n = 5) (p = 0.0181). There is no difference in Cx3cr1 expression in the ONs from Nf1+/- vs. WT mice at 3 weeks (p = 0.0855) or 3 months (p = 0.1413) of age. (C) There is a 2-fold increase in numbers of Iba1-positive microglia in ONs of NF+/+Cx3cr1+/GFP mice (n = 6) vs. WT controls (n = 5) (p = 0.0042). Nf1+/+-Cx3cr1+/GFP mice (n = 7) have greater numbers of microglia vs. WT (p < 0.0001) and Nf1+/- mice (n = 5) (p < 0.0001).
To determine whether reduced CX3CR1 expression leads to increased microglia accumulation in the optic nerve as observed in Nf1+/- mice, we employed Cx3cr1+/GFP mice in which 1 copy of the Cx3cr1 gene was replaced with a cDNA encoding green fluorescent protein (GFP) (23). At 6 weeks of age there were 2-fold more Iba1-positive cells in the optic nerves of Cx3cr1+/GFP mice compared to WT controls (Fig. 6C). Similarly, there was an increase in the number of Iba1-positive cells in the optic nerves of Nf1+/-;Cx3cr1+/GFP mice compared to Nf1+/- controls at 6 weeks of age (p < 0.0001). Collectively, these results suggest that Nf1+/- microglia exhibit a delay in dispersal from the optic nerve related to reduced CX3CR1 expression, resulting in increased numbers of microglia at a critical time during optic glioma development.
Discussion
Gliomagenesis requires the combination of susceptible preneoplastic cells coupled with spatially- and temporally-restricted signals emanating from the tumor microenvironment. This cellular collaboration may account for the unique pattern of glioma formation within the CNS in children with NF1. With few exceptions, gliomas are predominantly located along the optic pathway and less frequently in the brainstem in young children. Based on this unique pattern of gliomagenesis, we previously showed that optic nerve and brainstem, but not neocortex, astrocytes increase their proliferation in response to Nf1 gene inactivation in vitro and in vivo (48). This region-specific susceptibility to the effects of neurofibromin loss provides a receptive preneoplastic cell type, which in cooperation with specific signals from the local environment facilitates gliomagenesis.
The requirement for key stromal signals is illustrated by studies of Nf1 GEM strains. In both peripheral and CNS tumors, Nf1 loss in Schwann cell or glial cell precursors, respectively, is not sufficient for tumor formation (5, 7). Neurofibromas or gliomas only form when Nf1 inactivation occurs in Schwann or glial cell precursors in Nf1+/- mice (5, 8, 49). The obligate role of Nf1+/- cells in the process of tumor formation and continued growth is further underscored by studies that identify mast cells (3, 4, 50) and microglia (20, 21) as important stromal cell types in neurofibroma and optic glioma development and maintenance, respectively. In the current study, we show that NF1-associated human pilocytic astrocytomas have increased numbers of microglia and use several Nf1 GEM strains to establish a pivotal role for resident microglia in both optic glioma development and maintenance.
First, we demonstrated that astrocytic tumors of all malignancy grades harbor increased percentages of Iba1-positive microglia vs. non-neoplastic brain. Previous studies have employed CD68 or Iba1 to identify microglia and found correlations between the malignancy grade and CD68/Iba1 immunopositivity (51, 52), but others have reported differences in microglia morphology (12) or proliferation (40) in gliomas of varying histologic grade. We observed a statistically insignificant trend towards increased CD68-positive cells in gliomas vs. non-neoplastic brain. We suspect that the difference between CD68 and Iba1 as microglia markers reflects the fact that CD68 recognizes other monocyte-like cells in addition to microglia and may also stain non-monocyte/macrophage lineage cells, especially under pathologic conditions (33, 35, 39). Indeed, we demonstrated that macrophages in an ischemic region in the human brain were strongly CD68-positive, whereas few cells in that pathological focus coincidentally labeled with Iba1. These data strongly suggest that Iba1 is a more selective marker for brain microglia (29, 30), but also highlight the need to identify additional specific markers for resident microglia.
We found that GCV-mediated reductions in microglia numbers were similar during tumor evolution (5-6 weeks of age) and in the established glioma (3 months of age). Using this method to attenuate microglia function, we provide definitive evidence for the role of microglia in glioma proliferation in established tumors and show for the first time their role in glioma proliferation during tumor formation. While this method of microglia ablation should target only CNS microglia, several independent experiments confirmed the identity of the CD11b+ cells. Using flow cytometry, we found that the normal optic nerve macrophage/monocyte population is primarily composed of CD11b+ CD45low cells, consistent with the profile of resident brain microglia (34, 53). Moreover, these microglia were CD68-positive (by flow cytometry) and Iba1-positive (by immunofluorescence and flow cytometry). Similar to our previous studies in human NF1-asspciated optic gliomas (20), the CD11b+ population in Nf1+/-GFAPCKO mouse optic gliomas was CD45low resident brain microglia. Together, these results support the conclusion that genetic elimination of resident microglia reduces optic glioma proliferation both during tumor formation and tumor maintenance.
Because of the limited reagents currently available to characterize brain microglia, it is possible that there are different populations of microglia in the optic nerve at 5-6 weeks of age and 3 months of age. In an analogous fashion, macrophages have been proposed to have varying functions relevant to tumorigenesis as a function of tumor evolution (54, 55). Early during tumor development, macrophages are active participants in eliminating tumor cells, but as the stroma and cancer cells co-evolve an “equilibrium” phase emerges in which the neoplastic cells acquire resistance to immune editing and elimination (56, 57). Finally, these “adapted” tumor cells expand and escape from immunologic pruning and create a new condition where macrophages may facilitate tumor growth. It is not clear whether these phases exist for microglia-glioma cell interactions, but if so it will be important to identify specific subpopulations of microglia with unique properties germane to a given period of glioma development and maintenance.
We also showed that Nf1 heterozygosity creates spatially- and temporally-restricted differences in microglia abundance relevant to optic glioma evolution. The fact that the numbers of Iba1-positive microglia increase in Nf1+/- mice in the optic nerve during a defined window of development suggests that this specific microglial population might be uniquely susceptible to the effects of reduced Nf1 expression during this period of optic nerve maturation. We hypothesize that the accumulation of Nf1+/- microglia in the optic nerve at 5 to 6 weeks of age reflects a defect in microglia homing in response to chemokines that instruct microglia dispersal. It is unlikely that Nf1+/- optic nerve microglia have impaired migratory abilities as we have previously shown that Nf1+/- microglia have increased motility in Boyden chamber assays in vitro (20, 21). Rather, we propose that Nf1+/- microglia are defective in directed migration.
One of the major determinants controlling microglia homing is CX3CR1 (58), which was reduced in the Nf1+/- optic nerve. Here, we showed that reduced Cx3cr1 expression in CX3CR1-GFP heterozygous knockout mice resulted in a similar increase in optic nerve microglia at 6 weeks of age. These results are consistent with previous reports demonstrating that _Cx3cr1_-deficient mice exhibit microglia accumulation in the retina (47, 59, 60). Together, these findings suggest a model in which microglia accumulation reflects the impact of Nf1 heterozygosity on the developmental pattern of microglia migration in the optic nerve, thus delaying microglia dispersal and resulting in the presence of microglia and microglia-produced signals during a time when _Nf1_-/- glial progenitors are most susceptible to expansion by stromal elements.
Previous studies have demonstrated the presence of CD11b-, Iba1-, CX3CR1-positive microglia in human gliomas, leading to the hypothesis that this cell population might be important for glioma growth (61). Moreover, polymorphisms in the human CX3CR1 gene are linked to increased survival of patients with high-grade glioma, and patients with the common “improved survival” V249I polymorphism also had reduced numbers of tumor-associated microglia (62). These findings raise the intriguing possibility that neurofibromin regulation of CX3CR1 expression might control microglia function in a specific fashion to modulate neoplastic glial cell growth in both the evolving and established optic glioma. Collectively, our new observations suggest a mechanistic model of stroma-tumor cell interaction relevant to optic gliomagenesis and maintenance that envisions Nf1 heterozygosity as an essential event that alters microglia abundance during optic nerve development. Future studies aimed at defining the function of microglia during gliomagenesis and glioma maintenance will be required to begin to develop treatments that target the relevant microenvironmental cell types in this common pediatric brain tumor.
Supplementary Material
Supp1
Supp2
Supp3
Acknowledgments
We thank Dr. Jean-Pierre Julien (Laval University) for the CD11b-TK mice used in these studies. We also thank Dr. Daniel Littman (New York University) for providing the CX3CR1-GFP mice. We thank the Alvin J. Siteman Cancer Center at Washington University School of Medicine and Barnes-Jewish Hospital in St. Louis, MO for the use of the High Speed Cell Sorter Core.
This work was funded in part by a grant from the National Cancer Institute (U01-CA141549-01) to D.H.G. The Bakewell Neuroimaging Core is supported in part by the Bakewell Family Foundation and the National Institutes of Health Neuroscience Blueprint Interdisciplinary Center Core P30 Grant (NS057105 to Washington University). The High Speed Cell Sorter Core is supported in part by a NCI Cancer Center Support Grant (P30 CA91842 to the Siteman Cancer Center).
References
- 1.Tlsty TD, Coussens LM. Tumor stroma and regulation of cancer development. Annu Rev Pathol. 2006;1:119–50. doi: 10.1146/annurev.pathol.1.110304.100224. [DOI] [PubMed] [Google Scholar]
- 2.Khalaf WF, Yang FC, Chen S, et al. K-ras is critical for modulating multiple c-kit-mediated cellular functions in wild-type and Nf1+/- mast cells. J Immunol. 2007;178:2527–34. doi: 10.4049/jimmunol.178.4.2527. [DOI] [PubMed] [Google Scholar]
- 3.Yang FC, Ingram DA, Chen S, et al. Neurofibromin-deficient Schwann cells secrete a potent migratory stimulus for Nf1+/- mast cells. J Clin Invest. 2003;112:1851–61. doi: 10.1172/JCI19195. [DOI] [PMC free article] [PubMed] [Google Scholar]
- 4.Yang FC, Chen S, Clegg T, et al. Nf1+/- mast cells induce neurofibroma like phenotypes through secreted TGF-beta signaling. Hum Mol Genet. 2006;15:2421–37. doi: 10.1093/hmg/ddl165. [DOI] [PMC free article] [PubMed] [Google Scholar]
- 5.Zhu Y, Ghosh P, Charnay P, et al. Neurofibromas in NF1: Schwann cell origin and role of tumor environment. Science. 2002;296:920–2. doi: 10.1126/science.1068452. [DOI] [PMC free article] [PubMed] [Google Scholar]
- 6.Listernick R, Darling C, Greenwald M, et al. Optic pathway tumors in children: the effect of neurofibromatosis type 1 on clinical manifestations and natural history. J Pediatr. 1995;127:718–22. doi: 10.1016/s0022-3476(95)70159-1. [DOI] [PubMed] [Google Scholar]
- 7.Bajenaru ML, Zhu Y, Hedrick NM, et al. Astrocyte-specific inactivation of the neurofibromatosis 1 gene (NF1) is insufficient for astrocytoma formation. Mol Cell Biol. 2002;22:5100–13. doi: 10.1128/MCB.22.14.5100-5113.2002. [DOI] [PMC free article] [PubMed] [Google Scholar]
- 8.Bajenaru ML, Hernandez MR, Perry A, et al. Optic nerve glioma in mice requires astrocyte Nf1 gene inactivation and Nf1 brain heterozygosity. Cancer Res. 2003;63:8573–7. [PubMed] [Google Scholar]
- 9.Bajenaru ML, Garbow JR, Perry A, et al. Natural history of neurofibromatosis 1-associated optic nerve glioma in mice. Ann Neurol. 2005;57:119–27. doi: 10.1002/ana.20337. [DOI] [PubMed] [Google Scholar]
- 10.Rossi ML, Hughes JT, Esiri MM, et al. Immunohistological study of mononuclear cell infiltrate in malignant gliomas. Acta Neuropathol. 1987;74:269–77. doi: 10.1007/BF00688191. [DOI] [PubMed] [Google Scholar]
- 11.Badie B, Schartner JM. Flow cytometric characterization of tumor-associated macrophages in experimental gliomas. Neurosurgery. 2000;46:957–61. doi: 10.1097/00006123-200004000-00035. discussion 61-2. [DOI] [PubMed] [Google Scholar]
- 12.Roggendorf W, Strupp S, Paulus W. Distribution and characterization of microglia/macrophages in human brain tumors. Acta Neuropathol. 1996;92:288–93. doi: 10.1007/s004010050520. [DOI] [PubMed] [Google Scholar]
- 13.Streit WJ, Conde JR, Fendrick SE, et al. Role of microglia in the central nervous system's immune response. Neurol Res. 2005;27:685–91. doi: 10.1179/016164105X49463a. [DOI] [PubMed] [Google Scholar]
- 14.Rio-Hortega Pd, Asua Fd. Sobre la fagocytosis en los tumores y en otros procesos patologicos. Arch Cardiol Hematol. 1921;2:161–220. [Google Scholar]
- 15.Zhang L, Alizadeh D, Van Handel M, et al. Stat3 inhibition activates tumor macrophages and abrogates glioma growth in mice. Glia. 2009;57:1458–67. doi: 10.1002/glia.20863. [DOI] [PubMed] [Google Scholar]
- 16.Mora R, Abschuetz A, Kees T, et al. TNF-alpha- and TRAIL-resistant glioma cells undergo autophagy-dependent cell death induced by activated microglia. Glia. 2009;57:561–81. doi: 10.1002/glia.20785. [DOI] [PubMed] [Google Scholar]
- 17.Frei K, Siepl C, Groscurth P, et al. Antigen presentation and tumor cytotoxicity by interferon-gamma-treated microglial cells. Eur J Immunol. 1987;17:1271–8. doi: 10.1002/eji.1830170909. [DOI] [PubMed] [Google Scholar]
- 18.Tran CT, Wolz P, Egensperger R, et al. Differential expression of MHC class II molecules by microglia and neoplastic astroglia: relevance for the escape of astrocytoma cells from immune surveillance. Neuropathol Appl Neurobiol. 1998;24:293–301. doi: 10.1046/j.1365-2990.1998.00120.x. [DOI] [PubMed] [Google Scholar]
- 19.Wagner S, Czub S, Greif M, et al. Microglial/macrophage expression of interleukin 10 in human glioblastomas. Int J Cancer. 1999;82:12–6. doi: 10.1002/(sici)1097-0215(19990702)82:1<12::aid-ijc3>3.0.co;2-o. [DOI] [PubMed] [Google Scholar]
- 20.Daginakatte GC, Gutmann DH. Neurofibromatosis-1 (Nf1) heterozygous brain microglia elaborate paracrine factors that promote Nf1-deficient astrocyte and glioma growth. Hum Mol Genet. 2007;16:1098–112. doi: 10.1093/hmg/ddm059. [DOI] [PubMed] [Google Scholar]
- 21.Daginakatte GC, Gianino SM, Zhao NW, et al. Increased c-Jun-NH2-kinase signaling in neurofibromatosis-1 heterozygous microglia drives microglia activation and promotes optic glioma proliferation. Cancer Res. 2008;68:10358–66. doi: 10.1158/0008-5472.CAN-08-2506. [DOI] [PubMed] [Google Scholar]
- 22.Gowing G, Vallieres L, Julien JP. Mouse model for ablation of proliferating microglia in acute CNS injuries. Glia. 2006;53:331–7. doi: 10.1002/glia.20288. [DOI] [PubMed] [Google Scholar]
- 23.Jung S, Aliberti J, Graemmel P, et al. Analysis of fractalkine receptor CX(3)CR1 function by targeted deletion and green fluorescent protein reporter gene insertion. Mol Cell Biol. 2000;20:4106–14. doi: 10.1128/mcb.20.11.4106-4114.2000. [DOI] [PMC free article] [PubMed] [Google Scholar]
- 24.Tibbetts KM, Emnett RJ, Gao F, et al. Histopathologic predictors of pilocytic astrocytoma event-free survival. Acta Neuropathol. 2009;117:657–65. doi: 10.1007/s00401-009-0506-3. [DOI] [PubMed] [Google Scholar]
- 25.Sharma MK, Watson MA, Lyman M, et al. Matrilin-2 expression distinguishes clinically relevant subsets of pilocytic astrocytoma. Neurology. 2006;66:127–30. doi: 10.1212/01.wnl.0000188667.66646.1c. [DOI] [PubMed] [Google Scholar]
- 26.Hegedus B, Banerjee D, Yeh TH, et al. Preclinical cancer therapy in a mouse model of neurofibromatosis-1 optic glioma. Cancer Res. 2008;68:1520–8. doi: 10.1158/0008-5472.CAN-07-5916. [DOI] [PubMed] [Google Scholar]
- 27.Cardona AE, Huang D, Sasse ME, et al. Isolation of murine microglial cells for RNA analysis or flow cytometry. Nat Protoc. 2006;1:1947–51. doi: 10.1038/nprot.2006.327. [DOI] [PubMed] [Google Scholar]
- 28.Baumgarth N, Roederer M. A practical approach to multicolor flow cytometry for immunophenotyping. J Immunol Methods. 2000;243:77–97. doi: 10.1016/s0022-1759(00)00229-5. [DOI] [PubMed] [Google Scholar]
- 29.Ahmed Z, Shaw G, Sharma VP, et al. Actin-binding proteins coronin-1a and IBA-1 are effective microglial markers for immunohistochemistry. J Histochem Cytochem. 2007;55:687–700. doi: 10.1369/jhc.6A7156.2007. [DOI] [PubMed] [Google Scholar]
- 30.Ito D, Imai Y, Ohsawa K, et al. Microglia-specific localisation of a novel calcium binding protein, Iba1. Brain Res Mol Brain Res. 1998;57:1–9. doi: 10.1016/s0169-328x(98)00040-0. [DOI] [PubMed] [Google Scholar]
- 31.Dick AD, Pell M, Brew BJ, et al. Direct ex vivo flow cytometric analysis of human microglial cell CD4 expression: examination of central nervous system biopsy specimens from HIV-seropositive patients and patients with other neurological disease. AIDS. 1997;11:1699–708. doi: 10.1097/00002030-199714000-00006. [DOI] [PubMed] [Google Scholar]
- 32.Sedgwick JD, Schwender S, Imrich H, et al. Isolation and direct characterization of resident microglial cells from the normal and inflamed central nervous system. Proc Natl Acad Sci U S A. 1991;88:7438–42. doi: 10.1073/pnas.88.16.7438. [DOI] [PMC free article] [PubMed] [Google Scholar]
- 33.Pulford KA, Sipos A, Cordell JL, et al. Distribution of the CD68 macrophage/myeloid associated antigen. Int Immunol. 1990;2:973–80. doi: 10.1093/intimm/2.10.973. [DOI] [PubMed] [Google Scholar]
- 34.Ford AL, Goodsall AL, Hickey WF, et al. Normal adult ramified microglia separated from other central nervous system macrophages by flow cytometric sorting. Phenotypic differences defined and direct ex vivo antigen presentation to myelin basic protein-reactive CD4+ T cells compared. J Immunol. 1995;154:4309–21. [PubMed] [Google Scholar]
- 35.Matsumoto H, Kumon Y, Watanabe H, et al. Antibodies to CD11b, CD68, and lectin label neutrophils rather than microglia in traumatic and ischemic brain lesions. J Neurosci Res. 2007;85:994–1009. doi: 10.1002/jnr.21198. [DOI] [PubMed] [Google Scholar]
- 36.Elghetany MT. Surface antigen changes during normal neutrophilic development: a critical review. Blood Cells Mol Dis. 2002;28:260–74. doi: 10.1006/bcmd.2002.0513. [DOI] [PubMed] [Google Scholar]
- 37.Eter N, Engel DR, Meyer L, et al. In vivo visualization of dendritic cells, macrophages, and microglial cells responding to laser-induced damage in the fundus of the eye. Invest Ophthalmol Vis Sci. 2008;49:3649–58. doi: 10.1167/iovs.07-1322. [DOI] [PubMed] [Google Scholar]
- 38.Reichmann G, Schroeter M, Jander S, et al. Dendritic cells and dendritic-like microglia in focal cortical ischemia of the mouse brain. J Neuroimmunol. 2002;129:125–32. doi: 10.1016/s0165-5728(02)00184-4. [DOI] [PubMed] [Google Scholar]
- 39.Kunisch E, Fuhrmann R, Roth A, et al. Macrophage specificity of three anti-CD68 monoclonal antibodies (KP1, EBM11, and PGM1) widely used for immunohistochemistry and flow cytometry. Ann Rheum Dis. 2004;63:774–84. doi: 10.1136/ard.2003.013029. [DOI] [PMC free article] [PubMed] [Google Scholar]
- 40.Klein R, Roggendorf W. Increased microglia proliferation separates pilocytic astrocytomas from diffuse astrocytomas: a double labeling study. Acta Neuropathol. 2001;101:245–8. doi: 10.1007/s004010000286. [DOI] [PubMed] [Google Scholar]
- 41.Kulla A, Liigant A, Piirsoo A, et al. Tenascin expression patterns and cells of monocyte lineag: relationship in human gliomas. Mod Pathol. 2000;13:56–67. doi: 10.1038/modpathol.3880010. [DOI] [PubMed] [Google Scholar]
- 42.Morimura T, Neuchrist C, Kitz K, et al. Monocyte subpopulations in human gliomas: expression of Fc and complement receptors and correlation with tumor proliferation. Acta Neuropathol. 1990;80:287–94. doi: 10.1007/BF00294647. [DOI] [PubMed] [Google Scholar]
- 43.Hegedus B, Hughes FW, Garbow JR, et al. Optic nerve dysfunction in a mouse model of neurofibromatosis-1 optic glioma. J Neuropathol Exp Neurol. 2009;68:542–51. doi: 10.1097/NEN.0b013e3181a3240b. [DOI] [PMC free article] [PubMed] [Google Scholar]
- 44.Tanabe S, Heesen M, Yoshizawa I, et al. Functional expression of the CXC-chemokine receptor-4/fusin on mouse microglial cells and astrocytes. J Immunol. 1997;159:905–11. [PubMed] [Google Scholar]
- 45.Lauro C, Catalano M, Trettel F, et al. The chemokine CX3CL1 reduces migration and increases adhesion of neurons with mechanisms dependent on the beta1 integrin subunit. J Immunol. 2006;177:7599–606. doi: 10.4049/jimmunol.177.11.7599. [DOI] [PubMed] [Google Scholar]
- 46.Sunnemark D, Eltayeb S, Nilsson M, et al. CX3CL1 (fractalkine) and CX3CR1 expression in myelin oligodendrocyte glycoprotein-induced experimental autoimmune encephalomyelitis: kinetics and cellular origin. J Neuroinflammation. 2005;2:17. doi: 10.1186/1742-2094-2-17. [DOI] [PMC free article] [PubMed] [Google Scholar]
- 47.Combadiere C, Feumi C, Raoul W, et al. CX3CR1-dependent subretinal microglia cell accumulation is associated with cardinal features of age-related macular degeneration. J Clin Invest. 2007;117:2920–8. doi: 10.1172/JCI31692. [DOI] [PMC free article] [PubMed] [Google Scholar]
- 48.Yeh TH, Lee DY, Gianino SM, et al. Microarray analyses reveal regional astrocyte heterogeneity with implications for neurofibromatosis type 1 (NF1)-regulated glial proliferation. Glia. 2009;57:1239–49. doi: 10.1002/glia.20845. [DOI] [PMC free article] [PubMed] [Google Scholar]
- 49.Zhu Y, Harada T, Liu L, et al. Inactivation of NF1 in CNS causes increased glial progenitor proliferation and optic glioma formation. Development. 2005;132:5577–88. doi: 10.1242/dev.02162. [DOI] [PMC free article] [PubMed] [Google Scholar]
- 50.Yang FC, Ingram DA, Chen S, et al. Nf1-dependent tumors require a microenvironment containing Nf1+/-- and c-kit-dependent bone marrow. Cell. 2008;135:437–48. doi: 10.1016/j.cell.2008.08.041. [DOI] [PMC free article] [PubMed] [Google Scholar]
- 51.Strojnik T, Kavalar R, Zajc I, et al. Prognostic impact of CD68 and kallikrein 6 in human glioma. Anticancer Res. 2009;29:3269–79. [PubMed] [Google Scholar]
- 52.Deininger MH, Seid K, Engel S, et al. Allograft inflammatory factor-1 defines a distinct subset of infiltrating macrophages/microglial cells in rat and human gliomas. Acta Neuropathol. 2000;100:673–80. doi: 10.1007/s004010000233. [DOI] [PubMed] [Google Scholar]
- 53.Sedgwick JD, Hughes CC, Male DK, et al. Antigen-specific damage to brain vascular endothelial cells mediated by encephalitogenic and nonencephalitogenic CD4+ T cell lines in vitro. J Immunol. 1990;145:2474–81. [PubMed] [Google Scholar]
- 54.Smyth MJ, Dunn GP, Schreiber RD. Cancer immunosurveillance and immunoediting: the roles of immunity in suppressing tumor development and shaping tumor immunogenicity. Adv Immunol. 2006;90:1–50. doi: 10.1016/S0065-2776(06)90001-7. [DOI] [PubMed] [Google Scholar]
- 55.Bui JD, Schreiber RD. Cancer immunosurveillance, immunoediting and inflammation: independent or interdependent processes? Curr Opin Immunol. 2007;19:203–8. doi: 10.1016/j.coi.2007.02.001. [DOI] [PubMed] [Google Scholar]
- 56.Uhr JW, Scheuermann RH, Street NE, et al. Cancer dormancy: opportunities for new therapeutic approaches. Nat Med. 1997;3:505–9. doi: 10.1038/nm0597-505. [DOI] [PubMed] [Google Scholar]
- 57.Wheelock EF, Weinhold KJ, Levich J. The tumor dormant state. Adv Cancer Res. 1981;34:107–40. doi: 10.1016/s0065-230x(08)60240-7. [DOI] [PubMed] [Google Scholar]
- 58.Zhu J, Zhou Z, Liu Y, et al. Fractalkine and CX3CR1 are involved in the migration of intravenously grafted human bone marrow stromal cells toward ischemic brain lesion in rats. Brain Res. 2009;1287:173–83. doi: 10.1016/j.brainres.2009.06.068. [DOI] [PubMed] [Google Scholar]
- 59.Liang KJ, Lee JE, Wang YD, et al. Regulation of dynamic behavior of retinal microglia by CX3CR1 signaling. Invest Ophthalmol Vis Sci. 2009;50:4444–51. doi: 10.1167/iovs.08-3357. [DOI] [PMC free article] [PubMed] [Google Scholar]
- 60.Raoul W, Keller N, Rodero M, et al. Role of the chemokine receptor CX3CR1 in the mobilization of phagocytic retinal microglial cells. J Neuroimmunol. 2008;198:56–61. doi: 10.1016/j.jneuroim.2008.04.014. [DOI] [PubMed] [Google Scholar]
- 61.Held-Feindt J, Hattermann K, Muerkoster SS, et al. CX3CR1 promotes recruitment of human glioma-infiltrating microglia/macrophages (GIMs) Exp Cell Res. 316:1553–66. doi: 10.1016/j.yexcr.2010.02.018. [DOI] [PubMed] [Google Scholar]
- 62.Rodero M, Marie Y, Coudert M, et al. Polymorphism in the microglial cell-mobilizing CX3CR1 gene is associated with survival in patients with glioblastoma. J Clin Oncol. 2008;26:5957–64. doi: 10.1200/JCO.2008.17.2833. [DOI] [PubMed] [Google Scholar]
Associated Data
This section collects any data citations, data availability statements, or supplementary materials included in this article.
Supplementary Materials
Supp1
Supp2
Supp3