Globin gene activation during haemopoiesis is driven by protein complexes nucleated by GATA-1 and GATA-2 (original) (raw)
Abstract
How does an emerging transcriptional programme regulate individual genes as stem cells undergo lineage commitment, differentiation and maturation? To answer this, we have analysed the dynamic protein/DNA interactions across 130 kb of chromatin containing the mouse α-globin cluster in cells representing all stages of differentiation from stem cells to mature erythroblasts. The α-gene cluster appears to be inert in pluripotent cells, but priming of expression begins in multipotent haemopoietic progenitors via GATA-2. In committed erythroid progenitors, GATA-2 is replaced by GATA-1 and binding is extended to additional sites including the α-globin promoters. Both GATA-1 and GATA-2 nucleate the binding of various protein complexes including SCL/LMO2/E2A/Ldb-1 and NF-E2. Changes in protein/DNA binding are accompanied by sequential alterations in long-range histone acetylation and methylation. The recruitment of polymerase II, which ultimately leads to a rapid increase in α-globin transcription, occurs late in maturation. These studies provide detailed evidence for the more general hypothesis that commitment and differentiation are primarily driven by the sequential appearance of key transcriptional factors, which bind chromatin at specific, high-affinity sites.
Keywords: α globin, chromatin immunoprecipitation, haemopoiesis, histone modification, transcription factor binding
Introduction
The process by which multipotent stem cells undergo lineage specification and differentiation to produce their highly specialised progeny is poorly understood. Transcriptional profiling of stem cells and the analysis of selected genes in single cells known to have multiple potential have led to the concept that such cells are ‘primed' to express the transcriptional programmes of many different lineages (Jimenez et al, 1992; Hu et al, 1997). Commitment and differentiation involve both consolidating expression of the chosen subset of lineage-affiliated genes and repressing the other primed programmes that are not part of the lineage in question: so-called multilineage priming. This term describes the global changes in transcription programmes, but the specific mechanisms underlying commitment and differentiation have not yet been fully explored. Therefore, to take this hypothesis forward, it is necessary to determine how an individual gene is switched on or off as multipotent cells differentiate into increasingly more specialised cells.
Haemopoiesis provides an accessible mammalian system to address this question. Haemopoietic stem cells (HSCs) are self-renewing cells supporting the production of at least eight lineages of specialised, functionally and morphologically distinct blood cells (Cantor and Orkin, 2002). The phenomenon of multilineage priming has been most clearly demonstrated in haemopoiesis (Jimenez et al, 1992; Hu et al, 1997). The specific cellular pathway committing progenitors to form red blood cells (erythropoiesis) is well defined and ultimately results in highly specialised precursors (erythroblasts), which, in the later stages of differentiation, express almost exclusively the α- and β-like globin genes to synthesise haemoglobin (Steinberg et al, 2001). Therefore, the globin genes, which are silent in early haemopoietic progenitors and expressed at high levels during terminal erythroid differentiation, provide ideal candidates for understanding the principles by which individual genes are activated during lineage commitment and differentiation.
The structure of the α-globin gene cluster has been highly conserved throughout 500 million years of evolution, and a region (135–155 kb of the human sequence) of conserved synteny containing the entire α cluster, its regulatory elements and several widely expressed genes lying upstream is present in 22 species analysed (Flint et al, 2001; Hughes, in preparation). The process of erythropoiesis is well defined in the mouse; primary haemopoietic cells are accessible and several murine cell lines that faithfully represent different stages of haemopoiesis are available (Figure 1). We therefore chose to study the mouse α-globin gene cluster, which includes an embryonic gene (ζ) and a duplicated set of three α-like genes 5′-ζ-ψα2-ψα-α1-θ-ψα-α2-θ-3′ (Figure 2) (Flint et al, 2001). To understand fully how mammalian genes are regulated in their natural chromosomal environment during erythropoiesis, we ultimately need to identify all key regulatory elements, the factors and cofactors that bind to them in vivo, how the assembled nucleoprotein complexes interact and the epigenetic events that develop as the genes are activated or repressed. Many aspects of gene regulation have been extensively analysed in the globin gene system revealing a common repertoire of cis elements and _trans_-acting factors controlling α- and β-globin gene expression. By contrast, the epigenetic modifications that develop at the α and β clusters during haemopoiesis are surprisingly different, suggesting that despite their common evolutionary origins, the extant α and β clusters lie in quite different chromosomal environments (Higgs et al, 1998).
Figure 1.
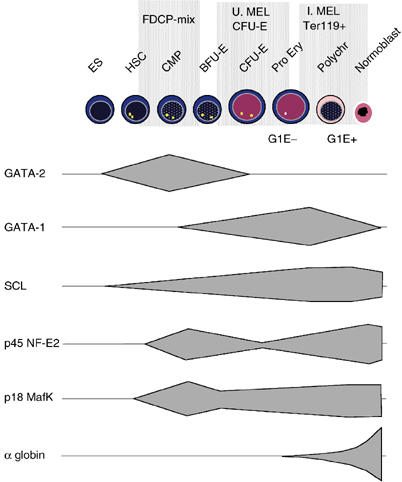
Expression of key transcription factors during erythropoiesis. Data were obtained from previously reported protein and mRNA analyses and observations reported in this study (see Supplementary data). ES, embryonic stem cell; HSC, haemopoietic stem cell; Pro Ery, proerythroblast; Polychr, polychromatic erythroblast; U. MEL, uninduced MEL cells; I. MEL, induced MEL cells; G1E−, G1E GATA-1-ER before estradiol treatment; G1E+, G1E GATA-1-ER after estradiol treatment. Although G1E cells were considered to be proerythroblasts recent data (Welch et al, submitted) suggests that they have some characteristics of BFU-E.
Figure 2.
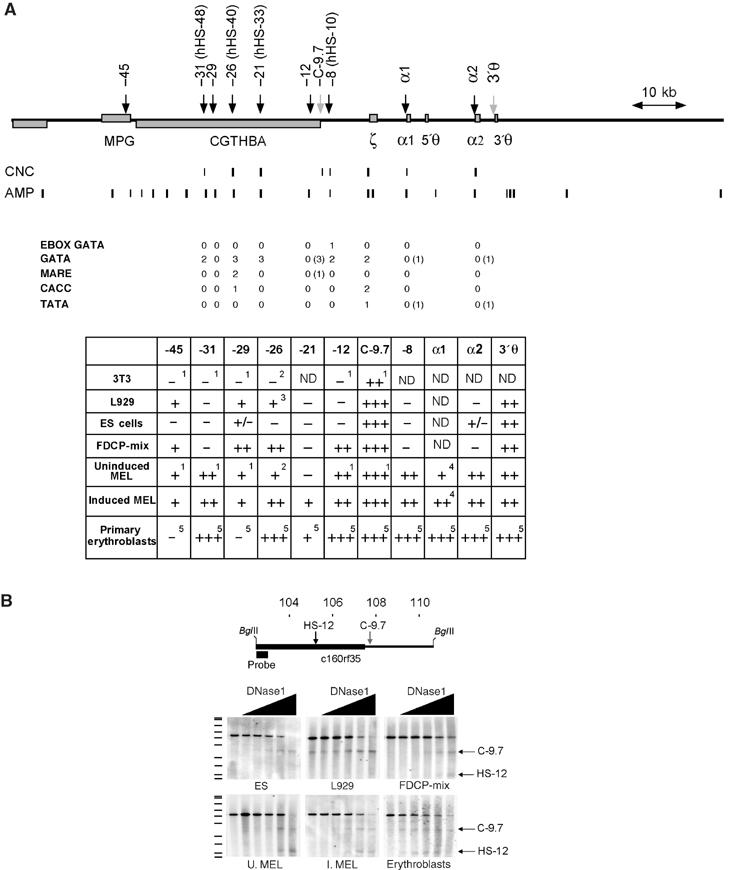
Erythroid-specific DNase1 HSs at the α-globin domain are mostly found at noncoding sequences that contain conserved transcription factor binding sites. (A) The mouse α-globin locus: erythroid-specific HSs (black arrows) and constitutive HSs C-9.7 and 3′θ (grey arrows) are shown. Coordinates relative to the ζ globin gene are indicated above the arrows. Coordinates of the human homologues are shown in parentheses. CNC, conserved noncoding sequences (Hughes et al, in preparation); AMP, amplicons used in real-time PCR. Below: The number of sequences for key transcription factor binding sites that are conserved throughout evolution are shown. Potential binding sites present only in mouse are shown in parentheses. The table summarises the results from DNase1 analysis in non-erythroid (L929 and 3T3, fibroblast cell lines) and erythroid cells (see text). 1Kielman et al (1996) and this study; 2Kielman et al (1994) and this study; 3+/− RAG cells, Gourdon et al (1995); 4Sheffery et al (1984); 5Anguita et al (2002). (B) HS mapping exemplifying the dynamics of erythroid-specific DNase1 HSs during erythropoiesis. Above: The area analysed in this experiment, showing _Bgl_II sites and the probe used. This fragment includes a constitutive DNase1 HS (C-9.7) associated with the promoter of the gene c16orf35 (CGTHBA), and the erythroid-specific site HS-12. Increasing concentrations of DNase1 (black triangles) demonstrate C-9.7 in all cell types. HS-12 can only be seen in FDCP-mix, MEL cells and primary erythroblasts. A faint band corresponding to C-9.7 is seen in L929 cells without added DNase1, probably due to endogenous nuclease activity. On the left of the autoradiograph is an 35S-labelled DNA marker (Amersham, Pharmacia Biotech, UK). U. MEL, uninduced MEL cells; I. MEL, induced MEL cells.
Most previous studies of mammalian globin gene expression have concentrated on fully committed erythroid cells. However, to further our understanding of how the globin genes are activated during erythropoiesis, we need to establish the hierarchy and order of events as commitment and differentiation proceed. Here we have used chromatin immunoprecipitation (ChIP) to analyse the pattern of transcription factor binding and the associated changes in chromatin across a region of ∼130 kb including the entire mouse α-globin domain in cells representing different stages of the pathway from pluripotent cells to mature erythroblasts.
These studies thus define in detail the steps involved in the sequential activation of the α-globin genes during lineage commitment and differentiation, and provide a paradigm for the mechanism by which other mammalian genes may be similarly regulated.
Results
Primary cells and cell lines representing key stages of erythropoiesis
The cellular basis of erythropoiesis has been well defined (Steinberg et al, 2001; Cantor and Orkin, 2002) (Figure 1). Primary cells from the early stages of haemopoiesis are generally too rare for standard genetic and epigenetic analyses and, even when purified, are inevitably heterogeneous. On the other hand, haemopoietic cell lines, although homogeneous, may not faithfully reflect all aspects of the corresponding cell in vivo. Therefore, where possible we have included analyses of both primary cells and representative cell lines (Figure 1).
As a source of pluripotent mouse cells, we analysed embryonic stem cells (ES, line E14Tg2a), which we have shown to retain erythroid capability in vitro as well as contributing to all mouse tissues in vivo (Anguita et al, 2002).
For multipotent haemopoietic progenitors, we studied factor-dependent cell Paterson (FDCP)-mix cells (subline A4), which were originally derived from long-term cultures of mouse bone marrow. These cells appear normal in that they do not have any karyotypic abnormalities and are not leukaemogenic in vivo. In early passage, they form CFU-S and are radioprotective when transplanted into irradiated animals. They can be maintained as self-renewing, undifferentiated blast-like cells in the presence of IL-3 and are thought to most closely resemble the common myeloid progenitor cell (CMP) (Spooncer et al, 1986). Clonal analysis of the FDCP-mix cells used in this study showed that, as previously described, they maintained the ability to differentiate with equal efficiency along neutrophil, erythroid and megakaryocytic lineages (data not shown).
Erythroid colony forming units (CFU-E) are fully committed erythroid progenitors (Figure 1), which can be readily isolated from anaemic spleen cells by FACS sorting CD71+ and Ter119− cells. Primary, purified CFU-E (∼1 × 10⁷ from 2–3 phenylhydrazine-treated mice) were isolated and aliquots formed small erythroid colonies with high efficiency (>80%) in methylcellulose (data not shown). In addition, we analysed uninduced mouse erythroleukaemia cells (MEL), which are well-characterised, transformed erythroid cells that are blocked at the CFU-E or early pronormoblast stage of differentiation (Marks et al, 1987).
Induction of MEL cells by a variety of agents produced terminally differentiated, but still nucleated, erythroid cells. In addition, large numbers of primary erythroblasts were isolated from the spleens of phenylhydrazine-treated mice by selection of Ter119-positive cells (Spivak et al, 1973).
L929, a fibroblast cell line, was used as a source of differentiated murine non-erythroid cells.
Appearance of DNase1 HSs during lineage commitment and differentiation
Previous characterisation of evolutionarily conserved noncoding sequences (Flint et al, 2001), localisation of erythroid-restricted DNase1 hypersensitive sites (HSs) (Sheffery et al, 1984; Kielman et al, 1994; 1996; Anguita et al, 2002) together with functional studies (Gourdon et al, 1995; Bouhassira et al, 1997; Anguita et al, 2002; Loyd et al, 2003) have identified several potentially important regulatory elements in the mouse α-globin cluster (Figure 2). Since the analysis of DNase1 HSs represents a simple way of identifying changes in chromatin associated with the binding of transcription factors and/or chromatin-modifying factors in vivo, we evaluated such sites in the panel of cell lines and primary cells representing different stages of haemopoietic lineage commitment and differentiation (Figures 1 and 2A).
In pluripotent ES cells, two constitutive sites (C-9.7 and 3′θ; Kielman et al, 1996) within the α-globin cluster were clearly present (Figure 2A and B). All the haemopoietic HSs were either absent or weak.
Analysis of FDCP-mix cells, which correspond to early multipotent haemopoietic progenitors, demonstrated four HSs (HS-45, -29, -26 and -12) that have been associated with haemopoietic cells. Other regions containing putative regulatory elements, including the α-globin promoters, remained insensitive to DNase1.
In uninduced MEL cells, additional HSs (HS-31, -8 and α-gene promoters) corresponding to putative regulatory elements were seen. After induction, the pattern of HSs in MEL cells changed very little although one new site (HS-21) appeared. A similar pattern to that seen in induced MEL cells was seen in primary erythroblasts although sites at -45 and -29 were not readily detected.
Gene expression in the selected cells and cell lines
The presence of DNase1 HSs frequently corresponds to the binding of transcription factors. Detailed analysis of the evolutionarily conserved transcription factor binding sites in these hypersensitive regions (Figure 2; Hughes et al, in preparation) has demonstrated combinations of GATA (Ko and Engel, 1993; Merika and Orkin, 1993), MARE (Maf Recognition Element, Andrews et al, 1993a), CACC box (Hartzog and Myers, 1993), E box (Murre et al, 1989) and as yet unidentified factor binding sites (Figure 2). Therefore, we examined expression of these factors in cells representing the different stages of differentiation.
The changes in timing and levels of expression of the key transcription factors are summarised in Figure 1 and Supplementary data. Representative experiments are shown in Figure 3.
Figure 3.
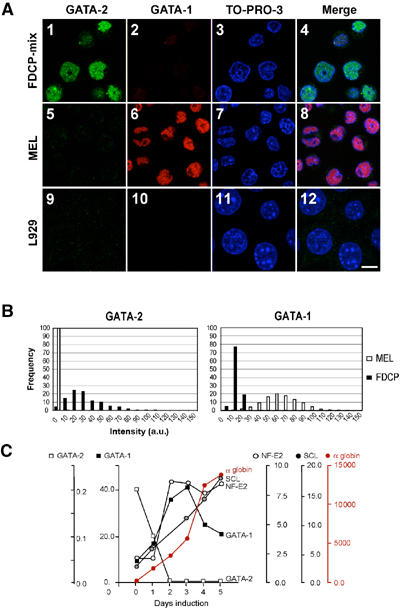
Changes in transcription factor expression during erythroid differentiation. (A) Immunofluorescence, illustrating the switch from GATA-2 (green) to GATA-1 (red) expression. (1–4) FDCP-mix cells express high levels of GATA-2 and low levels of GATA-1; (5–8) noninduced MEL cells show intense positivity for GATA-1; (9–12) L929 fibroblast cell line. The white bar represents ∼10 μm. (B) Quantification of immunofluorescence. Left: The relative intensity of GATA-2 staining in FDCP-mix (black bars) compared to uninduced MEL cells (white bars); the _y_-axis represents the proportion of cells (%) in each category. L929 nuclear fluorescence was subtracted as background. a.u., arbitrary units. Right: Fluorescence quantification of GATA-1. These experiments show that almost all FDCP-mix cells express both GATA transcription factors. Most cells express more GATA-2 than GATA-1, but there is considerable variability. A small number of cells are strongly positive for GATA-1, and these have a weaker GATA-2 staining and could represent cells that have started to differentiate along the erythroid lineage. (C) mRNA analysis by nuclease protection assay of the key erythroid transcription factors and α globin throughout MEL cell differentiation.
The pattern of histone modification during commitment and differentiation
Histone acetylation is a major modification of chromatin, which increases the accessibility of nucleosomal DNA, through structural transitions at the level of the nucleosome (Vettese-Dadey et al, 1996), and also by influencing higher order chromatin structure (Tse et al, 1998). We previously determined the pattern of histone acetylation across the entire α-globin locus in human, mouse and chicken, demonstrating a well-delimited domain of highly acetylated chromatin encompassing the α genes and their regulatory elements in the corresponding region of conserved synteny in all three species (Anguita et al, 2001). Here we have extended our original study by performing ChIP analysis at higher resolution, with greater sensitivity and considering a wider range of chromatin modifications: acetylated histone H4 (Ac-H4), acetylated histone H3 (Ac-H3) and histone H3 dimethylated at lysine 4 (H3-diMeK4), followed throughout erythropoiesis.
As before, we found a uniform, low level of acetylation, greater than in heterochromatin, across the entire α-globin cluster in non-erythroid cells (Supplementary Figure 3). We found a similar pattern in pluripotent ES cells. The previously characterised, broad, erythroid-specific domain of histone acetylation (H3 and H4) first appears in multipotent haemopoietic cells, where it initiates far upstream of the α cluster (HS-29). The domain of acetylation extends during differentiation to become fully developed in mature erythroblasts (induced MEL cells and erythroblasts; Figure 4). A similar pattern was seen for H3-diMeK4-modified chromatin (Figure 4). In particular, we noted that the overall level of histone acetylation and H3-diMeK4 methylation increases and extends between early committed erythroid precursors (CFU-E) and late, mature (Ter119-selected) erythroblasts.
Figure 4.
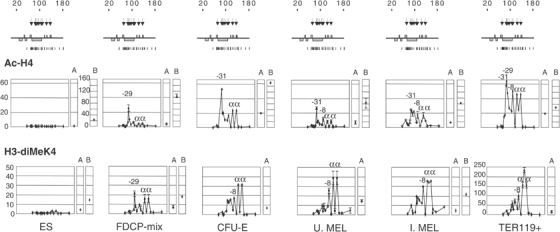
Histone modifications at the α-globin domain change during haemopoiesis. Above: Schematic representation of the α-globin locus as in Figure 2A, including erythroid-specific HSs (arrows) and real-time PCR amplicons (vertical lines). Below: Real-time PCR analysis of ChIP with antibodies against Ac-H4 and diMeK4. The _y_-axis represents enrichment over the GAPDH locus. The _x_-axis represents the coordinates at the α-globin locus. A, control sequence at HS2 of the β-globin LCR; B, control at the β-actin CpG island. The results from the different cells analysed are shown in the order of differentiation from left to right. Elements corresponding to the highest peaks of enrichment are indicated. Error bars correspond to ±1 s.d. from two independent ChIPs. Note the different scale for Ac-H4 β-actin control.
The broad domain of acetylation was punctuated by several distinct peaks of acetylation and H3-diMeK4-modified histones, which closely reflect the patterns of HSs seen in corresponding cell types. In multipotent cells, H3 and H4 histone acetylation was predominantly seen at HS-29, a region containing no known erythroid-specific binding sites (Figures 2 and 4 and Supplementary 1). Somewhat lower levels of modification were detected at HS-31, -26, -12 and the α-globin promoters. Peaks of H3-diMeK4 modification were also seen in these cells but those at the α promoters were relatively more prominent.
At the next stage of erythropoiesis, the peak at HS-29 substantially decreased and now the highest peak of H3 and H4 acetylation in uninduced MEL cells and CFU-E occurred at HS-31 (Figure 4), which contains two evolutionarily conserved GATA binding sites. This was reflected by a change in the patterns of HSs in these cells (Figure 2). Less prominent peaks of acetylation were also seen at HS-29, -26, -8 and the α-globin promoters. No peak of H3-diMeK4 was seen at HS-31, but this modification was prominent at HS-8 and the α-globin promoters. In terminally differentiating erythroblasts, all of the corresponding peaks of acetylation and diMeK4 became further enriched and a newly modified region between α genes appeared. At all stages of erythropoiesis, the patterns of H3 and H4 acetylation appeared quite similar to each other (Supplementary Figure 1).
Role of GATA-1 and GATA-2
Nearly all of the putative regulatory elements associated with HSs and peaks of histone acetylation contain conserved GATA motifs (Figure 2). Such sequences have been found in the regulatory elements of virtually all erythroid genes and therefore it seemed likely that the two haemopoietic, zinc-finger DNA binding proteins GATA-2 and GATA-1 would bind to these elements in vivo (Orkin, 1992). GATA-2 is thought to be necessary for expansion and survival of early haemopoietic progenitors (Tsai et al, 1994) while inhibiting differentiation. By contrast, GATA-1 appears to exert a positive effect on both commitment and maturation of the erythroid lineage (Pevny et al, 1991).
We evaluated the binding of GATA-1 and GATA-2 in vivo using ChIP and the same set of amplicons (Figure 2) used to assess the histone modifications described above. In ES cells, neither GATA-1 nor GATA-2 bound the α-globin cluster. However, in FDCP-mix, in which GATA-2 is first expressed (Figure 3A), it bound specifically at HS-26 and -12 (Figure 5), concurrent with the appearance of HSs and the small peaks of H4 acetylation and dimethylation of H3-K4. After commitment (CFU-E and MEL cells), GATA-2 was no longer expressed and was replaced at the α cluster by GATA-1.
Figure 5.
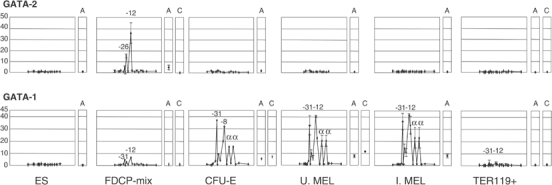
GATA-1 and GATA-2 bind to specific elements in the α-globin locus according to their expression pattern. Plots follow Figure 4. Above: GATA-2 binds only in FDCP-mix. Below: GATA-1 replaces GATA-2 as differentiation proceeds and binds most HSs, including the α-globin promoters. In late erythroblasts, no GATA binding is detected. A, HS2 of the β LCR; C, −2.8 region of the GATA-2 locus (Grass et al, 2003). Error bars represent ±1 s.d. from two independent ChIPs.
Very low levels of GATA-1 binding (HS-31, -26 and -12) were detected in FDCP-mix cells and this could be explained by the small proportion of differentiated cells discussed in Figure 3. However, in fully committed early erythroid progenitors (uninduced MEL cells and CFU-E), in which GATA-1 levels are high but the α genes are not transcribed, all conserved elements containing GATA-1 sites (HS-31, -26, -21, -12, -8 and the α promoters) were bound in vivo. This pattern of GATA-1 binding appeared almost identical in induced MEL cells that have begun to make α-globin mRNA, suggesting that there are no readily detectable changes in GATA-1 binding associated with induction of globin synthesis. However, in more mature erythroblasts (Ter119-selected cells), GATA-1 binding was no longer detected.
Therefore, it appears that GATA factors play a key role, by binding to a very restricted set of highly conserved sites, in priming and initiating activation of the chromatin containing the α-globin cluster.
Binding of GATA-1 is influenced by friend of GATA (FOG-1)
The N-terminal fingers of GATA factors contact a coregulator called friend of GATA (FOG-1), which does not appear to bind DNA directly (Tsang et al, 1997). Mutations that abolish or downregulate FOG-1 expression perturb erythropoiesis in a very similar, albeit less severe, way to GATA-1 mutations (Tsang et al, 1998). It was recently shown that FOG-1 can bind at least one region of chromatin in the mouse α-globin cluster (HS-26) (Pal et al, 2004).
To detect binding of FOG-1, it was necessary to decrease the extent of sonication (shearing to <1.5 kb) and adjust the crosslinking (1% formaldehyde for 15 min at room temperature). Under these new conditions, FOG-1 binding could now be detected at all sites where GATA-1 was found (Figure 6A1). The pattern of SCL binding using these conditions appeared identical to that seen using the previously established protocol (Figure 6A2).
Figure 6.
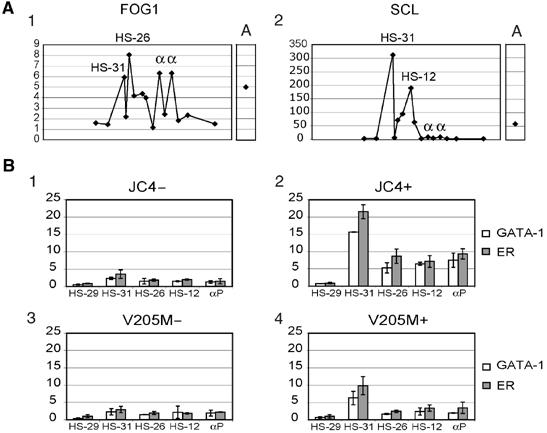
GATA-1 requires FOG-1 interaction for adequate DNA binding and/or recruitment to the α-globin locus. (A) (1) The pattern of FOG-1 binding to the α-globin cluster in U. MEL cells using newly established conditions for ChIP analysis. (2) As a control, SCL binding was analysed under the same conditions (compare with previously established conditions in Figure 7). A, HS2 of the β LCR. (B) GATA-1 ChIPs were analysed at GATA-1 binding sites (HS-31, -26, -12 and α-globin promoters) and at a site where GATA-1 does not bind (HS-29). ChIP analysis using anti-GATA-1 or anti-ER antibodies was performed with cells expressing wild-type GATA-1-ER (JC4) before (1) and after (2) estradiol induction, and in the V205M GATA-1-ER mutant, defective for FOG-1 binding, without (3) or with (4) estradiol treatment. The error bars represent ±1 s.d. from two independent ChIPs. αP, α-globin promoters.
We also analysed a GATA-1-deficient mouse erythroblast cell line (G1E) stably expressing either GATA-1 fused to the ligand binding domain of the oestrogen receptor (GATA-1-ER cells) or GATA-1 (V205M)-ER cells in which the FOG-1/GATA-1 interaction is impaired due to a mutation (V205M) in the N-terminal finger of GATA-1 (Nichols et al, 2000). The V205M mutation does not affect DNA binding of GATA-1.
In GATA-1-ER cells, induction of the fusion protein with estradiol increased binding (∼4–7-fold) of GATA-1-ER to sites at which we had previously demonstrated GATA-1 binding in committed erythroid cells in vivo (-31, -26, -12 and the α-globin promoters) but not to HS-29, which does not naturally bind GATA-1. By contrast, binding of GATA-1 in GATA-1 (V205M)-ER cells was significantly reduced at all sites (Figure 6), even though both cell lines express equal amounts of GATA-1 protein, presumably as a result of the impaired interaction between GATA-1 and FOG-1 in these cells. It is interesting that whereas GATA-1 replaces GATA-2 at HS-26 and -12, no prior binding of GATA-2 occurred at HS-31 or the α-globin promoters. Taken together, these data demonstrate that FOG-1 directly facilitates GATA-1 binding or recruitment to various degrees (Letting et al, 2004) at all sites studied and is not restricted to sites at which GATA-1 is exchanged for GATA-2 as observed for the elements studied by Pal et al (2004).
Recruitment of the GATA/SCL/E2A/LMO2/Ldb-1 erythroid holocomplex
SCL is predominantly, but not exclusively, expressed in haemopoietic cells where it clearly plays a fundamental role in forming complexes with other transcription factors. The best characterised of these is a pentameric complex containing SCL, E2A, Lim-only 2 (LMO2) and LIM domain binding protein 1 (Ldb-1) tethered to DNA via GATA-1, GATA-2 or SCL/E2A, either alone or in combination (Wadman et al, 1997; Lecuyer et al, 2002; Xu et al, 2003; Lahlil et al, 2004).
We found that neither SCL nor any of its partners bound the α-globin cluster in non-erythroid or pluripotent ES cells. However, in FDCP-mix, SCL bound HS-31, -26 and -12 in a similar pattern to that seen for GATA-2. We therefore looked for evidence that other members of the SCL/GATA complex bound to these regions and found almost identical ChIP profiles for E2A, LMO2 and Ldb-1 (Figure 7 and Supplementary Figure 2), demonstrating for the first time that the full pentameric SCL nucleoprotein complex had assembled on DNA in vivo. Later in erythropoiesis we found that the SCL complex was present with GATA-1 at HS-31, -26, -21, -12 and -8 (Figure 7), again suggesting that the multiprotein SCL complex including GATA-1 had assembled at these sites.
Figure 7.
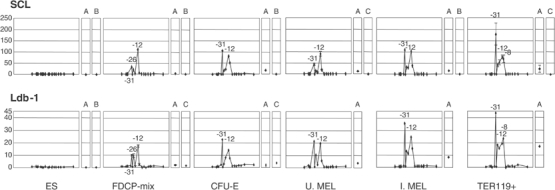
The SCL complex binds to the α globin upstream HSs in a similar pattern to GATA factors, but not to the α-globin promoters. ChIP analysis of SCL (top) and Ldb-1 (bottom) in cells representing different stages of erythropoiesis. Plots follow Figure 4. A, HS2 of the β LCR; B, β-actin CpG island; C, −2.8 region of the GATA-2 locus (Grass et al, 2003). The error bars represent ±1 s.d. from two independent ChIPs.
Although GATA-1 and FOG-1 clearly bind at the α-globin promoters in committed erythroid cells, SCL and its partners were not associated with these elements, suggesting that GATA-1 binds the mouse α-globin promoters as part of a different complex.
Role of NF-E2
In addition to GATA-1, GATA-2 and SCL, previous work has also identified NF-E2 as an erythroid-specific transactivator. NF-E2 is made up of a b-zip protein (p45 NF-E2) (Andrews et al, 1993a) and a small Maf protein (p18 NF-E2 or MafK) (Andrews et al, 1993b). Both p18 and p45 are members of families of related proteins, which may have overlapping, redundant function (Motohashi et al, 2002).
None of the NF-E2 components bind the α cluster in ES cells. However, in FDCP-mix, both p18 and p45 NF-E2 were bound at HS-26 and -12, which both contain MAREs (consensus binding sites for the p18/p45 heterodimer), suggesting that NF-E2, like GATA-2, may play a role in priming the α cluster in multipotent progenitors. In CFU-E, little or no p45 was bound, whereas p18 bound to HS-26 and to a lesser degree to HS-31 and -12. In uninduced MEL cells, both p18 and p45 bound to HS-31, -26 and -12 but there was relatively more p18 bound than p45. Of interest, HS-31 does not contain any classical MARE site, suggesting that NF-E2 may bind indirectly as part of another protein complex. These findings suggest that in early erythroid progenitors MAREs may be predominantly occupied by inactive p18 homodimers (Motohashi et al, 2002) or heterodimers with Bach1 (a known transcriptional repressor) (Brand et al, 2004). We cannot exclude the possibility that NF-E2 p45 may reside in a different complex in these cells, which renders it less accessible to the antibody. In late erythroblasts and induced MEL cells, in which expression of p45 increases, equal, high levels of p18 and p45 were bound to HS-31, -26 and -12 but not the α promoters (Figure 8). These findings suggest that the binding of high levels of p18 and p45 NF-E2 normally plays an important role in activating α-globin expression during terminal erythroid differentiation.
Figure 8.
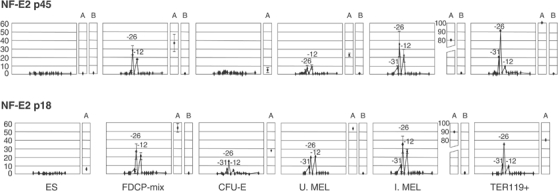
NF-E2 binds in a bimodal fashion priming the α-globin cluster in multipotent progenitors and increasing again when α globin is expressed. ChIP assay on NF-E2 p45 (top) and p18 (bottom). Both subunits first bind in FDCP-mix to HS-26 and -12 in the same proportions. Later in differentiation (CFU-E), p45 disappears and only recovers the equilibrium with p18 subunit at stages in which α globin is expressed. This disequilibrium in p18 and p45 binding may prevent or activate α-globin transcription at different stages of haemopoiesis. At the β-globin cluster, the HS2 (A) shows a similar pattern.
Recruitment of polymerase II
The ultimate purpose of erythropoiesis is to activate fully the α- and β-globin genes to accumulate high levels of globin mRNA (10–20 000 molecules per cell), synthesise massive amounts of haemoglobin (280 × 106 molecules per cell) and form mature red cells.
Carefully controlled ChIP assays across the entire α cluster showed that polymerase II (PolII) is not engaged at the α-globin promoters in ES cells, FDCP-mix cells, CFU-Es or uninduced MEL cells and only binds at the later stages of erythroid maturation as the binding of NF-E2 and histone acetylation increase (Figure 9). Therefore, it appears that all relevant transcription factors are already bound and many of the associated chromatin modifications including the HSs have substantially developed, before PolII is engaged. From these observations, it seems likely that the sequential binding of GATA-2, GATA-1, SCL complex and NF-E2, described above, precedes binding of PolII and plays a role in its recruitment or activation.
Figure 9.

RNA PolII is only detectable at the α-globin promoters late in differentiation. ChIP assay shows no enrichment of PolII in cells not expressing α globin. By contrast, the β-actin promoter (B) binds PolII in these cells, decreasing later in erythroid differentiation as the nucleus becomes pyknotic and expression of many genes (but not globin) is diminished. In globin-expressing cells (I. MEL and Ter119-selected cells), PolII binds not only the α-globin promoters but also β-HS2 as previously described (Johnson et al, 2002) (A). Simultaneously, very small enrichment of PolII can be detected upstream the α genes.
PolII is detectable at the α promoter in induced MEL cells when GATA-1 is also present. The continued presence of GATA-1 at the promoter may not be required to maintain PolII transcription since little or no GATA-1 was found at the later stages of erythropoiesis.
In addition to binding at the α-globin promoters, we also noted very small peaks of PolII bound to HS-31 and -8 in induced MEL cells and erythroblasts. The significance of this low level of binding is not clear.
Discussion
We have established in detail the order of events that occur as a chromosomal domain is ‘set up' and the genes contained within it become fully activated during commitment and differentiation (Figure 10). In pluripotent ES cells, in which key haemopoietic transcription factors are not readily detectable, none of the conserved regulatory elements of the α-globin cluster are occupied and chromatin in this region, as determined by DNase1 HSs and histone modification, appears similar to that observed in non-erythroid cells. Therefore, we found no evidence for priming of haemopoiesis in pluripotent cells. By contrast, in multipotent haemopoietic cells maintained under conditions of self-renewal, the α cluster appears to be primed for globin gene expression at several upstream elements, even though these cells retain the potential to form cell types in which globin expression is ultimately silenced, providing further evidence for multilineage priming in these cells. ES cells may either be unprimed or may prime expression of early developmental genes but not haemopoietic genes; whichever, they can give rise to specialised stem cells primed specifically for haemopoiesis.
Figure 10.
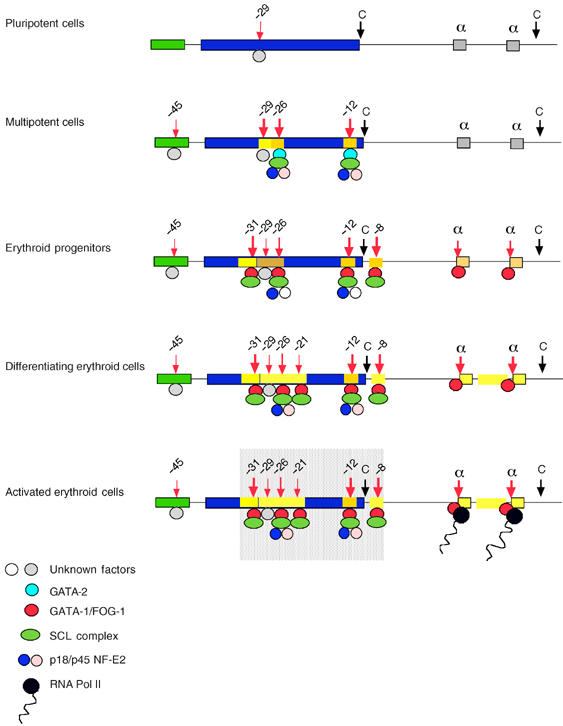
Summary of α-globin activation during erythroid differentiation. In pluripotent cells, the α cluster appears relatively inert, and only HS-29 appears to be bound and the significance of this is unknown. In multipotent cells, the cluster is primed in the upstream region by multiprotein complexes containing SCL and NF-E2 nucleated by GATA-2. HS-29 becomes very prominent and the associated histones are highly acetylated. Otherwise, only limited histone modifications (indicated by yellow boxes) are present. In committed erythroid progenitors, most HSs associated with conserved noncoding sequences are bound by multiprotein complexes containing various combinations of SCL and NF-E2, now nucleated by GATA-1. The α-globin promoters are also bound by GATA-1 either alone or as part of a different multiprotein complex. In differentiating erythroid cells, histone modifications extend throughout much of the locus, creating an erythroid-specific domain of histone hyperacetylation. The pattern of binding alters very little between cells expressing globin and those that do not. The exponential increase in globin mRNA synthesis would be consistent with cooperative interactions between proteins bound upstream of the cluster (shaded box) and multiprotein complexes, including PolII at the α-globin promoters.
In multipotent cells, in which haemopoietic transcription factors are expressed, the chromatin in the region upstream of the α-globin cluster becomes hypersensitive to DNase1 at specific sites, namely HS-26 and -12. At these sites, the histones have become weakly acetylated and the DNA bound by GATA-2, NF-E2 and the SCL complex. We also noted a strong HS at -29, of unknown function, in these cells that becomes progressively weaker and loses acetylation during differentiation.
By the time the cell is fully committed as a unilineage erythroid progenitor (CFU-E and uninduced MEL cells), GATA-1 has replaced GATA-2 at HS -26 and -12 and new sites develop at HS -31, -8 and the α-gene promoters, which also bind GATA-1 or the GATA-1/SCL complex. As this occurs, histone acetylation appears to extend further throughout the entire region containing these elements, including the α-globin promoters. At this stage of erythroid commitment, the entire α cluster appears to be ‘poised' for action, even though little or no globin mRNA is made. In this poised state, the chromatin associated with the promoters is also highly enriched in H3-diMeK4 as noted for other poised promoters (Bottardi et al, 2003).
During terminal differentiation and maturation, the levels of GATA-1, p45 NF-E2 and SCL mRNA and binding increase and a new HS appears at -21. Concurrently, the levels of histone acetylation increase at the regulatory elements and throughout the domain, most notably in the region lying between the two α genes. However, it appears that most if not all changes reinforce existing patterns rather than develop new changes. The last event in activation involves recruitment of PolII to the hyperacetylated α-globin promoters and transcription of the genes begins (Figures 3C and 9). Throughout erythropoiesis, regions flanking the globin domain remain uniformly acetylated at relatively low levels and at present it is not clear what confines chromatin activation to the α-globin region.
The initial stages of erythroid commitment, mediated through a common set of binding sites, are brought about by GATA-2, rather than the lineage-restricted factor GATA-1. Consistent with this, GATA-2 is abundantly expressed in multipotential cells, whereas GATA-1 is only upregulated at the later stages of commitment and differentiation. Thus, priming initiates via the less restricted factor (GATA-2) and subsequently full-scale transcriptional activation occurs as this is replaced by the lineage-specific factor (GATA-1), which consolidates or substitutes its function. These findings are consistent with a general model in which commitment and differentiation are substantially driven by development of the transcriptional programme.
Several important questions arise from these findings. The first is how the specific sites (e.g. GATA and MARE sites) associated with conserved regulatory elements differ from the thousands of similar sites within and surrounding the α-globin region so that only these very restricted, evolutionarily conserved sites are primed by their cognate transcription factors. One view is that such regions contain unique sequences and/or chromatin structures, which promote the cooperative binding of transcription factors and their cofactors to each other and to the site. Such nucleoprotein complexes have been referred to previously as enhanceosomes (Thanos and Maniatis, 1995). Presumably, the free energy required to form an enhanceosome is fine-tuned to the concentration and combinations of the relevant activators and coactivators at any particular stage of commitment or differentiation so that the site in question is greatly favoured for binding over all others. The various multiprotein combinations found binding specific conserved elements in this study (e.g. GATA-1/2-SCL, GATA-1/2-NF-E2, GATA-1) and the dependence of GATA-1 binding on FOG-1 would be consistent with the enhanceosome concept. Furthermore, it seems probable that the programme of erythropoiesis is primarily driven by the recruitment of GATA-2 and GATA-1. Extensive evolutionary analysis of the α cluster (Hughes et al, in preparation) shows that the WGATAR motif is by far the most consistently conserved at the sites bound in erythroid cells. Some MAREs are also conserved, but E boxes and CACCC boxes appear to be relatively poorly conserved. Therefore, it seems likely that the haemopoietic complexes identified here are nucleated in chromatin via sequential binding of GATA-2 and GATA-1.
Once assembled, how might enhanceosomes induce exponential increases in gene expression? It seems probable that these sites individually or as a large nucleoprotein complex might interact with the α-globin promoters. However, in contrast to the β promoters (Sawado et al, 2001; Johnson et al, 2002), NF-E2 could not be detected by ChIP at the α promoters and neither could the SCL complex, suggesting that any interaction between the upstream elements and the α promoter may be rapid and/or transitory.
Together with complementary data on the β cluster, the globin genes continue to provide the best-characterised examples of how mammalian genes are regulated in vivo. The studies provide insight into the order of events and mechanism by which individual mammalian genes are activated by key regulators, in this case GATA-1 and GATA-2, throughout lineage commitment, differentiation and development.
Materials and methods
Primary cells and cell lines
MEL cell line 585 was grown and induced as described (Higgs et al, 1990). FDCP-mix A4 cells, derived from bone marrow cultures, were grown and assayed for differentiation (Spooncer et al, 1986). ES and GIE cells were grown as reported (Weiss et al, 1997; Anguita et al, 2002). G1E cells expressing GATA-1-ER or GATA-1 (V205M)-ER (Nichols et al, 2000) were induced with 1 μM estradiol for 21 h. Primary CFU-E were obtained from mice as described (Nijhof et al, 1982; Miller et al, 2002). Mature primary erythroid cells were obtained from phenylhydrazine-treated adult mice as described (Spivak et al, 1973). TER119+ cells were magnetically sorted, after indirect labelling.
Chromatin analysis
DNase1 HSs were analysed as before (Higgs et al, 1990). For ChIP assay, protein–DNA crosslinking was performed by incubating ∼107 cells with 0.4% formaldehyde for 10 min at room temperature. Glycine (0.125 M) was added to quench the reaction. Cells were washed twice in PBS with protease inhibitors (Complete, Roche). Nuclei were lysed in a solution of 1% SDS, 10 mM EDTA and 50 mM Tris–HCl (pH 8.1). The lysate was sheared by sonication to reduce the chromatin fragments to ∼200 base pairs. GATA-1 ChIP assay was performed as described (Johnson et al, 2002). Other assays used the ChIP assay kit (Upstate Biotechnology).
Real-time PCR
Primers and 5′FAM-3′TAMRA labelled probes were selected from unique sequences in the murine α-globin locus and appropriate external controls using Primer Express (Supplementary Table). Input and immunoprecipitated material were analysed in duplicate using an ABI prism 7000 Sequence Detection System following PE Applied Biosystem's Taqman Universal PCR Master Mix protocol. The fold difference of a given target sequence precipitated by a specific antibody was determined by dividing the amount of this in the immunoprecipitated fraction by the amount of target sequence in input DNA (Litt et al, 2001). Results were related to a control sequence in the GAPDH gene (Supplementary Table).
Immunofluorescence
Cells adhered to coverslips coated with poly-L-lysine 0.01% (Sigma) or grown on coverslips (L929 and ES cells) were fixed with 4% v/v paraformaldehyde (Electron Microscopy Sciences) in PBS for 10 min. The cells were then permeabilised in 0.5% Triton for 10 min and blocked for 30 min with PBS+B: 3% w/v albumin bovine serum (Sigma), 5% v/v fetal calf serum (PAA Laboratories GmbH, Linz, Austria) in PBS. Antibodies were diluted 1:100 in PBS+B and incubated with the cells for 1 h. After three washes of 10 min in PBS, the cells were incubated with an appropriate secondary antibody diluted 1:200 in PBS+B for 1 h. After three washes of 10 min in PBS and fixation with 4% paraformaldehyde for 10 min, nuclei were stained with 200 nM TO-PRO-3 (Molecular Probes). Images were obtained using an Olympus BX 51 microscope with a confocal BioRad Radiance 2000 system and analysed using Metamorph 6.1. Images were imported into Photoshop and the only manipulation performed was contrast stretch.
Antibodies for immunofluorescence and ChIP
The antibodies used were anti-diacetylated histone 3 (06-599), anti-tetra-acetylated histone 4 (06-866), anti-dimethyl H3-K4 (07-030) (Upstate Biotechnology), RNA PolII (N-20), NF-E2 p45 (C-19), NF-E2 p18 (C-16), GATA-2 (H-116), GATA-1 (N6), E2A.E12 (V-18), FOG-1 (M-216) (last seven from Santa Cruz Biotechnology), SCL (Porcher et al, 1999), Ldb-1 and LMO2 (Visvader et al, 1997).
RNA analysis
RNA was prepared with TRI reagent (Sigma). RNase protection assay was performed using riboprobes for the mouse GATA-1, GATA-2, NF-E2 p45, SCL (subcloned from cDNA fragments provided by S Orkin) and α globin (Higgs et al, 1990).
Supplementary Material
Supplementary Figure 1
Supplementary Figure 1
Supplementary Figure 3
Supplementary Data
Supplementary Table
Acknowledgments
We thank Helena Ayyub, Jacqueline A Sloane-Stanley, Ann Atzberger and Stella Pearson for their technical assistance, Francisco Iborra for advice, Andrew Thomson for producing the riboprobes, Stuart H Orkin for plasmids to generate riboprobes and antibodies, and Catherine Porcher for antibodies. Also we thank Danielle L Letting for providing ChIP material to assay the FOG-1 complex in G1E cells.
References
- Andrews NC, Erdjument-Bromage H, Davidson MB, Tempst P, Orkin SH (1993a) Erythroid transcription factor NF-E2 is a haematopoietic-specific basic-leucine zipper protein. Nature 362: 722–728 [DOI] [PubMed] [Google Scholar]
- Andrews NC, Kotkow KJ, Ney PA, Erdjument-Bromage H, Tempst P, Orkin SH (1993b) The ubiquitous subunit of erythroid transcription factor NF-E2 is a small basic-leucine zipper protein related to the v-maf oncogene. Proc Natl Acad Sci USA 90: 11488–11492 [DOI] [PMC free article] [PubMed] [Google Scholar]
- Anguita E, Johnson CA, Wood WG, Turner BM, Higgs DR (2001) Identification of a conserved erythroid specific domain of histone acetylation across the alpha-globin gene cluster. Proc Natl Acad Sci USA 98: 12114–12119 [DOI] [PMC free article] [PubMed] [Google Scholar]
- Anguita E, Sharpe JA, Sloane-Stanley JA, Tufarelli C, Higgs DR, Wood WG (2002) Deletion of the mouse alpha-globin regulatory element (HS-26) has an unexpectedly mild phenotype. Blood 100: 3450–3456 [DOI] [PubMed] [Google Scholar]
- Bottardi S, Aumont A, Grosveld F, Milot E (2003) Developmental stage-specific epigenetic control of human beta-globin gene expression is potentiated in hematopoietic progenitor cells prior to their transcriptional activation. Blood 102: 3989–3997 [DOI] [PubMed] [Google Scholar]
- Bouhassira EE, Kielman MF, Gilman J, Fabry MF, Suzuka S, Leone O, Gikas E, Bernini LF, Nagel RL (1997) Properties of the mouse alpha-globin HS-26: relationship to HS-40, the major enhancer of human alpha-globin gene expression. Am J Hematol 54: 30–39 [DOI] [PubMed] [Google Scholar]
- Brand M, Ranish JA, Kummer NT, Hamilton J, Igarashi K, Francastel C, Chi TH, Crabtree GR, Aebersold R, Groudine M (2004) Dynamic changes in transcription factor complexes during erythroid differentiation revealed by quantitative proteomics. Nat Struct Mol Biol 11: 73–80 [DOI] [PubMed] [Google Scholar]
- Cantor AB, Orkin SH (2002) Transcriptional regulation of erythropoiesis: an affair involving multiple partners. Oncogene 21: 3368–3376 [DOI] [PubMed] [Google Scholar]
- Flint J, Tufarelli C, Peden J, Clark K, Daniels RJ, Hardison R, Miller W, Philipsen S, Tan-Un KC, McMorrow T, Frampton J, Alter BP, Frischauf AM, Higgs DR (2001) Comparative genome analysis delimits a chromosomal domain and identifies key regulatory elements in the alpha globin cluster. Hum Mol Genet 10: 371–382 [DOI] [PubMed] [Google Scholar]
- Gourdon G, Sharpe JA, Higgs DR, Wood WG (1995) The mouse alpha-globin locus regulatory element. Blood 86: 766–775 [PubMed] [Google Scholar]
- Grass JA, Boyer ME, Pal S, Wu J, Weiss MJ, Bresnick EH (2003) GATA-1-dependent transcriptional repression of GATA-2 via disruption of positive autoregulation and domain-wide chromatin remodeling. Proc Natl Acad Sci USA 100: 8811–8816 [DOI] [PMC free article] [PubMed] [Google Scholar]
- Hartzog GA, Myers RM (1993) Discrimination among potential activators of the beta-globin CACCC element by correlation of binding and transcriptional properties. Mol Cell Biol 13: 44–56 [DOI] [PMC free article] [PubMed] [Google Scholar]
- Higgs DR, Sharpe JA, Wood WG (1998) Understanding alpha globin gene expression: a step towards effective gene therapy. Semin Hematol 35: 93–104 [PubMed] [Google Scholar]
- Higgs DR, Wood WG, Jarman AP, Sharpe J, Lida J, Pretorius IM, Ayyub H (1990) A major positive regulatory region located far upstream of the human alpha-globin gene locus. Genes Dev 4: 1588–1601 [DOI] [PubMed] [Google Scholar]
- Hu M, Krause D, Greaves M, Sharkis S, Dexter M, Heyworth C, Enver T (1997) Multilineage gene expression precedes commitment in the hemopoietic system. Genes Dev 11: 774–785 [DOI] [PubMed] [Google Scholar]
- Jimenez G, Griffiths SD, Ford AM, Greaves MF, Enver T (1992) Activation of the beta-globin locus control region precedes commitment to the erythroid lineage. Proc Natl Acad Sci USA 89: 10618–10622 [DOI] [PMC free article] [PubMed] [Google Scholar]
- Johnson KD, Grass JA, Boyer ME, Kiekhaefer CM, Blobel GA, Weiss MJ, Bresnick EH (2002) Cooperative activities of hematopoietic regulators recruit RNA polymerase II to a tissue-specific chromatin domain. Proc Natl Acad Sci USA 99: 11760–11765 [DOI] [PMC free article] [PubMed] [Google Scholar]
- Kielman MF, Smits R, Bernini LF (1994) Localization and characterization of the mouse alpha-globin locus control region. Genomics 21: 431–433 [DOI] [PubMed] [Google Scholar]
- Kielman MF, Smits R, Hof I, Bernini LF (1996) Characterization and comparison of the human and mouse Dist1/alpha-globin complex reveals a tightly packed multiple gene cluster containing differentially expressed transcription units. Genomics 32: 341–351 [DOI] [PubMed] [Google Scholar]
- Ko LJ, Engel JD (1993) DNA-binding specificities of the GATA transcription factor family. Mol Cell Biol 13: 4011–4022 [DOI] [PMC free article] [PubMed] [Google Scholar]
- Lahlil R, Lecuyer E, Herblot S, Hoang T (2004) SCL assembles a multifactorial complex that determines glycophorin A expression. Mol Cell Biol 24: 1439–1452 [DOI] [PMC free article] [PubMed] [Google Scholar]
- Lecuyer E, Herblot S, Saint-Denis M, Martin R, Begley CG, Porcher C, Orkin SH, Hoang T (2002) The SCL complex regulates c-kit expression in hematopoietic cells through functional interaction with Sp1. Blood 100: 2430–2440 [DOI] [PubMed] [Google Scholar]
- Letting DL, Chen YY, Rakowski C, Reedy S, Blobel GA (2004) Context-dependent regulation of GATA-1 by friend of GATA-1. Proc Natl Acad Sci USA 101: 476–481 [DOI] [PMC free article] [PubMed] [Google Scholar]
- Litt MD, Simpson M, Recillas-Targa F, Prioleau MN, Felsenfeld G (2001) Transitions in histone acetylation reveal boundaries of three separately regulated neighboring loci. EMBO J 20: 2224–2235 [DOI] [PMC free article] [PubMed] [Google Scholar]
- Loyd MR, Okamoto Y, Randall MS, Ney PA (2003) Role of AP1/NFE2 binding sites in endogenous alpha-globin gene transcription. Blood 102: 4223–4228 [DOI] [PubMed] [Google Scholar]
- Marks PA, Sheffery M, Rifkind RA (1987) Induction of transformed cells to terminal differentiation and the modulation of gene expression. Cancer Res 47: 659–666 [PubMed] [Google Scholar]
- Merika M, Orkin SH (1993) DNA-binding specificity of GATA family transcription factors. Mol Cell Biol 13: 3999–4010 [DOI] [PMC free article] [PubMed] [Google Scholar]
- Miller CP, Heilman DW, Wojchowski DM (2002) Erythropoietin receptor-dependent erythroid colony-forming unit development: capacities of Y343 and phosphotyrosine-null receptor forms. Blood 99: 898–904 [DOI] [PubMed] [Google Scholar]
- Motohashi H, O'Connor T, Katsuoka F, Engel JD, Yamamoto M (2002) Integration and diversity of the regulatory network composed of Maf and CNC families of transcription factors. Gene 294: 1–12 [DOI] [PubMed] [Google Scholar]
- Murre C, McCaw PS, Baltimore D (1989) A new DNA binding and dimerization motif in immunoglobulin enhancer binding, daughterless, MyoD, and myc proteins. Cell 56: 777–783 [DOI] [PubMed] [Google Scholar]
- Nichols KE, Crispino JD, Poncz M, White JG, Orkin SH, Maris JM, Weiss MJ (2000) Familial dyserythropoietic anaemia and thrombocytopenia due to an inherited mutation in GATA1. Nat Genet 24: 266–270 [DOI] [PMC free article] [PubMed] [Google Scholar]
- Nijhof W, Wierenga PK, Goldwasser E (1982) The regeneration of stem cells after a bone marrow depression induced by thiamphenicol. Exp Hematol 10: 36–43 [PubMed] [Google Scholar]
- Orkin SH (1992) GATA-binding transcription factors in hematopoietic cells. Blood 80: 575–581 [PubMed] [Google Scholar]
- Pal S, Cantor AB, Johnson KD, Moran TB, Boyer ME, Orkin SH, Bresnick EH (2004) Coregulator-dependent facilitation of chromatin occupancy by GATA-1. Proc Natl Acad Sci USA 101: 980–985 [DOI] [PMC free article] [PubMed] [Google Scholar]
- Pevny L, Simon MC, Robertson E, Klein WH, Tsai SF, D'Agati V, Orkin SH, Costantini F (1991) Erythroid differentiation in chimaeric mice blocked by a targeted mutation in the gene for transcription factor GATA-1. Nature 349: 257–260 [DOI] [PubMed] [Google Scholar]
- Porcher C, Liao EC, Fujiwara Y, Zon LI, Orkin SH (1999) Specification of hematopoietic and vascular development by the bHLH transcription factor SCL without direct DNA binding. Development 126: 4603–4615 [DOI] [PubMed] [Google Scholar]
- Sawado T, Igarashi K, Groudine M (2001) Activation of beta-major globin gene transcription is associated with recruitment of NF-E2 to the beta-globin LCR and gene promoter. Proc Natl Acad Sci USA 98: 10226–10231 [DOI] [PMC free article] [PubMed] [Google Scholar]
- Sheffery M, Marks PA, Rifkind RA (1984) Gene expression in murine erythroleukemia cells. Transcriptional control and chromatin structure of the alpha 1-globin gene. J Mol Biol 172: 417–436 [DOI] [PubMed] [Google Scholar]
- Spivak JL, Toretti D, Dickerman HW (1973) Effect of phenylhydrazine-induced hemolytic anemia on nuclear RNA polymerase activity of the mouse spleen. Blood 42: 257–266 [PubMed] [Google Scholar]
- Spooncer E, Heyworth CM, Dunn A, Dexter TM (1986) Self-renewal and differentiation of interleukin-3-dependent multipotent stem cells are modulated by stromal cells and serum factors. Differentiation 31: 111–118 [DOI] [PubMed] [Google Scholar]
- Steinberg MH, Forget BG, Higgs DR, Nagel RL. (2001) Disorders of Hemoglobin. Cambridge: Cambridge University Press [Google Scholar]
- Thanos D, Maniatis T (1995) Virus induction of human IFN beta gene expression requires the assembly of an enhanceosome. Cell 83: 1091–1100 [DOI] [PubMed] [Google Scholar]
- Tsai FY, Keller G, Kuo FC, Weiss M, Chen J, Rosenblatt M, Alt FW, Orkin SH (1994) An early haematopoietic defect in mice lacking the transcription factor GATA-2. Nature 371: 221–226 [DOI] [PubMed] [Google Scholar]
- Tsang AP, Fujiwara Y, Hom DB, Orkin SH (1998) Failure of megakaryopoiesis and arrested erythropoiesis in mice lacking the GATA-1 transcriptional cofactor FOG. Genes Dev 12: 1176–1188 [DOI] [PMC free article] [PubMed] [Google Scholar]
- Tsang AP, Visvader JE, Turner CA, Fujiwara Y, Yu C, Weiss MJ, Crossley M, Orkin SH (1997) FOG, a multitype zinc finger protein, acts as a cofactor for transcription factor GATA-1 in erythroid and megakaryocytic differentiation. Cell 90: 109–119 [DOI] [PubMed] [Google Scholar]
- Tse C, Sera T, Wolffe AP, Hansen JC (1998) Disruption of higher-order folding by core histone acetylation dramatically enhances transcription of nucleosomal arrays by RNA polymerase III. Mol Cell Biol 18: 4629–4638 [DOI] [PMC free article] [PubMed] [Google Scholar]
- Vettese-Dadey M, Grant PA, Hebbes TR, Crane- Robinson C, Allis CD, Workman JL (1996) Acetylation of histone H4 plays a primary role in enhancing transcription factor binding to nucleosomal DNA in vitro. EMBO J 15: 2508–2518 [PMC free article] [PubMed] [Google Scholar]
- Visvader JE, Mao X, Fujiwara Y, Hahm K, Orkin SH (1997) The LIM-domain binding protein Ldb1 and its partner LMO2 act as negative regulators of erythroid differentiation. Proc Natl Acad Sci USA 94: 13707–13712 [DOI] [PMC free article] [PubMed] [Google Scholar]
- Wadman IA, Osada H, Grutz GG, Agulnick AD, Westphal H, Forster A, Rabbitts TH (1997) The LIM-only protein Lmo2 is a bridging molecule assembling an erythroid, DNA-binding complex which includes the TAL1, E47, GATA-1 and Ldb1/NLI proteins. EMBO J 16: 3145–3157 [DOI] [PMC free article] [PubMed] [Google Scholar]
- Weiss MJ, Yu C, Orkin SH (1997) Erythroid-cell-specific properties of transcription factor GATA-1 revealed by phenotypic rescue of a gene-targeted cell line. Mol Cell Biol 17: 1642–1651 [DOI] [PMC free article] [PubMed] [Google Scholar]
- Xu Z, Huang S, Chang LS, Agulnick AD, Brandt SJ (2003) Identification of a TAL1 target gene reveals a positive role for the LIM domain-binding protein Ldb1 in erythroid gene expression and differentiation. Mol Cell Biol 23: 7585–7599 [DOI] [PMC free article] [PubMed] [Google Scholar]
Associated Data
This section collects any data citations, data availability statements, or supplementary materials included in this article.
Supplementary Materials
Supplementary Figure 1
Supplementary Figure 1
Supplementary Figure 3
Supplementary Data
Supplementary Table