Orchestration of lymphocyte chemotaxis by mitochondrial dynamics (original) (raw)
Abstract
Lymphocyte traffic is required to maintain homeostasis and perform appropriate immunological reactions. To migrate into inflamed tissues, lymphocytes must acquire spatial and functional asymmetries. Mitochondria are highly dynamic organelles that distribute in the cytoplasm to meet specific cellular needs, but whether this is essential to lymphocyte functions is unknown. We show that mitochondria specifically concentrate at the uropod during lymphocyte migration by a process involving rearrangements of their shape. Mitochondrial fission facilitates relocation of the organelles and promotes lymphocyte chemotaxis, whereas mitochondrial fusion inhibits both processes. Our data substantiate a new role for mitochondrial dynamics and suggest that mitochondria redistribution is required to regulate the motor of migrating cells.
Lymphocytes are able to sense extracellular directional chemoattractant gradients and to respond with asymmetric changes in cell morphology (polarization) and mobility (chemotaxis). Cell polarization and chemotaxis depend on the signaling of seven-transmembrane receptors coupled to heterotrimeric Gi proteins (G protein–coupled receptors). To achieve directed movement, cells organize and maintain spatial and functional asymmetry with a defined anterior (leading edge) and posterior (uropod) (1, 2). In lymphoid cells, the leading edge contains the cell machinery for actin polymerization and gradient sensing, whereas the uropod contains certain adhesion molecules, the microtubule organizing center (MTOC), and the majority of cellular organelles and cytoplasmic volume (3).
Mitochondria, highly mobile and dynamic organelles (4), can accumulate in subcellular regions requiring high metabolic activity, such as active growth cones of developing neurons (5) or dendritic protusions in spines and synapses (6). Intracellular distribution of mitochondria is controlled by their movement along microtubules, mediated by kinesin and dynein motors. This is coordinated with changes in the morphology of the organelles. Mitochondrial shape results from a regulated balance between fusion and fission events, tightly controlled by a growing family of so-called “mitochondria-shaping” proteins. These include both profusion members, such as the large dynamin-like GTPases Opa1 and mitofusin (Mfn) 1 and 2, and profission members, such as the cytosolic GTPase dynamin-related protein 1 (Drp1) and its outer mitochondrial membrane adaptor hFis1 (7). To move, the extensive mitochondrial network must be divided into smaller organelles that can be readily cargoed by plus- and minus-end directed motors (8). To this end, the machinery that transports mitochondria is likely coordinated with mitochondria-shaping proteins, as substantiated by the finding that disruption of the dynein complex results in mitochondrial elongation dependent on Drp1 blockage (9).
Mitochondria cluster at the site of high ATP demands in different cell types, and previous studies suggested a possible direct functional interaction between these ATP-producing organelles and ATP-consuming cellular structures (6, 10–13). It has been recently demonstrated that in Drosophila neuromuscular junctions, mitochondria positioning at the synapse is required to fuel the myosin ATPase that mobilize reserve pool vesicles (13). Whether, how, or why mitochondria redistribute during lymphocyte migration is totally unknown.
In this study, we demonstrate that mitochondria are transported to the uropod along microtubules during lymphocyte migration in a process requiring Gi protein signaling and mitochondrial fission. By interfering with the expression of mitochondria-shaping proteins that regulate the dynamics of the organelles, we show that fusion-fission of mitochondria constrains lymphocyte polarization and migration. Our data suggest that accumulation of mitochondria at the uropod of a migrating cell is required to regulate the cell motor of migrating lymphocytes.
RESULTS
Mitochondria concentrate at the uropod of migrating lymphocytes
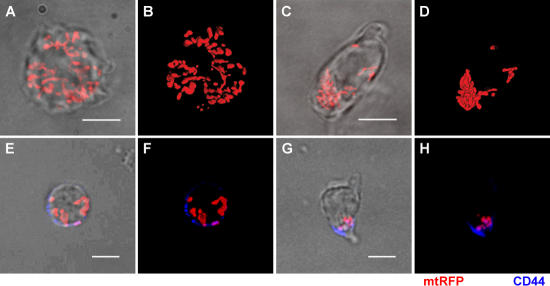
To analyze mitochondria dynamics during leukocyte migration, we expressed a mitochondrially targeted red fluorescent protein (mtRFP) or yellow fluorescent protein (mtYFP) in Jurkat T cells, human peripheral blood T cells (PB T cells), and differentiated HL-60 (dHL-60) myelocytic cells, a model neutrophil-like cell line. In all of the following experiments, mitochondria were visualized using either mtRFP or mtYFP, obtaining identical results. Mitochondrial positioning was analyzed in response to chemotactic factors such as CXC chemokine ligand (CXCL) 12 or CC chemokine ligand (CCL) 21 for Jurkat and PB T cells or the tripeptide attractant _N_-formyl-Met-Leu-Phe (_f_MLP) for dHL-60 cells. In polarized T cells, mitochondria concentrated in a region of the cell corresponding to the uropod (Fig. 1 and Videos S1 and S2, available at http://www.jem.org/cgi/content/full/jem.20061877/DC1), as indicated by colocalization of the organelles with the uropodal marker CD44 (Fig. 1, G and H) (14).
Figure 1.
Mitochondria accumulate at the uropod of polarized lymphocytes. (A–D) Distribution of mitochondria (mtRFP) in Jurkat T cells untreated (A and B) or polarized with 100 nM CXCL12 (C and D). 310 untreated and 395 polarized cells were analyzed. (B and D) Volume-rendered three-dimensional reconstructions of mitochondrial networks (see also Videos S1 and S2). (E–H) Distribution of mitochondria (mtRFP) in PB T cells resting (E and F) and polarized with 100 nM CCL21 (G and H). Staining of the uropod marker CD44 (blue) is shown. 59 resting and 45 polarized PB T cells were analyzed. Bars, 5 μm.
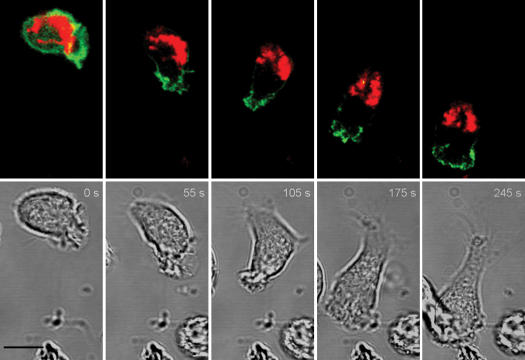
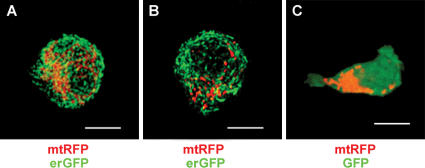
Similar results were obtained using dHL-60 cells expressing mtRFP to visualize mitochondria and the pleckstrin homology domain of AKT fused to GFP (AKTPH-GFP) to visualize the leading edge (15). We found that uropod redistribution of mtRFP paralleled the AKTPH-GFP accumulation at the leading cell edge (Fig. 2 and Video S3, available at http://www.jem.org/cgi/content/full/jem.20061877/DC1), demonstrating that mitochondria specifically redistribute to and accumulate at the uropod during directed leukocyte migration. The specific accumulation of mitochondria at the uropods of migrating leukocytes was further confirmed in experiments in which the distribution of mitochondria was compared with the distribution of the endoplasmic reticulum in Jurkat T cells (Fig. 3, A and B) or the cytoplasm in dHL-60 cells (Fig. 3 C). These figures clearly indicate that the location of mitochondria during leukocyte chemotaxis is specific and not a consequence of space constraints. Similar results were obtained using human PB B cells stimulated with CXCL12 and the human breast cancer cell line MCF7 stimulated with insulin-like growth factor–I, indicating that redistribution of mitochondria to the rear edge is a general event occurring in migrating cells (Fig. S1).
Figure 2.
Mitochondria accumulate at the uropod of a migrating leukocyte. _f_MLP-induced migration of dHL-60 cells expressing mtRFP and AKTPH-GFP monitored by time-lapse confocal microscopy. Images were taken at 5-s intervals. Representative images taken from the digital movie (Video S3) at the indicated times are shown. 14 cells expressing mtRFP and AKTPH-GFP were analyzed by real-time microscopy, and all of them showed a similar segregation of AKTPH-GFP to the leading edge and of mitochondria to the uropod. Bar, 5 μm.
Figure 3.
Specific accumulation of mitochondria in polarized leukocytes. (A and B) Distribution of mitochondria (mtRFP) and the endoplasmic reticulum (erGFP) in Jurkat T cells untreated (A) or polarized with 100 nM CXCL12 (B). (C) Distribution of mitochondria (mtRFP) and cytoplasm (GFP) in dHL-60 cells polarized with 100 nM _f_MLP. The fluorescence patterns reported in these panels were representative of at least 90% of the cells. Bars, 5 μm.
Mitochondria redistribution requires Gi protein signaling and microtubule integrity
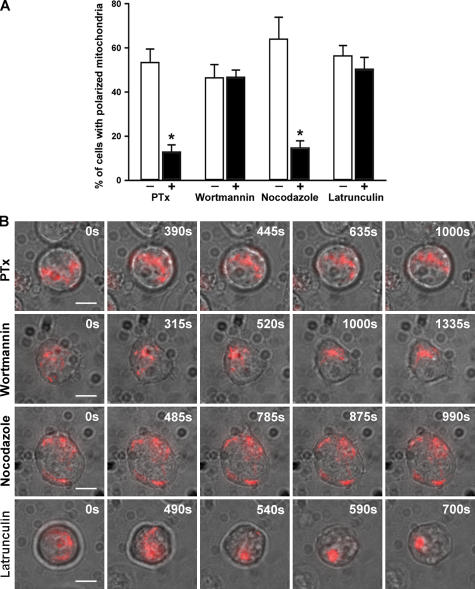
Classically, one of the initial events in chemoattractant receptor signaling is the physical association of heterotrimeric Gi proteins to the receptor, leading to the inhibition of adenylate cyclase and intracellular calcium mobilization (16). Nonetheless, chemokine receptors may be coupled to other G proteins upon ligand stimulation in specific circumstances (17, 18). We found that Pertussis toxin (PTx) treatment (19) inhibits CXCL12-induced mitochondria redistribution in T cells (Fig. 4), thus confirming that mitochondria polarization is coupled to Gi-induced signaling.
Figure 4.
Mitochondria recruitment to the T cell uropod depends on Gi protein signaling and microtubule dynamics. Jurkat T cells expressing mtRFP were incubated with 1 μg/ml PTx, 100 nM wortmannin, 30 μM nocodazole, or 10 μM latrunculin, and polarization was induced with 100nM CXCL12. (A) Images of mtRFP fluorescence from randomly selected cells (78 cells in the PTx experiment, 84 cells in the wortmannin experiment, 85 cells in the nocodazole experiment, and 82 cells in the latrunculin experiment) were acquired, analyzed, and classified as described in Materials and methods. The analysis includes all the cells, and in all these experiments <12% of cells contained polarized mitochondria in the absence of the chemokine. The number of cells showing polarized shape was similar to the number of those showing polarized mitochondria in the case of PTx, wortmannin, and latrunculin experiments. When nocodazole was used, 35% of the cells were polarized. Data represent mean ± SE of at least three independent experiments. *, P ≤ 0.05 compared with control cells. (B) Representative images taken from the digital movie at the indicated times are shown. Images were taken at 5-s intervals. At least 10 cells were analyzed by real-time microscopy for each condition. Bars, 5 μm.
Phosphoinositide 3–kinase (PI3K)–dependent signaling pathways have been suggested to play pivotal roles in determining lymphocyte chemotaxis. However, there is a growing body of evidence indicating that PI3K activation can be a dispensable signal for directed cell migration in certain settings (20). Thus, in our experiments, PI3K inhibition by wortmannin did not result in impaired mitochondria polarization in response to CXCL12 (Fig. 4).
Chemotaxis requires a concerted dialog between the actin and microtubule cytoskeletons (21). Polarity and migration depend on the dynamic polymerization of filamentous actin at the leading edge (22), whereas the MTOC and microtubules radiating from it direct vesicular traffic and maintain cell polarization (23). Moreover, microtubules are docking sites for motors that actively transport cytoplasmic organelles such as mitochondria (24). Mitochondria redistribution after chemokine receptor signaling was inhibited in cells treated with the microtubule-depolymerizing drug nocodazole but, conversely, remained unaffected by latrunculin, which depolymerizes filamentous actin (Fig. 4). Thus, microtubule but not actin cytoskeleton is involved in the recruitment of mitochondria to the T cell uropod.
Mitochondria accumulation at the cell uropod requires fission of the organelles
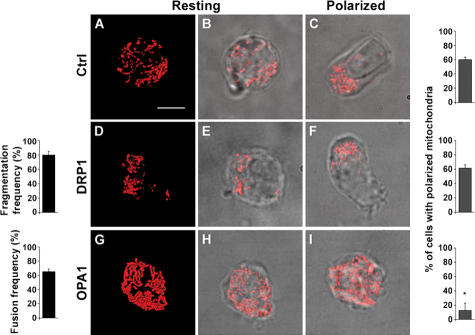
A key question is whether mitochondria accumulation at the uropod is a bystander effect owing to MTOC polarization or, in contrast, if mitochondria asymmetry is strategic for lymphocyte migration. To address this point, it would be necessary to inhibit mitochondria polarization without affecting their functional activities and without interfering with other cell organelles. Dynamic control of mitochondrial structure is performed by a set of mitochondria-shaping proteins, including both profusion and profission members (25). Mitochondrial fission is regulated by Drp1, which migrates to mitochondrial membranes at sites of fragmentation, where it binds to its adaptor hFis1 (26–27). Mitochondrial fusion requires the action of Mfn1 and Mfn2 and of the inner membrane dynamin-related protein Opa1 (28, 29). Manipulation of fusion-fission equilibrium often results in redistribution of the organelles in the cytoplasm (30). Thus, we expressed DRP1 and OPA1 to manipulate mitochondrial morphology (and distribution) in T lymphocytes. OPA1, as well as DRP1, did not alter mitochondrial membrane potential, as measured by accumulation of the potentiometric fluorescent dye tetramethyl rhodamine methyl ester, total cellular ATP concentration (Figs. S2 and S3, available at http://www.jem.org/cgi/content/full/jem.20061877/DC1), or actin polymerization and localization (not depicted). In Jurkat T cells, compared with control cells (Fig. 5, A and B; and Video S4), DRP1 induced mitochondrial division (80% of the cells), aggregation, and perinuclear clustering (Fig. 5, D and E; and Video S5). In contrast, mitochondria expressing OPA1 formed a tubular network (65% of the cells) spanning the entire cytoplasm (Fig. 5, G and H; and Video S6). In response to CXCL12, DRP1-transfected cells polarized to the same extent as control cells (61% of the cells; Fig. 5 F). In contrast, OPA1 blocked mitochondrial and cell polarization in response to the chemokine (13% of the cells showed polarized mitochondria; Fig. 5 I). Similar results were obtained with PB T lymphocytes (not depicted). These data indicate that mitochondrial redistribution to the uropod critically depends on unperturbed fission of the organelle. This, in turn, appears to be crucial to coordinate chemokine-induced polarization of the cell and therefore suggests a role for mitochondria in regulating migration.
Figure 5.
Mitochondria fission is required for recruitment of the organelles to the cell uropod. Jurkat T cells were cotransfected with mtRFP and empty vector (A–C), mtRFP and DRP1 (D–F), or mtRFP and OPA1 (G–I), and mitochondrial shape in resting (A, B, D, E, G, and H) or polarized (C, F, and I) cells was analyzed by confocal microscopy. Bar graphs next to images in the figure indicate the frequency of the phenomenon represented. *, P ≤ 0.0001 compared with polarized control cells. When transfected with DRP1, 80% of 167 analyzed cells showed fragmented mitochondria as in E; after chemokine treatment, 61% of 150 cells showed the polarized phenotype shown in F. In contrast, when OPA1 was expressed, 65% of 169 analyzed cells showed fused mitochondria as in H, whereas 87% of 180 cells showed the impaired polarization in response to chemokine shown in I. In control cells (C), CXCL12 induced mitochondria polarization in 60% of 395 analyzed cells. (A, D, and G) Volume-rendered three-dimensional reconstructions of mitochondrial network (see also Videos S4, S5, and S6). Data represent mean ± SE. Bar, 5 μm.
Mitochondrial shape constrains lymphocyte migration
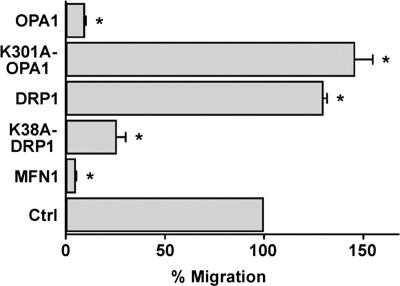
We next addressed whether fusion-fission of mitochondria orchestrates lymphocyte chemotaxis by expressing mitochondria-shaping proteins that regulate dynamics of the organelles. We found that OPA1, MFN1, and a dominant-negative mutant of DRP1 (K38A-DRP1) (31)—which promote fusion or inhibit fission of mitochondria, respectively—prevented migration of PB T lymphocytes toward CXCL12 gradients (Fig. 6). Conversely, the profission molecule DRP1 or a dominant-negative mutant of OPA1 (K301A-OPA1) that inhibits fusion (29) stimulated PB T cell chemotaxis (Fig. 6). Similar results were obtained with Jurkat cells in response to CXCL12 and with dHL-60 cells in response to _f_MLP (not depicted). The point mutants of OPA1 and DRP1 further substantiate a specific effect of impinging on the fusion-fission equilibrium, rather than an unspecific effect of the wild-type proteins of cellular functions. The effect of OPA1 on T cell polarization and chemotaxis was further analyzed in time-lapse experiments showing that OPA1-overexpressing cells are unable to migrate toward a CXCL12 gradient (Video S7, available at http://www.jem.org/cgi/content/full/jem.20061877/DC1).
Figure 6.
Lymphocyte polarization and migration is regulated by mitochondrial shape. Mitochondrial fusion-fission constrains lymphocyte polarization and migration. PB T lymphocytes were cotransfected with mtRFP and empty vector (control) or with mtRFP and wild-type MFN1, wild-type OPA1, dominant-negative OPA1 (K301A-OPA1), wild-type DRP1, or dominant-negative DRP1 (K38A-DRP1). T cells were exposed to a CXCL12 gradient, and transmigrated cells were counted. In all the experiments, the background migration was almost absent (<0.1% of the loaded cells did migrate in the absence of chemokines) and was not modified by mitochondria manipulation. Data are representative of at least three different experiments and are expressed as mean ± SE. *, P ≤ 0.05 compared with control cells.
Mitochondrial ATP is required during T cell migration
All of these data demonstrate that fission of mitochondria, epistatic to organelle recruitment to the uropod, constrain lymphocyte polarization and migration. In neurons, mitochondria are present throughout the axon, but they accumulate where the need for ATP production is especially high (5, 6, 13). ATP can be synthesized both via oxidative phosphorylation in mitochondria and via glycolysis in the cytosol. To address whether production of mitochondrial ATP is specifically required during cell migration, we took advantage of the well-known glycolytic properties of Jurkat T cells (32, 33). Oligomycin, a specific inhibitor of the mitochondrial F1F0-ATPase, did not decrease total cellular ATP in Jurkat T cells, confirming that these cells mainly rely on glycolytic ATP production for their energetic demands (not depicted). Thus, oligomycin did not prevent chemokine-induced mitochondria redistribution, as well as cell polarization (Fig. 7 A), demonstrating that these processes do not require ATP production by mitochondria. However, under the same conditions, T cell migration was impaired, suggesting that glycolytic T cells require mitochondrial ATP production at the uropod to migrate (Fig. 7 B). Notably, oligomycin also inhibited migration of DRP1-overexpressing Jurkat T cells (Fig. 7 B), indicating that the promoting effect of DRP1 expression on lymphocyte migration is linked to its capacity to favor mitochondria concentration and, therefore, ATP production at the uropod.
Figure 7.
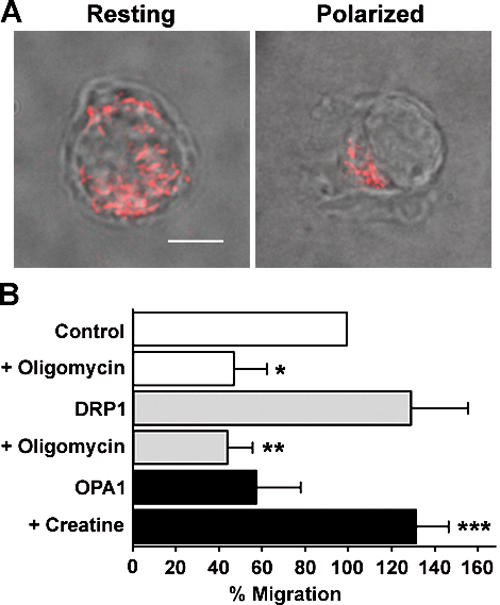
Mitochondrial ATP is required during T cell migration. (A) Oligomycin does not inhibit CXCL12-induced mitochondria redistribution to the Jurkat T cell uropod (88 cells analyzed). Bar, 5 μm. (B) Mitochondria respiration is limiting in chemotaxis. Control, DRP1-, or OPA1-overexpressing T cells were exposed to a CXCL12 gradient. After 2 h, transmigrated cells were counted. Where indicated, either Jurkat T cells were pretreated with 20 mM creatine or 0.4 μM oligomycin was added to the medium. Data are representative of three different experiments and are expressed as mean ± SE. *, P ≤ 0.05 compared with control cells; **, P ≤ 0.05 compared with untreated DRP1-overexpressing cells; ***, P ≤ 0.05 compared with untreated OPA1-overexpressing cells.
If the inhibitory effect of OPA1 on migration is cause by reduced density of mitochondria (and ATP concentration) at the uropod, we reasoned that enhancement of mitochondrial respiration by creatine should restore lymphocyte chemotaxis in OPA1-overexpressing cells. Pharmacological enhancement of mitochondrial function has been shown a valuable approach to demonstrate the relevance of mitochondrial localization for synapse density (6). Treatment of Jurkat T cells with 20 mM creatine corrected migration defects induced by OPA1 overexpression (Fig. 7 B), demonstrating that, when mitochondria are evenly distributed in the cytoplasm, the increased ATP availability in specific cell areas is limiting for chemotaxis.
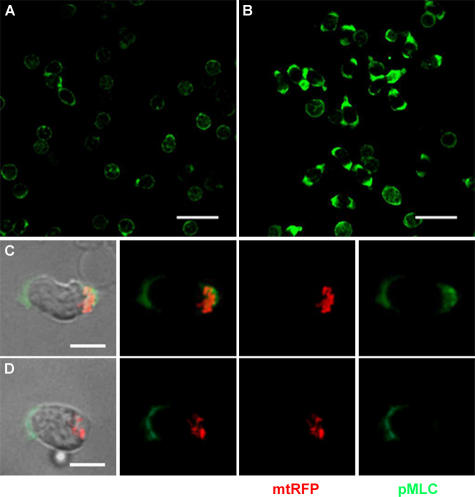
Class II myosins are heterohexamers that self-assemble into bipolar multimeric filaments and move along actin filaments in an ATP-dependent manner. This myosin filaments contract actin filaments and provide tension required for cell movement. Myosin II activity is mainly controlled through the phosphorylation of the myosin light chain (MLC), which induces a conformational change allowing actiomyosin interactions and activating its ATPase activity (34). Inhibition of the myosin II ATPase activity specifically prevents polarity and motility in T cells (35). To address whether mitochondrial ATP is required to sustain phosphorylation of the MLC at the rear of migrating cells, T cells pretreated with oligomycin were exposed to CCL21 and stained for the MLC phosphorylated form (Fig. 8). In control cells, CCL21 induced MLC phosphorylation at both the rear and the leading edges, whereas the fluorescence intensity was more intense at the cell uropod (Fig. 8, A–C). When T cells were pretreated with oligomycin, MLC phosphorylation was specifically inhibited at the cell uropod (Fig. 8 D). Collectively, these data indicate that mitochondrial ATP is essential to sustain MLC phosphorylation in migrating cells.
Figure 8.
Mitochondrial ATP is required to sustain MLC phosphorylation. (A and B) Stimulation of T cells with chemokines induces MLC phosphorylation. PB T cells unstimulated (A) or polarized with CCL21 (B) were stained with anti-pMLC antibody and analyzed by confocal microscopy. Bars, 20 μm. (C and D) Inhibition of mitochondrial ATP production results in specific loss of MLC phosphorylation at the uropod. T cells expressing the mitochondrial marker mtRFP, pretreated (D) or not (C) with oligomycin, were stimulated with 100 nM CCL21, stained with anti-pMLC antibody, and analyzed by confocal microscopy. At least 50 cells were observed and analyzed for each condition. Bars, 5 μm.
DISCUSSION
Mitochondrial shape changes are being increasingly recognized as players in the cellular processes of Ca2+ signaling and apoptosis (25, 36). Whether mitochondrial shape changes can regulate complex cellular responses remains largely unclear, albeit some indications recently emerged in neurons. Mitochondrial redistribution to dendritic protrusions supports the ability of neurons to form new excitatory synapses in response to stimulation. Inhibition of this redistribution by mitochondria-shaping proteins like OPA1 and dominant-negative DRP1 led to a decreased density of spines and synapses (6).
In this study, we unravel a previously unexpected role for these morphological adaptations in the immune system, where they master movement of lymphocytes to chemoattractants. We demonstrate that lymphocyte chemotaxis is regulated by the ability of mitochondria to relocate at the uropod and, hence, by unopposed fission of the organelles. Indeed, the lengthened mitochondria resulting from overexpression of profusion proteins (OPA1, MFN1, or mutant DRP1) or knockdown of a profission molecule (DRP1) might be too taxing for microtubule-mediated transportation to the cell uropod. In contrast, overexpression of mitochondrial profission molecules (DRP1 or mutant OPA1) or knockdown of a profusion protein (OPA1) facilitates transport of the organelles and promotes lymphocyte polarization and migration. These results indicate that redistribution of this organelle requires an unperturbed balance between fusion and fission. In more detail, conditions that shift this balance toward fusion interfere with relocation of mitochondria at the uropod. This inhibition of mitochondrial transport could reflect an inability to cargo organelles that are too large or a specific interference of the fusion-fission machinery with mitochondria-specific motors. Independent from the mechanism, when mitochondria do not relocate properly, polarization and migration is impeded.
Functional microcompartmentalization of intracellular metabolites (including adenine nucleotide) and substrates has long been recognized (10, 11). Our data indicate that accumulation of mitochondria at the uropod of a migrating cell is required to ensure high ATP in this strategic position, where class II myosin proteins, major cellular motors, are selectively localized (37).
It may be argued that, rather than for ATP, mitochondria play a key role in chemotaxis because of their capacity to sequester calcium ions. We performed several experiments to analyze the possible role of calcium signals during lymphocyte migration. First, no inhibition of lymphocyte migration toward a CXCL12 gradient was observed in a Ca2+-free medium (RPMI plus 2 mM EGTA; not depicted). Second, no specific inhibition was observed when intracellular calcium was buffered using 5, 10, or 20 μM 1,2-Bis(2-aminophenoxy)ethane-N,N,N',N'-tetraacetic acid (not depicted). Third, DT40 (B lymphocyte cell line) triple inositol 1,4,5-trisphosphate receptor–knockout cells migrated toward CXCL12 gradients as efficiently as wild-type cells (not depicted). Collectively, these data confirm that calcium signaling does not play a critical role during lymphocyte migration (38, 39).
In Drosophila neuromuscular junctions, mitochondria positioning at the synapse requires DRP1 function and is necessary to fuel the myosin ATPase that mobilizes reserve pool vesicles (13). Uropodal ATP generated by redistributed mitochondria could therefore be pivotal in fuelling the actomyosin cell motor, a key step in high-speed moving cells, such as T cells and leukocytes, in which migration likely occurs through an extrusive process based in the uropod.
MATERIALS AND METHODS
Cells.
PB T cells were sorted by negative selection using a RosetteSep kit (StemCell Technologies Inc.). Jurkat E6.1, PB T, and HL-60 cells were cultured in RPMI 1640 medium (Euroclone) supplemented with 10% FCS, 2 mM l-glutamine, 100 U/ml penicillin, and 100 μg/ml streptomycin. HL-60 cell differentiation in dimethyl sulfoxide was performed as previously described (40). MCF7 breast cancer cells from the American Type Culture Collection were maintained in MEM with 10% FCS, l-glutamine, sodium pyruvate, and nonessential amino acids. Blood from healthy donors was provided by the University Hospital (Centro Immunotrasfusionale, Padua, Italy), which approved the use of donor blood for laboratory experiments and obtained informed consent from all subjects.
Constructs and transfections.
The empty pcDNA3.1 and pMSCV were obtained from BD-Clontech. mtRFP and mtYFP plasmids, as well as the GFP targeted to the endoplasmic reticulum were a gift from T. Pozzan (Venetian Institute of Molecular Medicine, Padua, Italy). The pGFP–glycosyl phosphatidylinositol (GPI) plasmid was a gift from P. Keller (Max-Planck-Institute, Dresden, Germany). pMSCV-OPA1, pMSCV-K301A-OPA1, pCB6-MYC-MFN1, pcDNA3.1-HA-DRP1, and pcDNA3.1-HA-K38A-DRP1 plasmids were previously described (29). PHAKT-GFP was obtained as previously described (41).
Jurkat and dHL-60 cell transfection was performed as previously described (40, 41). In brief, the cDNA constructs were transfected by electroporating 50 μg DNA. In cotransfections, 20 μg of marker-carrier (GFP-GPI in transwell experiments or mtRFP in polarization experiments) plus 30 μg of empty pcDNA3.1 or pMSCV-OPA1, pMSCV-K301A-OPA1, pCB6-MYC-MFN1, pcDNA3.1-HA-DRP1, or pcDNA3.1-HA-K38A-DRP1 were used. The specific combination of plasmids transfected in each experiment is indicated in the figure legends. After 24 h, transfected cells were used for experiments (in experiments with transiently transfected cells) or were cultured in 2 mg/ml geneticin-containing medium (G418; Invitrogen) to obtain stably transfected cells.
PB T cells were transiently transfected using an eletroporation system (Amaxa Biosystems) according to the manufacturer's guidelines and were used for experiments 24 h later. MCF-7 cells were transfected with Lipofectamine Plus (Invitrogen) according to the manufacturer's instructions.
Polarization assays.
Jurkat or PB T and B cells, expressing mtRFP alone or in combination with OPA1 or DRP1, were plated on microscope slides coated with 10 μg/ml fibronectin (Sigma-Aldrich) 12 h before assay. After 4 h of serum starvation, cells were stimulated with 100 nM CXCL12 or CCL21 (PeproTech) for 15 min at 37°C. Cells were fixed in 2% paraformaldehyde for 15 min at room temperature, washed, and mounted in 2.5% 1,4-diazobicyclo[2.2.2]octane (Fluka) in a solution of 90% glycerol and 10% PBS. For pMLC or CD44 stainings, after fixation, cells were permeabilized with 0.1% Triton X-100 for 4 min at room temperature and incubated with primary (anti-pMLC2, 1:100 [Cell Signaling Technology]; anti-CD44, 1:100 [BD Biosciences]) and secondary reagents. The Cell Signaling antibody is a mouse monoclonal antibody specific for endogenous levels of MLC2 only when phosphorylated at Ser 19 (42–44). It shows cross-reactivity with the human mouse and rat pMLC2. The specificity of the pMLC2 staining was verified by treating the cells with the ROCK inhibitor Y27632, which inhibits MLC phosphorylation (not depicted).
Serum-starved mtRFP-transfected MCF7 cells seeded on vitronectin-coated eightwell chamber glass slides were stimulated for 30 min at 37°C with 20 ng/ml insulin-like growth factor–I, a chemoattractant for this cell line (45).
In some assays, T cells were pretreated with 0.12 or 0.4 μM oligomycin (Sigma-Aldrich) for 5 min at 37°C; 1 μg/ml PTx (Calbiochem) for 4 h at 37°C; 30 μM nocodazole (Sigma-Aldrich) for 1 h at 37°C; 10 μM latrunculin (Calbiochem) for 30 min at 37°C; or 100 nM wortmannin (Sigma-Aldrich) for 30 min at 37°C. All of these substances were also present during the polarization process.
Confocal microscopy.
For confocal images, microscope slides were placed on the stage of an inverted microscope (TE300; Nikon Eclipse) equipped with a spinning-disk confocal system (UltraVIEW LCI; PerkinElmer), a piezoelectric z axis motorized stage (PIFOC; Physik Instrumente), and a 12-bit charge-coupled device camera (ORCA ER; Hamamatsu Photonics). Cells expressing mtRFP were excited using the 568-nm line of the Kr/Ar laser (PerkinElmer) by using a 100× 1.3 NA Plan Fluor objective (Nikon). Emitted light was collected with a filter (HQ607/45m; Chroma Technology Corp.). Stacks of images separated by 0.3 μm along the z axis were acquired. In some experiments, the Olympus confocal system FV10 was used.
Digital images were processed using the National Institutes of Health ImageJ 1.32J and Adobe Photoshop 7.0 programs. Three-dimensional reconstruction and volume rendering of the mitochondria stacks were performed with ImageJ software.
Time-lapse confocal videomicroscopy and chemotaxis assays.
Real-time cell mitochondrial dynamics in dHL-60 or Jurkat cells were studied by time-lapse confocal microscopy, as previously described (40). In brief, starved cells were plated on fibronectin-coated chamber coverslips (Nunc) and chemotaxis assayed at 37°C by supplying 100 nM _f_MLP (Sigma-Aldrich) or 100 nM CXCL12 through a 1–2 μm micropipette controlled by a micromanipulation system (Narishige). Fluorescence and phase-contrast images were recorded every 5 s until the cell reach the pipette tip using a confocal microscope (TCS 4PI; Leica). In other experiments (Fig. 4), real-time mitochondrial dynamics in Jurkat cells were analyzed using the TILL Photonics video imaging systems (Olympus). Starved cells were plated on fibronectin-coated chamber coverslips (Nunc) and polarization assayed at 37°C by supplying 0.1 μM CXCL12. Images were processed with ImageJ software.
Migration assays.
Transiently transfected Jurkat, PB T, or dHL-60 cells were resuspended in serum-free RPMI 1640 with 0.1% BSA and seeded in the upper chamber of a transwell plate (Corning Costar). The lower chambers were filled with RPMI-BSA, with or without the chemoattractant (25 nM CXCL12 for Jurkat cells, 2.5 nM CXCL12 for PB T, and 100 nM _f_MLP for dHL-60). To discriminate between chemotaxis and chemokinesis, the same concentration of chemoattractant was added in both the upper and the lower chamber of the transwell. Transwell plates were kept at 37°C in 5% CO2 for 2 h. The lower chamber medium, containing the transmigrated cells, was recovered, and the number of cells was counted with a FACSCalibur (Becton Dickinson). In some assays, 0.4 μM oligomycin was added to the medium (in both compartments). Creatine treatment (6) was performed by culturing T cells in 20 mM creatine for 12 h.
Mitochondrial membrane potential measurements.
The mitochondrial membrane potential of Jurkat and PB T cells sorted after cotrasfection with mtRFP plasmid and empty pcDNA3.1, or pMSCV-OPA1 or pcDNA3.1-HA-DRP1, was performed as previously described (46). In brief, after cell sorting, 106 cells were resuspended in Krebs Ringer buffer (125 mM NaCl, 5 mM KCl, 1 mM Na2PO4, 1 mM MgSO4, 20 mM Hepes, pH 7.4) in the presence of 10 nM tetramethylrhodamine methyl ester (TMRM; Invitrogen) and 2 μg/ml CsH (a gift from Novartis, Basel, Switzerland). After a 30-min incubation at 37°C, TMRM fluorescence intensity was estimated by flow cytometry on a FACSCalibur before and after addition of 2 μM carbonyl cyanide 4-(trifluoro-methoxy)phenylhydrazone (Sigma-Aldrich) to the samples.
Cellular ATP measurements on lysate cells/cellular ATP assays.
Measurement of intracellular ATP content was performed using a luminometer (TD-20/20; Turner Designs) and a system bioluminescence detection kit (ENLITEN; Promega), according to the manufacturer's instructions, using cellular lysates from 2 × 10⁵ cells. ATP assay was performed in Jurkat cells preincubated with 0.12 or 0.4 μM oligomycin for 2 h or in Jurkat cells expressing OPA1 or DRP1.
Statistical analysis.
Image analysis was performed blind to the treatment conditions. For each experimental condition, 20 or 30 confocal cell images were randomly taken from different wells of the microscope slide. After processing, images were observed and classified by three different operators. All data are expressed as means ± SE, as indicated in the figure legends. All analyses were performed in triplicate or greater, and means obtained were used for independent Student's t tests (Microsoft Office and Origin 7.0 Professional). All of the experiments were repeated at least three times. p-values to set statistical significance are specifically indicated in the figure legends.
For cytometric analyses, the Kolmogorov-Smirnov test for analysis of histograms was used according to the CellQuest software guide (BD Biosciences), with D/s values >10 considered significant.
Online supplemental material.
To show mitochondria relocation at the rear edge of polarized cells, we performed three-dimensional reconstructions of resting (Video S1) or polarized (Video S2) Jurkat T cells expressing the mitochondrial marker mtRFP. Fig. S1 shows mitochondria accumulation at the rear edge of polarized MCF7 cells (A and B) and human B lymphocytes (C and D), indicating that relocation of the organelles upon cell polarization is not restricted to lymphocytes. Video S3 shows real-time mitochondrial dynamics in dHL-60 cells migrating toward a chemoattractant gradient.
To alter mitochondria morphology in T cells, we expressed profission or profusion proteins. Videos S3–S5 represent three-dimensional reconstructions of mitochondria in cells transfected with mtRFP and empty vector (Video S3), mtRFP and DRP1 (Video S4), or mtRFP and OPA1 (Video S5). Figs. S2 and S3 indicate that mitochondria-shaping proteins do not alter mitochondrial membrane potential (Fig. S2) and intracellular ATP concentration (Fig. S3). Finally, Video S7 shows that T cells expressing OPA1 do not polarize their mitochondria and do not migrate toward a chemoattractant gradient. Online supplemental material is available at http://www.jem.org/cgi/content/full/jem.20061877/DC1.
Supplemental Material
[Supplemental Material Index]
Acknowledgments
We thank A. Cabrelle for cell sorting; F. Sanchez-Madrid, S. Cipolat, and O. Martins de Brito for suggestions; and T. Pozzan and C. Martinez-A for critical reading of the manuscript.
This work was supported by grants from the Italian Association for Cancer Research (to A. Viola).
The authors have no conflicting financial interests.
Abbreviations used: AKTPH-GFP, pleckstrin homology domain of AKT fused to GFP; CCL, CC chemokine ligand; CXCL, CXC chemokine ligand; dHL-60, differentiated HL-60; Drp1, dynamin-related protein 1; _f_MLP, _N_-formyl-Met-Leu-Phe; Mfn, mitofusin; MLC, myosin light chain; MTOC, microtubule organizing center; mtRFP and mtYFP, mitochondrially targeted red fluorescent protein and yellow fluorescent protein, respectively; PB T cell, peripheral blood T cell; PI3K, phosphoinositide 3–kinase; PTx, Pertussis toxin.
References
- 1.Lauffenburger, D.A., and A.F. Horwitz. 1996. Cell migration: a physically integrated molecular process. Cell. 84:359–369. [DOI] [PubMed] [Google Scholar]
- 2.Sanchez-Madrid, F., and M.A. del Pozo. 1999. Leukocyte polarization in cell migration and immune interaction. EMBO J. 18:501–511. [DOI] [PMC free article] [PubMed] [Google Scholar]
- 3.del Pozo, M.A., M. Nieto, J.M. Serrador, D. Sancho, M. Vicente-Manzanares, C. Martinez, and F. Sanchez-Madrid. 1998. The two poles of lymphocyte: specialized cell compartments for migration and recruitment. Cell Adhes. Commun. 6:125–133. [DOI] [PubMed] [Google Scholar]
- 4.Griparic, L., and A.M. van der Bliek. 2001. The many shapes of mitochondrial membranes. Traffic. 2:235–244. [DOI] [PubMed] [Google Scholar]
- 5.Morris, R.L., and P.J. Hollenbeck. 1993. The regulation of bidirectional mitochondrial transport is coordinated with axonal outgrowth. J. Cell Sci. 104:917–927. [DOI] [PubMed] [Google Scholar]
- 6.Li, Z., K.I. Okamoto, Y. Hayashi, and M. Sheng. 2004. The importance of dendritic mitochondria in the morphogenesis and plasticity of spines and synapses. Cell. 119:873–887. [DOI] [PubMed] [Google Scholar]
- 7.Scorrano, L. 2005. Proteins that fuse and fragment mitochondria in apoptosis: con-fissing a deadly con-fusion? J. Bioenerg. Biomembr. 37:165–170. [DOI] [PubMed] [Google Scholar]
- 8.Hollenbeck, P.J., and W.M. Saxton. 2005. The axonal transport of mitochondria. J. Cell Sci. 118:5411–5419. [DOI] [PMC free article] [PubMed] [Google Scholar]
- 9.Varadi, A., L.I. Johnson-Cadwell, V. Cirulli, Y. Yoon, V.J. Allan, and G.A. Rutter. 2004. Cytoplasmic dynein regulates the subcellular distribution of mitochondria by controlling the recruitment of the fission factor dynamin-related protein-1. J. Cell Sci. 117:4389–4400. [DOI] [PubMed] [Google Scholar]
- 10.Paul, R.J. 1983. Functional compartmentalization of oxidative and glycolytic metabolism in vascular smooth muscle. Am. J. Physiol. 244:C399–C409. [DOI] [PubMed] [Google Scholar]
- 11.Ventura-Clapier, R., V. Veksler, and J.A. Hoerter. 1994. Myofibrillar creatine kinase and cardiac contraction. Mol. Cell. Biochem. 133:125–144. [DOI] [PubMed] [Google Scholar]
- 12.Kaasik, A., V. Veksler, E. Boehm, M. Novotova, A. Minajeva, and R. Ventura-Clapier. 2001. Energetic crosstalk between organelles: architectural integration of energy production and utilization. Circ. Res. 89:153–159. [DOI] [PubMed] [Google Scholar]
- 13.Verstreken, P., C.V. Ly, K.J. Venken, T.W. Koh, Y. Zhou, and H.J. Bellen. 2005. Synaptic mitochondria are critical for mobilization of reserve pool vesicles at Drosophila neuromuscular junctions. Neuron. 47:365–378. [DOI] [PubMed] [Google Scholar]
- 14.del Pozo, M.A., P. Sanchez-Mateos, M. Nieto, and F. Sanchez-Madrid. 1995. Chemokines regulate cellular polarization and adhesion receptor redistribution during lymphocyte interaction with endothelium and extracellular matrix. Involvement of cAMP signaling pathway. J. Cell Biol. 131:495–508. [DOI] [PMC free article] [PubMed] [Google Scholar]
- 15.Servant, G., O.D. Weiner, P. Herzmark, T. Balla, J.W. Sedat, and H.R. Bourne. 2000. Polarization of chemoattractant receptor signaling during neutrophil chemotaxis. Science. 287:1037–1040. [DOI] [PMC free article] [PubMed] [Google Scholar]
- 16.Mellado, M., J.M. Rodriguez-Frade, S. Manes, and C. Martinez-A. 2001. Chemokine signaling and functional responses: the role of receptor dimerization and TK pathway activation. Annu. Rev. Immunol. 19:397–421. [DOI] [PubMed] [Google Scholar]
- 17.Mellado, M., J.M. Rodriguez-Frade, A.J. Vila-Coro, S. Fernandez, A. Martin de Ana, D.R. Jones, J.L. Toran, and C. Martinez-A. 2001. Chemokine receptor homo- or heterodimerization activates distinct signaling pathways. EMBO J. 20:2497–2507. [DOI] [PMC free article] [PubMed] [Google Scholar]
- 18.Molon, B., G. Gri, M. Bettella, C. Gomez-Mouton, A. Lanzavecchia, C. Martinez-A., S. Manes, and A. Viola. 2005. T cell costimulation by chemokine receptors. Nat. Immunol. 6:465–471. [DOI] [PubMed] [Google Scholar]
- 19.Rudolph, U., M.J. Finegold, S.S. Rich, G.R. Harriman, Y. Srinivasan, P. Brabet, G. Boulay, A. Bradley, and L. Birnbaumer. 1995. Ulcerative colitis and adenocarcinoma of the colon in G alpha i2-deficient mice. Nat. Genet. 10:143–150. [DOI] [PubMed] [Google Scholar]
- 20.Ward, S.G. 2004. Do phosphoinositide 3-kinases direct lymphocyte navigation? Trends Immunol. 25:67–74. [DOI] [PubMed] [Google Scholar]
- 21.Van Haastert, P.J., and P.N. Devreotes. 2004. Chemotaxis: Signalling the way forward. Nat. Rev. Mol. Cell Biol. 5:626–634. [DOI] [PubMed] [Google Scholar]
- 22.Pollard, T.D., and G.G. Borisy. 2003. Cellular motility driven by assembly and disassembly of actin filaments. Cell. 112:453–465. [DOI] [PubMed] [Google Scholar]
- 23.Etienne-Manneville, S. 2004. Actin and microtubules in cell motility: which one is in control? Traffic. 5:470–477. [DOI] [PubMed] [Google Scholar]
- 24.Welte, M.A. 2004. Bidirectional transport along microtubules. Curr. Biol. 14:R525–R537. [DOI] [PubMed] [Google Scholar]
- 25.Karbowski, M., and R.J. Youle. 2003. Dynamics of mitochondrial morphology in healthy cells and during apoptosis. Cell Death Differ. 10:870–880. [DOI] [PubMed] [Google Scholar]
- 26.Smirnova, E., L. Griparic, D.L. Shurland, and A.M. van der Bliek. 2001. Dynamin-related protein Drp1 is required for mitochondrial division in mammalian cells. Mol. Biol. Cell. 12:2245–2256. [DOI] [PMC free article] [PubMed] [Google Scholar]
- 27.Yoon, Y., E.W. Krueger, B.J. Oswald, and M.A. McNiven. 2003. The mitochondrial protein hFis1 regulates mitochondrial fission in mammalian cells through an interaction with the dynamin-like protein DLP1. Mol. Cell. Biol. 23:5409–5420. [DOI] [PMC free article] [PubMed] [Google Scholar]
- 28.Chen, H., S.A. Detmer, A.J. Ewald, E.E. Griffin, S.E. Fraser, and D.C. Chan. 2003. Mitofusins Mfn1 and Mfn2 coordinately regulate mitochondrial fusion and are essential for embryonic development. J. Cell Biol. 160:189–200. [DOI] [PMC free article] [PubMed] [Google Scholar]
- 29.Cipolat, S., O. Martins de Brito, B. Dal Zilio, and L. Scorrano. 2004. OPA1 requires mitofusin 1 to promote mitochondrial fusion. Proc. Natl. Acad. Sci. USA. 101:15927–15932. [DOI] [PMC free article] [PubMed] [Google Scholar]
- 30.Frieden, M., D. James, C. Castelbou, A. Danckaert, J.C. Martinou, and N. Demaurex. 2004. Ca2+ homeostasis during mitochondrial fragmentation and perinuclear clustering induced by hFis1. J. Biol. Chem. 279:22704–22714. [DOI] [PubMed] [Google Scholar]
- 31.Smirnova, E., D.L. Shurland, S.N. Ryazantsev, and A.M. van der Bliek. 1998. A human dynamin-related protein controls the distribution of mitochondria. J. Cell Biol. 143:351–358. [DOI] [PMC free article] [PubMed] [Google Scholar]
- 32.Makowska, A., K. Zablocki, and J. Duszynski. 2000. The role of mitochondria in the regulation of calcium influx into Jurkat cells. Eur. J. Biochem. 267:877–884. [DOI] [PubMed] [Google Scholar]
- 33.Aronis, A., J.A. Melendez, O. Golan, S. Shilo, N. Dicter, and O. Tirosh. 2003. Potentiation of Fas-mediated apoptosis by attenuated production of mitochondria-derived reactive oxygen species. Cell Death Differ. 10:335–344. [DOI] [PubMed] [Google Scholar]
- 34.Tan, J.L., S. Ravid, and J.A. Spudich. 1992. Control of nonmuscle myosins by phosphorylation. Annu. Rev. Biochem. 61:721–759. [DOI] [PubMed] [Google Scholar]
- 35.Jacobelli, J., S.A. Chmura, D.B. Buxton, M.M. Davis, and M.F. Krummel. 2004. A single class II myosin modulates T cell motility and stopping, but not synapse formation. Nat. Immunol. 5:531–538. [DOI] [PubMed] [Google Scholar]
- 36.Szabadkai, G., A.M. Simoni, M. Chami, M.R. Wieckowski, R.J. Youle, and R. Rizzuto. 2004. Drp-1-dependent division of the mitochondrial network blocks intraorganellar Ca2+ waves and protects against Ca2+-mediated apoptosis. Mol. Cell. 16:59–68. [DOI] [PubMed] [Google Scholar]
- 37.Li, Z., H. Jiang, W. Xie, Z. Zhang, A.V. Smrcka, and D. Wu. 2000. Roles of PLC-β2 and β3 and PI3Kγ in chemoattractant-mediated signal transduction. Science. 287:1046–1049. [DOI] [PubMed] [Google Scholar]
- 38.Eddy, R.J., L.M. Pierini, F. Matsumura, and F.R. Maxfield. 2000. Ca2+-dependent myosin II activation is required for uropod retraction during neutrophil migration. J. Cell Sci. 113:1287–1298. [DOI] [PubMed] [Google Scholar]
- 39.Cinamon, G., V. Shinder, and R. Alon. 2001. Shear forces promote lymphocyte migration across vascular endothelium bearing apical chemokines. Nat. Immunol. 2:515–522. [DOI] [PubMed] [Google Scholar]
- 40.Lacalle, R.A., C. Gomez-Mouton, D.F. Barber, S. Jimenez-Baranda, E. Mira, C. Martinez-A., A.C. Carrera, and S. Manes. 2004. PTEN regulates motility but not directionality during leukocyte chemotaxis. J. Cell Sci. 117:6207–6215. [DOI] [PubMed] [Google Scholar]
- 41.Gomez-Mouton, C., R.A. Lacalle, E. Mira, S. Jimenez-Baranda, D.F. Barber, A.C. Carrera, C. Martinez-A., and S. Manes. 2004. Dynamic redistribution of raft domains as an organizing platform for signaling during cell chemotaxis. J. Cell Biol. 164:759–768. [DOI] [PMC free article] [PubMed] [Google Scholar]
- 42.Totsukawa, G., Y. Yamakita, S. Yamashiro, D.J. Hartshorne, Y. Sasaki, and F. Matsumura. 2000. Distinct roles of ROCK (Rho-kinase) and MLCK in spatial regulation of MLC phosphorylation for assembly of stress fibers and focal adhesion in 3T3 fibroblasts. J. Cell Biol. 150:797–806. [DOI] [PMC free article] [PubMed] [Google Scholar]
- 43.Sakurada, K., M. Seto, and Y. Sasaki. 1998. Dynamics of myosin light chain phosphorylation at Ser19 and Thr18/Ser19 in smooth muscle cells in culture. Am. J. Physiol. 274:C1563–C1572. [DOI] [PubMed] [Google Scholar]
- 44.Wang, Y.X., Y.J. Ding, Y.Z. Zhu, Y. Shi, T. Yao, and Y.C. Zhu. 2006. Role of PKC in the novel synergistic action of urotensin II and angiotensin II and in urotensin II-induced vasoconstriction. Am. J. Physiol. Heart Circ. Physiol. 10.1152/ajpheart.00512.2006. [DOI] [PubMed]
- 45.Manes, S., E. Mira, C. Gomez-Mouton, R.A. Lacalle, P. Keller, J.P. Labrador, and C. Martinez-A. 1999. Membrane raft microdomains mediate front-rear polarity in migrating cells. EMBO J. 18:6211–6220. [DOI] [PMC free article] [PubMed] [Google Scholar]
- 46.Scorrano, L., S.A. Oakes, J.T. Opferman, E.H. Cheng, M.D. Sorcinelli, T. Pozzan, and S.J. Korsmeyer. 2003. BAX and BAK regulation of endoplasmic reticulum Ca2+: a control point for apoptosis. Science. 300:135–139. [DOI] [PubMed] [Google Scholar]
Associated Data
This section collects any data citations, data availability statements, or supplementary materials included in this article.
Supplementary Materials
[Supplemental Material Index]
