Transcription factor FoxO1, the dominant mediator of muscle wasting in chronic kidney disease, is inhibited by microRNA-486 (original) (raw)
. Author manuscript; available in PMC: 2013 Feb 1.
Published in final edited form as: Kidney Int. 2012 Aug;82(4):401–411. doi: 10.1038/ki.2012.84
Abstract
Chronic kidney disease (CKD) accelerates muscle protein degradation by stimulating the ubiquitin proteasome system through activation of the E3 ligases, Atrogin-1/MaFbx and MuRF-1. Forkhead transcription factors (FoxO) can control the expression of these E3 ligases, but the contribution of individual FoxOs to muscle wasting is unclear. To study this we created mice with a muscle-specific FoxO1 deletion. The absence of FoxO1 blocked 70% of the increase in E3 ligases induction by CKD as well as the proteolysis and loss of muscle mass. Thus, FoxO1 has a role in controlling ubiquitin proteasome system-related proteolysis. Since microRNA (miR)-486 reportedly dampens FoxO1 expression and its activity, we transfected a miR-486 mimic into primary cultures of myotubes and found this blocked dexamethasone-stimulated protein degradation without influencing protein synthesis. It also decreased FoxO1 protein translation and increased FoxO1 phosphorylation by down-regulation of PTEN phosphatase, a negative regulator of p-Akt. To test its efficacy in vivo, we electroporated miR-486 into muscles and found expression of the E3 ligases was suppressed and muscle mass increased despite CKD. Thus, FoxO1 is a dominant mediator of CKD-induced muscle wasting and miR-486 coordinately decreases FoxO1 and PTEN to protect against this catabolic response.
Keywords: Chronic kidney disease (CKD), microRNA, miR-486, FoxO1, muscle wasting
Introduction
It has been known for decades that chronic kidney disease (CKD) and its complications (e.g. metabolic acidosis, excess glucocorticoid production and angiotensin II or impaired insulin/IGF-1 signaling) stimulate the loss of muscle protein. Understanding mechanisms for muscle wasting is needed to design treatments as it is associated with increased morbidity and mortality. One mechanism involves activation of caspase-3 which can cleave the complex structure of muscle to produce substrates for the ubiquitin-proteasome system (UPS) [1-3]. Caspase-3 also increases the proteolytic activity of the proteasome [4]. Regarding mechanisms, there is evidence that a common group of biochemical and transcriptional adaptations in muscle cells stimulate muscle wasting in different conditions [5;6]. For example, increased expression of E3 ubiquitin ligases, Atrogin-1/MAFbx and MuRF-1 act to accelerate muscle protein degradation via the UPS [7;8]. Stimuli that increase the expression of Atrogin-1/MAFbx and MuRF-1 include changes in PI3K/Akt/FoxO signaling because a reduced activity of PI3K (e.g., insulin resistance) will decrease the phosphorylation of Akt and its downstream effectors, such as forkhead transcription factors (FoxOs). Dephosphorylated FoxOs can enter the nucleus to promote the expression of Atrogin-1/MAFbx and MuRF-1, increasing in muscle proteolytic activity via the UPS [2;9;10]. Insulin and IGF-1 signaling affect muscle protein metabolism by changing insulin receptor substrates (IRSs) and/or isoforms of Akt (Akt1, Akt2 and Akt3) plus differences in FoxOs.
In skeletal muscle, there are three FoxO transcription factors, FoxO1, FoxO3a and FoxO4 and in a murine model of starvation or disuse-induced muscle atrophy, FoxO3a was found to up-regulate Atrogin-1/MAFbx [10;11]. In contrast, in model of high dose of dexamethasone (Dex) or sepsis-induce muscle wasting, FoxO1 was shown to mediate Atrogin-1/MAFbx and MuRF-1 transcription [9;12]. In another report, FoxO4 was linked to TNF-α-induced expression of Atrogin-1/MAFbx in C2C12 myotubes [13]. These data indicate that different members of the FoxO family respond to various catabolic conditions by promoting Atrogin-1/MAFbx and MuRF-1 expression.
The recent discoveries of mechanisms mediated by small microRNAs (miRNAs) suggest a potential means of interfering with muscle catabolism. miRNAs act by targeting sequences in the 3′untranslational region of mRNAs to inhibit translation or to increase the degradation of mRNA, limiting the expression of specific proteins. The responses to miRNAs are complex, however, because individual miRNAs can target several mRNAs while an individual mRNA can be targeted by more than one miRNA. This diversity might explain why an individual protein is not routinely inhibited in response to a miRNA [14]. Second, microRNAs are expressed in a tissue-specific manner [15] and in muscle, the expression profiles of miRNAs can change dramatically in diseases affecting muscle [16-18]. For example, miR-1 and miR-206 are induced during differentiation of satellite cells or primary myoblasts while miR-29 was found to regulate the translation of the Ying-Yang protein, improving muscle cell proliferation [19;20]. Our interest in miRNAs was stimulated by the report that miR-486 can modulate PI3K/Akt signaling in cardiomyocytes by targeting the phosphatase and tensin homolog (PTEN) and FoxO1. In that report, changes in protein metabolism were not evaluated [21]. We have examined how miR-486 influences muscle metabolism because FoxO1 and PTEN activities might affect muscle protein turnover [2;22]. Specifically, we studied whether muscle-specific deletion of FoxO1 would blunt CKD-induced muscle wasting. A role of FoxO1 was confirmed so we examined if miR-486 could improve muscle mass in mice with CKD.
RESULTS
Muscle-specific FoxO1 knockout (MFKO) protects against CKD-induced muscle wasting
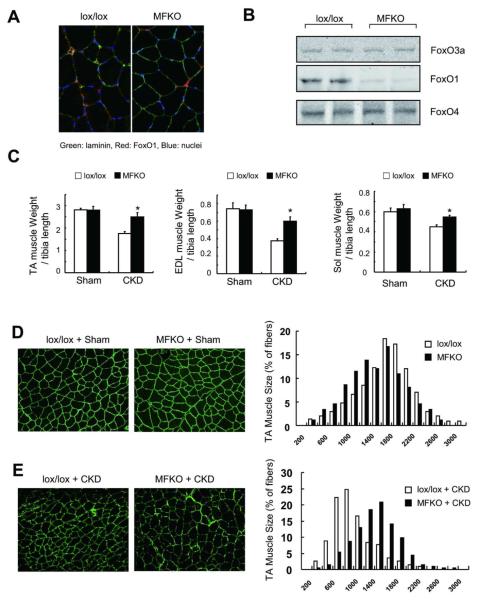
To examine the relationship between FoxO1 and Atrogin-1/MurF-1 expression, we generated mice with muscle-specific knockout of FoxO1 (MFKO). These mice grow normally and their muscles exhibit a normal distribution of myofiber sizes (Figure 1A and D), Using western blots and immunostaining, we confirmed that FoxO1 is absent in myofibers from MFKO mice (Figure 1A). Importantly, deletion of FoxO1 did not alter the expression of FoxO3a or of FoxO4 (Figure 1B) and when CKD was induced in MFKO mice, there was no significant loss of muscle mass in tibialis anterior (TA), extensor digitorum longus (EDL) or soleus (Sol) muscles. In contrast, CKD did decrease the weights of muscles from lox/lox, control mice (Figure 1 C). These changes were confirmed by an analysis of cross-sectional areas of myofibers in TA muscles (Figure 1, E).
Fig 1. Muscle-specific FoxO1 knockout (MFKO) prevents CKD-induced muscle atrophy.
A: FoxO1 protein is absent in myofibers of MFKO mice as assessed by immunostaining.
B: Western blot of muscles form MFKO mice revealed that FoxO1 was markedly decreased while FoxO3a and FoxO4 levels were unchanged.
C: muscle mass was evaluated by muscle weight normalized to tibia bone length, MFKO prevented the loss of weight of tibialis anterior (TA), extensor digitorum longus (EDL) and soleus (Sol) muscles in CKD mice (*, p<0.05 vs. lox/lox +CKD, n=5).
D: The distribution of muscle fiber sizes in control (lox/lox) or MFKO mice was identical (n = 3, >200 myofibers in each mouse were examined).
E: The leftward-shift of muscle fiber sizes in lox/lox mice with CKD was prevented in MFKO mice with CKD (n = 5, >200 myofibers in each mouse were examined).
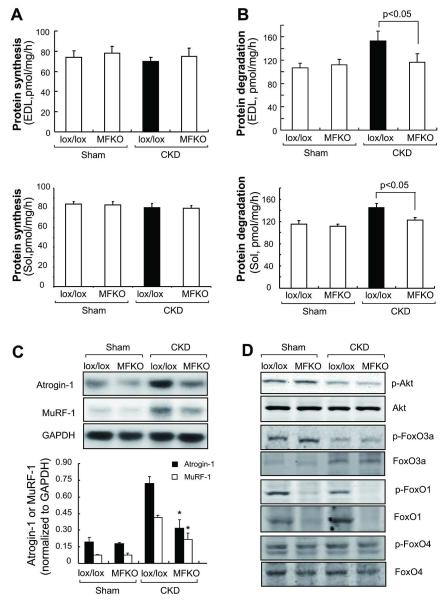
To explore why CKD did not induce muscle atrophy in MFKO mice, we measured the protein synthesis and degradation rates EDL and Sol muscles. CKD did not significantly suppress protein synthesis in muscles from lox/lox or MFKO mice when compared to values in muscles of the respective control mice (Figure 2A). In contrast, CKD stimulated protein degradation in muscles of lox/lox mice but not in muscles of MFKO mice (Figure 2B). In TA and Sol muscles of lox/lox mice, CKD also induced the expression Atrogin-1/MAFbx and MuRF-1 (Figure 2C and Supplemental Figure 1B). As with protein degradation, the expression of these E3 ligases was suppressed in mice with muscle-specific FoxO1 knockout. Importantly, these responses occurred even though the muscle levels of p-Akt or the presence of FoxO3a and FoxO4 did not change (Figure 2D).
Fig 2. Proteolysis and ubiquitin E3 ligases were largely blocked in muscles of MFKO mice with CKD.
A: the absence of FoxO1 minimally influenced the rates of protein synthesis in EDL and Sol muscles (n = 5).
B: Rates of protein degradation in EDL and Sol muscles of MFKO and lox/lox mice indicated that deletion of FoxO1 suppressed the increase in muscle proteolysis stimulated by CKD (n = 5 in).
C: The expression of Atrogin-1/MAFbx and MuRF-1 mRNAs in TA muscles was accessed by northern blotting. The increased expression of Atrogin-1/MAFbx and MuRF-1 in muscle of CKD, lox/lox mice were eliminated in muscles of MFKO mice with CKD (*, p<0.01 vs. lox/lox+CKD, n = 5).
D: Phosphorylation of Akt and FoxOs transcription factors were examined by western blotting. CKD suppressed the p-Akt (Ser 473) and p-FoxO1 (Thr 24) and FoxO3a (Thr 32), but did not change the p-FoxO4 (Ser 262) in muscles of lox/lox and MFKO mice.
In another model of muscle catabolism, we treated MFKO mice with a pharmacologic dose of dexamethasone (Dex, 5mg/kg/day) [23]. After 2-weeks, the distribution of myofiber sizes in TA muscles of lox/lox mice were shifted to the left. This response was largely blocked in muscle of MFKO mice (Supplemental Figure 2A). In muscles of lox/lox mice, Dex elicited the expected increase in Atrogin-1/MAFbx and MurF-1 mRNAs. These catabolic responses were largely suppressed in muscles of MFKO mice (Supplemental Figure 2B). Thus, FoxO1 is a dominant transcription factor acting to stimulate muscle atrophy in at least two catabolic conditions (CKD or high dose of glucocorticoid administration).
The influence of miR-486 on protein synthesis and degradation in muscle cells
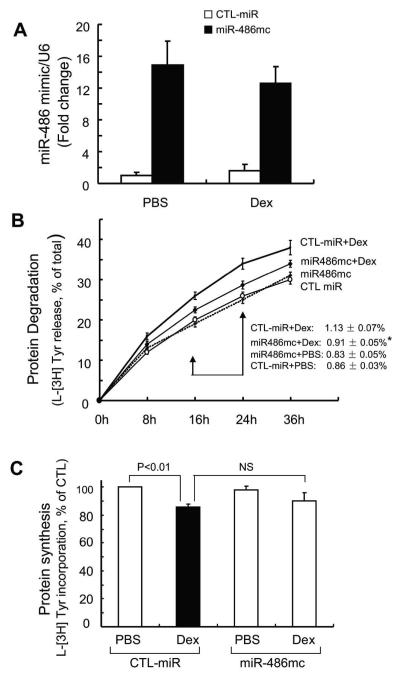
Because PTEN [2] and FoxO1 (Figure 1) influence muscle protein wasting, we hypothesized that enhancing miR-486 in muscle might improve muscle protein turnover. To examine this hypothesis, we first introduced a miR-486 “mimic” into primary cultures of mouse skeletal muscle cells and measured the rates of protein synthesis and degradation. In transfected primary culture of myotubes, the miR-486 mimic increased more than 12-fold compared to cells transfected with control miRNA (Figure 3A). Following treatment with Dex, the miR-486 mimic significantly dampened proteolysis (Figure 3B). Dex also suppressed protein synthesis in cultured myotubes and transfection of these cells with miR-486 mimic tended to counteract this response (Figure 3C). These results demonstrate that enhancing miR-486 can suppress Dex-stimulated muscle protein degradation.
Fig 3. miR-486 blocked Dex-stimulated protein degradation in myotubes.
A: the miR-486 mimic (miR-486mc) was transfected into a primary culture of myotubes and the efficiency of transfection was assessed with q-Real time PCR. The miR-486 mimic increased more than 12-fold compared to results in cells transfected with control miRNA (CTL-miR).
B: the miR-486 mimic suppressed muscle proteolysis stimulated by Dex. Primary culture of myotubes (transfected with miR-486mimic or CTL-miR) were incubated with [3H] tyrosine overnight and then treated with PBS or 2 m Dex. The released radioactivity (indicating proteins degraded) was plotted as a percentage of total [3H] tyrosine incorporated into cell proteins. The rates of proteolysis (calculated from the linear slopes between 16 and 24 hr) are shown. Measurements were done in duplicate and independently repeated tree times (*, p<0.05 vs. CTL-miR+Dex).
C: miR-486 mimic exerted minimal changes in protein synthesis in primary culture of myotubes. Protein synthesis was measured as the incorporation of [3H]-tyrosine after treatment with or without Dex (2 M). Measurements were done in duplicate and independently repeated 3 times.
MiR-486 suppresses glucocorticoid-induced expression of Atrogin-1/MAFbx and MurF-1
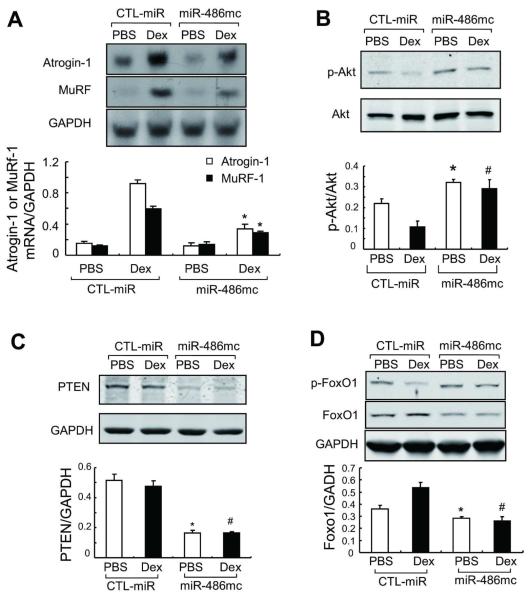
Since the E3 ubiquitin ligases, Atrogin-1/MAFbx and MurF-1, are intimately involved in the UPS-mediated muscle proteolysis, we examined whether enhancing miR-486 in muscle cells would suppress expression of these E3 ubiquitin ligases. In primary cultures of muscle cells, Dex produced the expected increase in Atrogin-1/MAFbx and MurF-1 mRNAs in myotubes. The increase in these E3 ubiquitin ligases was suppressed by the miR-486 mimic (Figure 4A). Likewise, introduction of the miR-486 mimic blocked the suppression of Akt phosphorylation induced by Dex (Figure 4B). Because miR-486 can target the 3′-UTR of PTEN [22], we measured the PTEN protein in myotubes. The miR-486 mimic significantly decreased the level of PTEN protein (Figure 4C). A decrease in PTEN induced by the miR-486 mimic would raise p-Akt by inhibiting PTEN expression and this response in turn would be a mechanism that suppresses Atrogin-1/MAFbx expression.
Fig 4. miR-486 suppresses Dex-stimulated Atrogin-1/MAFbx and MuRF-1 expression.
A: Atrogin-1/ MAFbx and MuRF-1 expression in primary cultures of myotubes were determined by northern blot. mRNAs of the ubiquitin E3 ligases in response to Dex was blocked by the miR-486mimic (*, p<0.01 vs. CTL-miR+Dex, n=5).
B: The levels of p-Akt (ser 473) and PTEN in these myotubes were assessed by western blotting.
C: The increase in p-Akt was associated with a decrease in PTEN content in myotubes transfected with miR-486 mimic.
D: The miR-486mimic stimulated the phosphorylation of FoxO1 and decreased the FoxO1 protein content. *, p<0.01 vs. CTL-miR+PBS; #, p<0.01 vs. CTL-miR+Dex; n=5.
The downstream target of p-Akt, FoxO1 has been shown to influence MuRF-1 transcription by binding to MuRF-1 promoter or acting synergistically with the glucocorticoid receptor [24]. We found that Dex not only decreased the levels of p-FoxO1 but also up-regulated FoxO1 in muscle cells; transfection with the miR-486 mimic reversed these responses (Figure 4D). The results confirm that FoxO1 and PTEN are targets of miR-486 in skeletal muscle cells. They also demonstrate that miR-486 can suppress both Atrogin-1/MAFbx and MuRF-1 expression by repressing FoxO1.
Enhancing miR-486 protects against CKD-induced loss of skeletal muscle
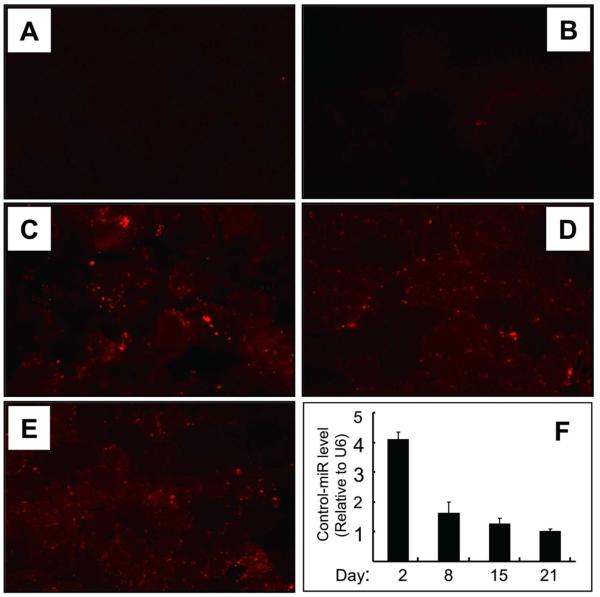
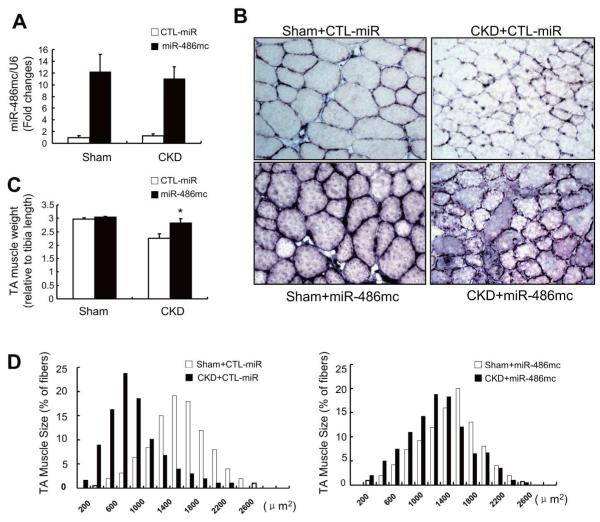
We examined if CKD influences miR-486 expression in muscle and found significant decrease in miR-486 in muscles of CKD mice (Supplemental Figure 3A). Because our in vitro experiments showed that miR-486 suppresses muscle protein degradation by enhancing PI3K/Akt signaling, we hypothesized that enhancing miR-486 might block muscle wasting in CKD mice. To test this possibility, we transfected either the miR-486 mimic or a control miRNA into TA muscles of normal and CKD mice using electroporation. First we validated this process by electroporating Dy547-labeled C. elegans microRNA (a control miRNA) into TA muscles and examined the fluorescence intensity in muscle fibers. As shown in Figure 5, few of the myofibers exhibited fluorescence without electroporation. With electroporation, however, the fluorescence of Dy547-labeled control miRNA was present in more than 70% of myofibers, the expression of this control miRNA lasted at least 3 weeks as assessed by real-time PCR (Figure 5F, bar graph). We also detected a >10-fold increase in miR-486 in TA muscles at two weeks after electroporation of the miR-486 mimic (Figure 6A). As with the control miRNA, the miR-486 mimic was detected in > 70% of myofibers by in situ hybridization (Figure 6B and Supplemental Figure 3B). Importantly, muscle mass (assessed as the ratio of TA muscle weight to tibia bone length) in CKD mice was significantly increased when muscles were electroporated with the miR-486 mimic (Figure 6C). This result was confirmed by finding a rightward shift in the distribution of the cross-sectional areas of myofibers when compared to results in muscles electroporated with the control miRNA (Figure 6D).
Fig 5. Validation of miRNA electroporation in vivo.
TA muscles were injected with Dy547-labeled, control miRNA (cel-miR-67) and the efficiency of transfection was assessed by measuring fluorescence (A to E).
A: TA muscles injected with saline or B: injected with Dy547-labeled, control miRNA without electroporation.
C: At 2 days after electroporation, Dy547-labeled miRNA was present in myofibers. The fluorescence was detected at 8 and 15 days after electroporation (D and E).
F: the cel-miR-67 miRNA levels were examined by RT-PCR.
Fig 6. Enhancing miR-486 protects against CKD-induced loss of skeletal muscle.
A: TA muscles of sham-operated control, lox/lox (Sham) or CKD mice ( FVB background) were transfected with control miRNA (CTL-miR) or miR-486 mimic (miR-486mc). miR-486 mimic was detected by RT-PCR at 2-weeks after electroporation.
B: The cross-sectional area of myofibers in TA muscles following electroporation with the miR-486 mimic or CTL-miR are shown, In situ hybridization revealed that miR-486 was present in myofibers of TA muscles.
C: The weight of TA muscles (factored by tibia length) was improved in CKD mice transfected with miR-486mimic (*, p<0.05; n = 5 in each group).
D: The distribution of myofiber sizes in muscles from sham and CKD mice treated with CTL-miR or miR-486 mimic. Data were obtained from 7 animals in each group.
miR-486 decreases FoxO1 protein and promotes FoxO1 phosphorylation to suppress E3 ubiquitin ligases
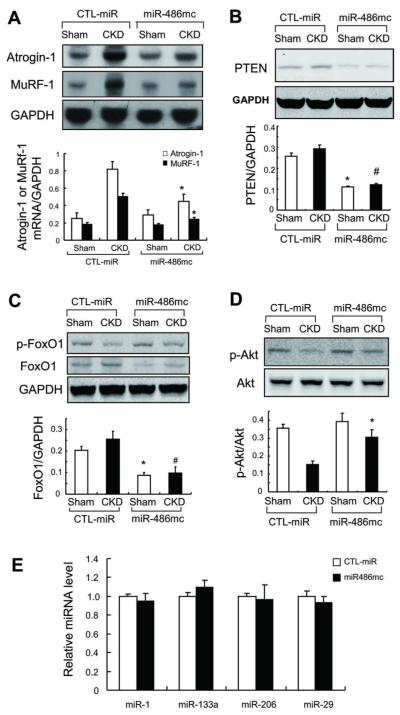
The expression of both Atrogin-1/MAFbx and MurF-1 also decreased in muscles electroporated with the miR-486 mimic (Figure 7A). To assess how it might br related to PI3K/Akt signaling in skeletal muscle, we examined FoxO1 and PTEN proteins in TA muscles electroporated with the miR-486 mimic. There was a decrease in both FoxO1 and PTEN proteins compared to results in muscles treated with control miRNA (Figure 7B, C). This was accompanied by phosphorylation of Akt at the serine 473 site plus the expected increase in phosphorylation of FoxO1 (Figure 7C, D). We also analyzed the expression of miR-1, miR-133, miR-29 and 206, because these muscle-enriched miRNAs are reported to affect skeletal muscle growth [20;25]. Expression of these miRNAs did not significantly change when the miR-486 mimic was electroporated into muscle compared to results obtained in TA muscles electroporated with control miRNA (Figure 7E). Thus, the improvement in muscle mass in CKD mice following treatment with miR-486 mimic was mainly due to an enhanced level of miR-486.
Fig 7. miR-486 suppresses the expression of ubiquitin E3 ligases in muscles of CKD mice.
A: The expression of Atrogin-1/MAFbx and MuRF-1 mRNAs was accessed by northern blotting. These E3 ubiquitin ligases were suppressed in muscles of CKD mice treated with miR-486 mimic (*, p<0.01 vs. CTL-miR+CKD; n = 7).
B: PTEN was evaluated by western blotting in muscles of sham and CKD mice electroporated with miR-486mimic or with CTL-miR
C: FoxO1 was evaluated by western blotting in muscles of sham and CKD mice electroporated with miR-486 mimic or with CTL-miR. Along with an increase in p-Akt, p-FoxO1 levels were raised in muscles electroporated with miR-486 mimic.
D: Western blots also reveal an increase in p-Akt in muscles electroporated with miR-486 mimic vs results in muscles electroporated with CTL-miR . *p<0.01 vs. CTL-miR+Sham; #p<0.01 vs. CTL-miR+CKD; n = 5.
E: qRT-PCR analysis of miRNAs from muscles of CKD mice electroporated with CTL-miR or miR-486mimic.
DISCUSSION
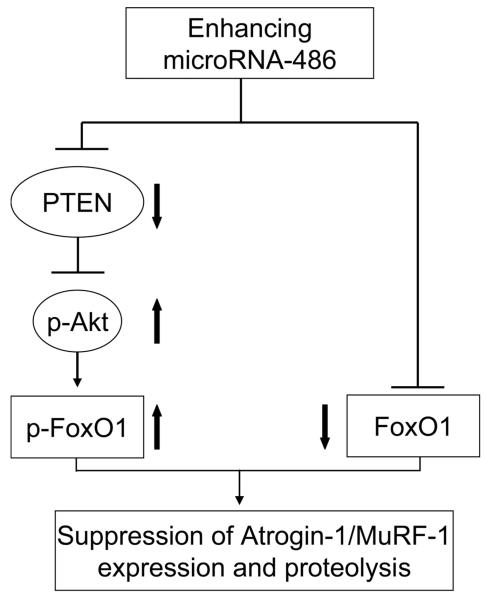
Much has been learned about the pathophysiology of skeletal muscles wasting in catabolic conditions but fewer strategies have been uncovered that block loss of muscle mass. We tested whether increasing the expression of a specific microRNA, miR-486, would benefit muscle metabolism by blocking a catabolic mediator, FoxO1. In two models of muscle wasting, CKD or administration of a high dose of glucocorticoids, miR-486 suppressed protein degradation in muscle improving muscle mass by increasing Akt signaling and repressing FoxO1**,** ubiquitin E3 ligases (Fig 8).
Fig 8. enhancing miR-486 suppresses skeletal muscle proteolysis stimulated by catabolic conditions.
In atrophying muscle cells, miR-486 represses the translation of PTEN leading to increased phosphorylation of Akt and FoxO1; miR-486 also directly suppresses FoxO1 translation. These two actions result the inhibition of ubiquitin E3 ligases to block muscle wasting.
FoxO1, FoxO3a or FoxO4 can initiate the transcription of the E3 ubiquitin ligases, Atrogin-1/MaFBx and MurF-1, the enzymes responsible for the specificity of muscle protein degradation by the UPS [5]. To determine which FoxO is the important mediator of CKD-induced muscle wasting in the condiction we studied, we initially investigated mice with muscle-specific knockout of FoxO1 (i.e., MFKO mice). In the MFKO mice, there was no change in FoxO3a or FoxO4 expression in muscle (Figure 1). Second, the transcription of Atrogin-1/MAFbx and MuRF-1 were reduced >70% in muscle of MFKO mice with CKD. Third, with a decrease in these E3 ubiquitin ligases, CKD-induced muscle proteolysis was blocked in MFKO mice. This conclusion was supported when we assessed the cross-sectional areas of muscle fiber sizes in MFKO mice (Figure 2). Thus, our results reveal that FoxO1 is a dominant mediator of CKD-induced muscle wasting. Its deletion suppresses muscle protein wasting by a mechanism that involves blocking the expression of Atrogin-1/MaFbx and MuRF-1. To document the prominent role of FoxO1, we extended the experiments and found that miR-486 targets FoxO1 and PTEN, two components of the insulin/IGF-1 signaling pathways that regulate muscle protein metabolism [2;26]. These experiments were undertaken because we have demonstrated that CKD-induced muscle proteolysis is activated by impaired insulin/IGF-1 signaling in muscle, we also have found that suppression of PTEN improves muscle growth and protein metabolism in muscle [27-29].
What could explain the catabolic responses to FoxO1? One possibility is that CKD increases glucocorticoid production and impairs insulin/IGF-1/Akt/FoxO1 signaling to stimulate Atrogin-1/MAFbx expression [22;30]. Alternatively, activated glucocorticoid receptors can interact with FoxO1 to stimulate MuRF-1 expression in muscle [24]. In both cases, the absence of FoxO1 would suppress the expression of both Atrogin-1/MaFbx and MuRF-1. Another explanation for the FoxO1-mediated stimulus is suggested by the report that FoxO1 increases the expression of myostatin in muscle [31]. This is relevant because we and others have found that CKD increases myostatin expression in muscle and hence, the absence of FoxO1 could reduce the catabolic influence of myostatin [32;33]. Finally, CKD and other catabolic conditions can suppress MyoD to impair muscle cell growth and differentiation [28;34]. Since deletion of FoxO1 in muscle reportedly increases MyoD[35;36], myogenesis might improve to blunt CKD-induced muscle atrophy.
Inflammatory cytokines also stimulate muscle wasting via increased expression of Atrogin-1/MAFbx and MuRF-1. For example, TNF-α, reportedly stimulates Atrogin-1/MAFbx expression via FoxO4 [13]. We have found that CKD increases circulating TNF-α [35], but in the present experiments, we found no change in FoxO4 expression or phosphorylation. Consequently, we have not identified a role for FoxO4 in muscle wasting stimulated by CKD.
How might miR-486 influence CKD-stimulated muscle wasting? Using RT-PCR analysis, we found miR-486 is significantly decreased in muscles of CKD mice (Supplemental Figure 3A), suggesting that the change in miR-486 might contribute to CKD-induced catabolism. Small et al., reported that miR-486 represses both PTEN and FoxO1 and enhances PI3K/Akt signaling in cultured cardiomyocytes [21]. The link between their results and skeletal muscle metabolism is that defects in IGF-1/PI3K/Akt signaling will accelerate protein degradation [22;27]. Since miR-486 can inhibit the translation of PTEN, there would be an increase in IGF/PI3K/Akt signaling and a improvement in FoxO1 phosphorylation. These responses would prevent FoxO1 translocation into the nuclear and hence, would suppress skeletal muscle proteolysis via the UPS. In fact, we found that introduction of a long-lasting miR-486 mimic into primary cultures of muscle cells, significantly suppressed the expression of Atrogin-1/MAFbx and MuRF-1 as well as Dex-stimulated muscle protein degradation (Figure 3). In mice with CKD, the miR-486 mimic inhibited both the expression of Atrogin-1/MAFbx and MuRF-1 and the loss of muscle mass (Figure 7). It has been reported that muscle-specific overexpression of miR-486 can impair muscle regeneration by interfering with cell cycle kinetics of regenerating myofibers [37]. In the present study, enhancing of miR-486 in myofibers improved Akt signaling and muscle protein metabolism in mice. Thus, microRNAs could influence muscle metabolisms at different stage of muscle cell development. We also found that enhanced miR-486 and Akt signaling prevented atrophy of myotubes and muscle fibers, results consistent with a pathway by which enhancement of miR-486 in muscle limits the protein wasting induced by CKD and possibly other catabolic conditions. A potentially negative response to overexpression of miR-486 would be muscle hypertrophy as occurs in response to a constitutively-activated form of Akt or with myostatin deletion or with exercise [35;38;39]. However, we did not find hypertrophy in primary cultures of myotubes or in normal muscles treated with the miR-486 mimic. Likewise, the absence of FoxO1 did not cause muscle hypertrophy in MFKO mice.
Why was the suppression of PTEN or FoxO1 incomplete? Even though electroporation of miR-486 increased it >10-fold above the endogenous level, FoxO1 or PTEN proteins decreased only modestly (Figure 2 and 5). Possibly, the miR-486 mimic did not create a sufficient amount of the RNA-induced silencing complex (RISC) which enables miR-486 to bind to the 3′ UTR of a mRNA [40]. Regardless, a microRNA can target several mRNA without eliminating the translation of targeted proteins and this could result in incomplete suppression of PTEN and FoxO1. The ability of miRNA to influence more than one protein is important because different proteins could influence activation of the same pathway. For example we found that miR-486 suppressed PTEN to improve insulin/IGF-1 signaling and increase the phosphorylation of FoxO1. Augmenting this activity was the miR-486-induced decrease in FoxO1 content and hence, the expression of the Atrogin-1/MaFbx and MuRF-1. By targeting PTEN and FoxO1, miR-486 acted to prevent loss of muscle mass despite the presence of catabolic stimuli [30].
Our results suggest that pharmacological agents which target FoxO1 might be developed into a method of preventing muscle atrophy. For example, miR-486 (or other microRNAs) could inactivate FoxO1 protein to suppress muscle wasting. Indeed, an orally active, small oligonucleotide delivery method has been invented [41].
MATERIAL AND METHODS
Mouse Model of CKD
Mice were housed with a 12-h light-dark cycles and all animal procedures were approved by the Baylor College of Medicine Institutional Animal Care and Use Committee. MFKO mice were obtained by crossing loxp flanked FoxO1 mice (kindly provided by Dr SY Chen, Baylor College of Medicine) with MCK-Cre mice (Jackson lab, Bar Harbor, ME), both strains are on FVS background. Lox+/+ plus Cre+ mice were designated as MFKO; lox+/+ with Cre-mice severed as controls. CKD was induced in 3 months old MFKO or lox/lox control male mice by 2 stage nephrectomy under anesthesia [35]. Briefly, the left kidney was removed and 1 week later ~70% of the right kidney was removed and homeostasis was achieved by tissue adhesive (3M, St. Paul, MN) to prevet bleeding. After one week of 24% dietary protein, mice were switched to a 40% protein diet (Harlan Teklab, Indianapolis, IN, USA) for at least 2-weeks. CKD was confirmed by serum creatinine (Fig S1A) and BUN (average 84±3.3 mg/dl in CKD groups). Serum creatinine level was determined using Cayman’s creatinine kit (Cayman chemical, Ann Arbor, MI). Sham-operated, control mice underwent surgery without damaging the kidneys and were fed the same diets. Electroporation was accomplished by injecting 0.5 nmol of microRNA in 20ul PBS into tibialis anterior (TA) muscle. Electroporation was performed at 80 volt for 10 pulses (100ms each pulse, 200 ms intervals) [22]. The long-lasting miR-486 mimic and the control, C. elegans microRNA (cel-miR-67) labeled with fluorescent Dy547 were purchased form Dharmcon (Thermo Scientific, Chicago, IL). At 14-day after electroporation, mice were anesthetized and TA muscles as well as serum were collected for experiments or the samples were frozen at −80 °C.
Protein synthesis and Degradation
Extensor digitorum longus (EDL) or soleus (Sol) muscles were maintained at resting length and incubated in Krebs-Henseleit bicarbonate buffer with 10 mM glucose as described [42]. Protein synthesis in EDL muscles was measured as the rate of incorporation of L-[14C] phenylalanine while protein degradation was measured the release of tyrosine. These amino acids were used as neither is synthesized or degraded in muscle. For primary culture of myotubes, the rates of protein synthesis were measured in during a 16-h incubation with 3 uCi L-[(3,5)-3H] tyrosine (MP Biomedicals). Subsequently, myotubes were washed 3X with ice-cold PBS before adding 10% trichloroacetic acid (TCA) to precipitate proteins. After three additional PBS washings, the pellets were dissolved in 0.5 ml of 0.15 mol/l NaOH, and the incorporation of radiolabeled tyrosine and protein content (Bio-Rad DC protein assay kit; Bio-Rad, Hercules, CA) were measured. To measure protein degradation, myotubes were prelabeled with -[(3,5)-3H] tyrosine and incubated in DMEM media containing 2% horse serum. At different times, the TCA–soluble radioactivity released from proteins was measured to calculate the rate of protein degradation [42].
Real-time qPCR and northern blot
Total RNA was extracted using TRIzol (Sigma) and precipitated in isopropanol for overnight. cDNAs were synthesized using MicroRNA cDNA kit ( Exiqon, Woburn, MA) . SYBR Green Real-time qPCR was performed with the CFX96 System (Bio-Rad Laboratories, Hercules, CA). All miRNA expressions were normalized to non-coding small nuclear RNA component of U6 (U6). The LNA™ miRNAs primers (miR-486, miR-1, miR-29a, miR-133, miR-206, cel-miR-67 and U6) were perchased from Exiqon. Northern blot analysis of Atrogin1/MaFbx and MuRF-1 was completed as described [22].
Histology and in Situ Hybridization
To assess differences in cross-sectional areas of myofibers, 5-μm sections of TA muscles were stained with an anti-laminin antibody (Sigma-Aldrich) or anti-FoxO1 (Cell Signaling, Danvers, MA). The diameters of at least 300 myofibers per TA muscle were assessed using Image J software (National Institutes of Health, Frederick, MD). In situ hybridization was performed using a digoxigenin-labeled miR-486, LNA™ probe (Exiqon) incubated at 42°C overnight as described [43]. After washing, the sections were incubated with anti-digoxigenin antibody for 16h and signals were visualized with nitro blue tetrazolium/5-bromo-4-chloro-3-indolyl phosphate (Roche Applied Science, Indianapolis, IN). A scrambled control probe LNA™ (Exiqon) was used as a negative control.
Cell culture and Western blot analyses
Satellites cells were isolated as described [20;28]. Myoblasts were maintained in F-10/DMEM with 10% FBS (HyClone, Logan, UT), penicillin (200 units/ml), and streptomycin (50 ug/ml) (Invitrogen, Carlsbad, CA). Myotubes were induced from myoblast by switching to DMEM plus 2% horse serum (Sigma) for 72 h. miR-486 mimic (0.01 nmol/well in 6 well dish) was transfected into myotubes with liporfectin 2000 (Invitrogen); Control miRNA (cel-miR-67 ) served as the control. After 36 h, rates of protein synthesis and degradation were measured as described [42]. For western blotting, lysates of myotubes were prepared in RIPA buffer (20 mM Tris, pH 7.5, 5 mM EDTA, 150 mM NaCl, 1% NP40, 0.5% Na-deoxycholate, 0.025% SDS, 1 mMNa-orthovanadate, 10 mM NaF, 25 μM β-glycerophosphate) containing proteases inhibitor (Roche). Skeletal muscle lysates were prepared from ~50 mg muscle by homogenizing in 0.5 ml RIPA buffer. After centrifugation at 15,000xg for 15 min at 4°C, the supernatants were subjected to western blotting as described [22].
Statistical analysis
Results are presented as mean ± SEM. Statistical analysis was performed by ANOVA followed by Tukey’s or Student-Newman-Keul’s tests. P < 0.05 was considered statistically significant. Experiments were repeated at least three times.
Supplementary Material
01
Supplemental Figure 1: Serum creatinine and the expression of Atrogin-1/MAFbx and MuRF-1 in soleus muscles A: Serum creatinine levels were measured at the time muscle samples were harvested (* p< 0.01 vs lox/lox + Sham group; #p<0.01 vs MFKO+ sham group. n=5).
B: The expression of Atrogin-1/MAFbx and MuRF-1 mRNAs in soleus muscles were accessed by northern blotting. The increased expression of Atrogin-1/MAFbx and MuRF-1 in muscle of CKD, lox/lox mice were suppressed in muscles of MFKO mice with CKD (*, p<0.05 vs. lox/lox+CKD, n = 5).
Supplemental Figure 2: Muscle-specific FoxO1 knockout (MFKO) is resistant to Dex-induced muscle atrophy
A: The distribution of muscle fiber sizes in control (lox/lox) or MFKO mice treated with Dex. The leftward-shift of muscle fiber sizes in lox/lox mice treated with Dex was prevented in MFKO mice despite Dex treatment (n = 5, >200 myofibers in each mouse were examined).
B: The levels of Atrogin-1/MAFbx and MuRF-1 mRNAs were accessed by northern blotting. The increased expressions of Atrogin-1/MAFbx and MuRF-1 in muscle of lox/lox mice stimulated by Dex were suppressed in muscles of MFKO mice treated with Dex (*, p<0.05 vs. lox/lox+Dex, n = 5).
Supplemental Figure 3: A: miR-486 expression in TA muscles of CKD and control (CTL) mice were examined by RT-PCR (*, p<0.05 vs. CTL, n = 5).
B: The cross-section of TA muscles following electroporation with the miR-486 mimic or CTL-miR are shown, In situ hybridization revealed that miR-486 was presented in > 70% myofibers of TA muscle.
ACKNOWLEDGE
We thank Dr. William E. Mitch for helpful comments and encouragement. The work was supported by NIH Grants R37 DK37175. Jing Xu was supported by Shanghai Health Bureau of dcientific research grant (07JG137) and Shanghai Municipal Education Commission grant (12zz075).
Footnotes
DISCLOSURE The authors declare there are not conflicts of interest in generating or reporting our results.
Reference List
- 1.Du J, Wang X, Miereles C, et al. Activation of caspase-3 is an initial step triggering accelerated muscle proteolysis in catabolic conditions. J Clin Invest. 2004;113:115–123. doi: 10.1172/JCI200418330. [DOI] [PMC free article] [PubMed] [Google Scholar]
- 2.Hu Z, Lee IH, Wang X, et al. PTEN expression contributes to the regulation of muscle protein degradation in diabetes. Diabetes. 2007;56:2449–2456. doi: 10.2337/db06-1731. [DOI] [PubMed] [Google Scholar]
- 3.Lee SW, Dai G, Hu Z, et al. Regulation of muscle protein degradation: coordinated control of apoptotic and ubiquitin-proteasome systems by phosphatidylinositol 3 kinase. J Am Soc Nephrol. 2004;15:1537–1545. doi: 10.1097/01.asn.0000127211.86206.e1. [DOI] [PubMed] [Google Scholar]
- 4.Wang XH, Zhang L, Mitch WE, et al. Caspase-3 cleaves specific 19 S proteasome subunits in skeletal muscle stimulating proteasome activity. J Biol Chem. 2010;285:21249–21257. doi: 10.1074/jbc.M109.041707. [DOI] [PMC free article] [PubMed] [Google Scholar]
- 5.Lecker SH, Goldberg AL, Mitch WE. Protein degradation by the ubiquitin-proteasome pathway in normal and disease states. J Am Soc Nephrol. 2006;17:1807–1819. doi: 10.1681/ASN.2006010083. [DOI] [PubMed] [Google Scholar]
- 6.Lecker SH, Jagoe RT, Gilbert A, et al. Multiple types of skeletal muscle atrophy involve a common program of changes in gene expression. FASEB J. 2004;18:39–51. doi: 10.1096/fj.03-0610com. [DOI] [PubMed] [Google Scholar]
- 7.Bodine SC, Latres E, Baumhueter S, et al. Identification of ubiquitin ligases required for skeletal muscle atrophy. Science. 2001;294:1704–1708. doi: 10.1126/science.1065874. [DOI] [PubMed] [Google Scholar]
- 8.Gomes MD, Lecker SH, Jagoe RT, et al. Atrogin-1, a muscle-specific F-box protein highly expressed during muscle atrophy. Proc Natl Acad Sci U S A. 2001;98:14440–14445. doi: 10.1073/pnas.251541198. [DOI] [PMC free article] [PubMed] [Google Scholar]
- 9.Stitt TN, Drujan D, et al. The IGF-1/PI3K/Akt pathway prevents expression of muscle atrophy-induced ubiquitin ligases by inhibiting FOXO transcription factors. Mol Cell. 2004;14:395–403. doi: 10.1016/s1097-2765(04)00211-4. [DOI] [PubMed] [Google Scholar]
- 10.Sandri M, Sandri C, Gilbert A, et al. Foxo transcription factors induce the atrophy-related ubiquitin ligase atrogin-1 and cause skeletal muscle atrophy. Cell. 2004;117:399–412. doi: 10.1016/s0092-8674(04)00400-3. [DOI] [PMC free article] [PubMed] [Google Scholar]
- 11.Senf SM, Dodd SL, Judge AR. FOXO signaling is required for disuse muscle atrophy and is directly regulated by Hsp70. Am J Physiol Cell Physiol. 2010;298:C38–C45. doi: 10.1152/ajpcell.00315.2009. [DOI] [PMC free article] [PubMed] [Google Scholar]
- 12.Smith IJ, Alamdari N, O’Neal P, et al. Sepsis increases the expression and activity of the transcription factor Forkhead Box O 1 (FOXO1) in skeletal muscle by a glucocorticoid-dependent mechanism. Int J Biochem Cell Biol. 2010;42:701–711. doi: 10.1016/j.biocel.2010.01.006. [DOI] [PMC free article] [PubMed] [Google Scholar]
- 13.Moylan JS, Smith JD, Chambers MA, et al. TNF induction of atrogin-1/MAFbx mRNA depends on Foxo4 expression but not AKT-Foxo1/3 signaling. Am J Physiol Cell Physiol. 2008;295:C986–C993. doi: 10.1152/ajpcell.00041.2008. [DOI] [PMC free article] [PubMed] [Google Scholar]
- 14.Farh KK, Grimson A, Jan C, et al. The widespread impact of mammalian MicroRNAs on mRNA repression and evolution. Science. 2005;310:1817–1821. doi: 10.1126/science.1121158. [DOI] [PubMed] [Google Scholar]
- 15.Lagos-Quintana M, Rauhut R, Yalcin A, et al. Identification of tissue-specific microRNAs from mouse. Curr Biol. 2002;12:735–739. doi: 10.1016/s0960-9822(02)00809-6. [DOI] [PubMed] [Google Scholar]
- 16.Eisenberg I, Eran A, Nishino I, et al. Distinctive patterns of microRNA expression in primary muscular disorders. Proc Natl Acad Sci U S A. 2007;104:17016–17021. doi: 10.1073/pnas.0708115104. [DOI] [PMC free article] [PubMed] [Google Scholar]
- 17.van RE, Olson EN. MicroRNAs: powerful new regulators of heart disease and provocative therapeutic targets. J Clin Invest. 2007;117:2369–2376. doi: 10.1172/JCI33099. [DOI] [PMC free article] [PubMed] [Google Scholar]
- 18.Eisenberg I, Alexander MS, Kunkel LM. miRNAS in normal and diseased skeletal muscle. J Cell Mol Med. 2009;13:2–11. doi: 10.1111/j.1582-4934.2008.00524.x. [DOI] [PMC free article] [PubMed] [Google Scholar]
- 19.Chen JF, Tao Y, Li J, et al. microRNA-1 and microRNA-206 regulate skeletal muscle satellite cell proliferation and differentiation by repressing Pax7. J Cell Biol. 2010;190:867–879. doi: 10.1083/jcb.200911036. [DOI] [PMC free article] [PubMed] [Google Scholar]
- 20.Wang XH, Hu Z, Klein JD, et al. Decreased miR-29 Suppresses Myogenesis in CKD. J Am Soc Nephrol. 2011;22:2068–2076. doi: 10.1681/ASN.2010121278. [DOI] [PMC free article] [PubMed] [Google Scholar]
- 21.Small EM, O’Rourke JR, Moresi V, et al. Regulation of PI3-kinase/Akt signaling by muscle-enriched microRNA-486. Proc Natl Acad Sci U S A. 2010;107:4218–4223. doi: 10.1073/pnas.1000300107. [DOI] [PMC free article] [PubMed] [Google Scholar]
- 22.Hu Z, Wang H, Lee IH, et al. Endogenous glucocorticoids and impaired insulin signaling are both required to stimulate muscle wasting under pathophysiological conditions in mice. J Clin Invest. 2009;119:3059–3069. doi: 10.1172/JCI38770. [DOI] [PMC free article] [PubMed] [Google Scholar]
- 23.Hwee DT, Gomes AV, Bodine SC. Cardiac proteasome activity in muscle ring finger-1 null mice at rest and following synthetic glucocorticoid treatment. Am J Physiol Endocrinol Metab. 2011;301:E967–E977. doi: 10.1152/ajpendo.00165.2011. [DOI] [PMC free article] [PubMed] [Google Scholar]
- 24.Waddell DS, Baehr LM, van den BJ, et al. The glucocorticoid receptor and FOXO1 synergistically activate the skeletal muscle atrophy-associated MuRF1 gene. Am J Physiol Endocrinol Metab. 2008;295:E785–E797. doi: 10.1152/ajpendo.00646.2007. [DOI] [PMC free article] [PubMed] [Google Scholar]
- 25.Small EM, Frost RJ, Olson EN. MicroRNAs add a new dimension to cardiovascular disease. Circulation. 2010;121:1022–1032. doi: 10.1161/CIRCULATIONAHA.109.889048. [DOI] [PMC free article] [PubMed] [Google Scholar]
- 26.Reed SA, Sandesara PB, Senf SM, Judge AR. Inhibition of FoxO transcriptional activity prevents muscle fiber atrophy during cachexia and induces hypertrophy 2. FASEB J. 2011 doi: 10.1096/fj.11-189977. [DOI] [PMC free article] [PubMed] [Google Scholar]
- 27.Bailey JL, Zheng B, Hu Z, et al. Chronic kidney disease causes defects in signaling through the insulin receptor substrate/phosphatidylinositol 3-kinase/Akt pathway: implications for muscle atrophy. J Am Soc Nephrol. 2006;17:1388–1394. doi: 10.1681/ASN.2004100842. [DOI] [PubMed] [Google Scholar]
- 28.Zhang L, Wang XH, Wang H, et al. Satellite cell dysfunction and impaired IGF-1 signaling cause CKD-induced muscle atrophy. J Am Soc Nephrol. 2010;21:419–427. doi: 10.1681/ASN.2009060571. [DOI] [PMC free article] [PubMed] [Google Scholar]
- 29.Hu Z, Wang H, Lee IH, et al. PTEN inhibition improves muscle regeneration in mice fed a high-fat diet. Diabetes. 2010;59:1312–1320. doi: 10.2337/db09-1155. [DOI] [PMC free article] [PubMed] [Google Scholar]
- 30.May RC, Kelly RA, Mitch WE. Mechanisms for defects in muscle protein metabolism in rats with chronic uremia. Influence of metabolic acidosis. J Clin Invest. 1987;79:1099–1103. doi: 10.1172/JCI112924. [DOI] [PMC free article] [PubMed] [Google Scholar]
- 31.Allen DL, Unterman TG. Regulation of myostatin expression and myoblast differentiation by FoxO and SMAD transcription factors. Am J Physiol Cell Physiol. 2007;292:C188–C199. doi: 10.1152/ajpcell.00542.2005. [DOI] [PubMed] [Google Scholar]
- 32.Plant PJ, Bain JR, Correa JE, et al. Absence of caspase-3 protects against denervation-induced skeletal muscle atrophy. J Appl Physiol. 2009;107:224–234. doi: 10.1152/japplphysiol.90932.2008. [DOI] [PubMed] [Google Scholar]
- 33.Verzola D, Procopio V, Sofia A, et al. Apoptosis and myostatin mRNA are upregulated in the skeletal muscle of patients with chronic kidney disease. Kidney Int. 2011;79:773–782. doi: 10.1038/ki.2010.494. [DOI] [PubMed] [Google Scholar]
- 34.Acharyya S, Ladner KJ, Nelsen LL, et al. Cancer cachexia is regulated by selective targeting of skeletal muscle gene products. J Clin Invest. 2004;114:370–378. doi: 10.1172/JCI20174. [DOI] [PMC free article] [PubMed] [Google Scholar]
- 35.Zhang L, Rajan V, Lin E, et al. Pharmacological inhibition of myostatin suppresses systemic inflammation and muscle atrophy in mice with chronic kidney disease. FASEB J. 2011;25:1653–1663. doi: 10.1096/fj.10-176917. [DOI] [PMC free article] [PubMed] [Google Scholar]
- 36.Kitamura T, Kitamura YI, Funahashi Y, et al. A Foxo/Notch pathway controls myogenic differentiation and fiber type specification. J Clin Invest. 2007;117:2477–2485. doi: 10.1172/JCI32054. [DOI] [PMC free article] [PubMed] [Google Scholar]
- 37.Alexander MS, Casar JC, Motohashi N, et al. Regulation of DMD pathology by an ankyrin-encoded miRNA. Skelet Muscle. 2011;1:27. doi: 10.1186/2044-5040-1-27. [DOI] [PMC free article] [PubMed] [Google Scholar]
- 38.Lai KM, Gonzalez M, Poueymirou WT, et al. Conditional activation of akt in adult skeletal muscle induces rapid hypertrophy. Mol Cell Biol. 2004;24:9295–9304. doi: 10.1128/MCB.24.21.9295-9304.2004. [DOI] [PMC free article] [PubMed] [Google Scholar]
- 39.Wang XH, Du J, Klein JD, et al. Exercise ameliorates chronic kidney disease-induced defects in muscle protein metabolism and progenitor cell function. Kidney Int. 2009;76:751–759. doi: 10.1038/ki.2009.260. [DOI] [PMC free article] [PubMed] [Google Scholar]
- 40.Czech B, Hannon GJ. Small RNA sorting: matchmaking for Argonautes. Nat Rev Genet. 2011;12:19–31. doi: 10.1038/nrg2916. [DOI] [PMC free article] [PubMed] [Google Scholar]
- 41.Aouadi M, Tesz GJ, Nicoloro SM, et al. Orally delivered siRNA targeting macrophage Map4k4 suppresses systemic inflammation. Nature. 2009;458:1180–1184. doi: 10.1038/nature07774. [DOI] [PMC free article] [PubMed] [Google Scholar]
- 42.Wang H, Liu D, Cao P, et al. Atrogin-1 affects muscle protein synthesis and degradation when energy metabolism is impaired by the antidiabetes drug berberine. Diabetes. 2010;59:1879–1889. doi: 10.2337/db10-0207. [DOI] [PMC free article] [PubMed] [Google Scholar]
- 43.Runge SR, Hu Z, Runge MS. In situ hybridization. Methods Mol Med. 2001;51:223–233. doi: 10.1385/1-59259-087-X:223. [DOI] [PubMed] [Google Scholar]
Associated Data
This section collects any data citations, data availability statements, or supplementary materials included in this article.
Supplementary Materials
01
Supplemental Figure 1: Serum creatinine and the expression of Atrogin-1/MAFbx and MuRF-1 in soleus muscles A: Serum creatinine levels were measured at the time muscle samples were harvested (* p< 0.01 vs lox/lox + Sham group; #p<0.01 vs MFKO+ sham group. n=5).
B: The expression of Atrogin-1/MAFbx and MuRF-1 mRNAs in soleus muscles were accessed by northern blotting. The increased expression of Atrogin-1/MAFbx and MuRF-1 in muscle of CKD, lox/lox mice were suppressed in muscles of MFKO mice with CKD (*, p<0.05 vs. lox/lox+CKD, n = 5).
Supplemental Figure 2: Muscle-specific FoxO1 knockout (MFKO) is resistant to Dex-induced muscle atrophy
A: The distribution of muscle fiber sizes in control (lox/lox) or MFKO mice treated with Dex. The leftward-shift of muscle fiber sizes in lox/lox mice treated with Dex was prevented in MFKO mice despite Dex treatment (n = 5, >200 myofibers in each mouse were examined).
B: The levels of Atrogin-1/MAFbx and MuRF-1 mRNAs were accessed by northern blotting. The increased expressions of Atrogin-1/MAFbx and MuRF-1 in muscle of lox/lox mice stimulated by Dex were suppressed in muscles of MFKO mice treated with Dex (*, p<0.05 vs. lox/lox+Dex, n = 5).
Supplemental Figure 3: A: miR-486 expression in TA muscles of CKD and control (CTL) mice were examined by RT-PCR (*, p<0.05 vs. CTL, n = 5).
B: The cross-section of TA muscles following electroporation with the miR-486 mimic or CTL-miR are shown, In situ hybridization revealed that miR-486 was presented in > 70% myofibers of TA muscle.
