Super-resolution 3D tomography of interactions and competition in the nuclear pore complex (original) (raw)
. Author manuscript; available in PMC: 2018 Apr 27.
Published in final edited form as: Nat Struct Mol Biol. 2016 Feb 15;23(3):239–247. doi: 10.1038/nsmb.3174
Abstract
A selective barrier formed by intrinsically disordered Phe-Gly (FG) nucleoporins (Nups) allows transport receptor (TR)-facilitated translocation of signal-dependent cargos through the nuclear pore complexes (NPCs) of eukaryotic cells. However, the configuration of the FG-Nup barrier and its interactions with multiple TRs in native NPCs remain obscure. Here, we mapped the interaction sites of various TRs or FG segments within the FG-Nup barrier by using high-speed super-resolution microscopy and used these sites to reconstruct the three-dimensional tomography of the native barrier in the NPC. We found that each TR possesses a unique interaction zone within the FG-Nup barrier and that two major TRs, importin β1 and Crm1, outcompete other TRs in binding FG Nups. Moreover, TRs may alter the tomography of the FG-Nup barrier and affect one another’s pathways under circumstances of heavy competition.
With a total length of ~200 nm and an inner diameter of ~50 nm at the narrowest point, the human NPC is composed of approximately 30 different Nups, with an estimated 8, 16 or 32 copies per NPC1–9. One-third of these Nups are FG Nups, which can be refined into three major groups: FG Nups, FxFG (Phe-x-Phe-Gly, in which x denotes any amino acid) Nups and GLFG (Gly-Leu-Phe-Gly) Nups10. These FG Nups together have been suggested to form an entropic barrier in the NPC through a form of the ‘oily spaghetti’, ‘FG bristles’ or ‘polymer brush’ models (formed by noncohesive FG domains)11–15 or a form of the ‘selective phase’ or ‘saturated-hydrogel meshwork’ models (structured through FG-FG interactions among the FG repeats of FG Nups)16–19 (Fig. 1a), although these models are currently under debate. The FG-Nup barrier is highly selective, allowing for passive diffusion of signal-independent small molecules (<40 kDa) and facilitated transport of cargos that carry either nuclear localization sequences (NLSs) or nuclear export signals (NESs) recognized by TRs6,7,20. In the process, TRs greatly enhance the transport efficiency of cargos through the NPCs by directly interacting with the FG repeats of FG Nups (TR-FG interactions). Numerous models have suggested that, to carry cargos through the NPC, TRs may push aside the oily spaghetti–like FG bristles11, collapse the polymer brush–like FG domains14, dissolve into the hydrogel meshwork of the FG barrier16–19, slide along the inner wall of the nuclear pore coated with FG Nups13 or adopt one central and eight peripheral channels in the FG-Nup barrier21. Many previous studies on interactions among FG Nups or among TRs and FG Nups, through approaches including bulk fluorescence measurements, theoretical simulations, in vitro biochemical assays, single-molecule tracking and electron microscopy imaging, have provided great insight into the above questions. However, neither the FG-FG interactions nor the TR-FG interaction sites have yet been completely mapped at the molecular level in native NPCs, although these data would be critical to distinguish among the disputed FG-FG or TR-FG interaction models and eventually refine the nucleocytoplasmic transport mechanism.
Figure 1.
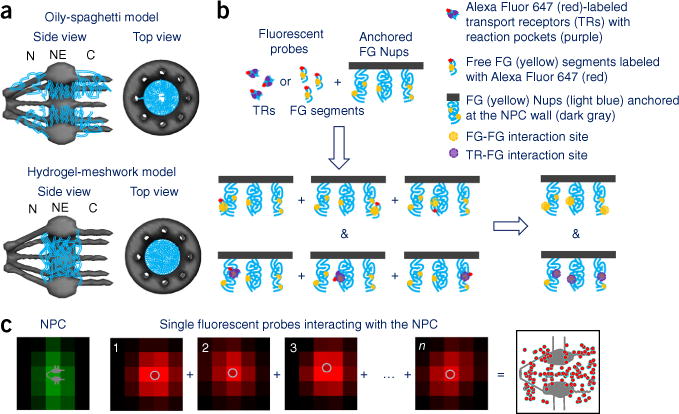
FG-Nup barrier models. (a) Top, the oily-spaghetti model of the FG-Nup barrier in the NPC, shown in side and top views. FG domains (blue lines) form an entropic barrier through which signal-independent small molecules freely diffuse via a central axial channel, and transport receptors (TRs) carry their cargos, interacting with FG Nups (TR-FG interactions), thereby mediating transport through the NPC. Bottom, side and top views of the selective-phase or hydrogel-meshwork model. Hydrophobic interactions among FG repeats (FG-FG interactions) generate a sieve-like hydrogel meshwork (blue mesh), thus allowing signal-independent small molecules to pass through the gaps of the meshwork and TR–cargo complexes and to dissolve into the meshwork through TR-FG interactions. C, cytoplasmic side of the NPC; NE, nuclear envelope; N, nucleoplasmic side of the NPC. (b) FG-FG or TR-FG interactions recognized by fluorescent FG-segment or TR probes, respectively. Reconstruction of these interactions in 3D leads to the tomography of FG-Nup barrier in the NPC. (c) Typical single-molecule snapshots of dwelling positions of the fluorescent probes in the NPC, determined by SPEED microscopy. Dwelling positions (from frames 1 to n) of individual fluorescent probe molecules (red spots) inside a single GFP-labeled NPC (green spot) were fitted by 2D Gaussian fittings. The spatial locations of many such events were superimposed to form a 2D super-resolution image.
We have recently developed a high-speed super-resolution imaging approach, termed single-point edge-excitation subdiffraction (SPEED) microscopy and have used this approach to successfully obtain the three-dimensional (3D) transport routes of passive diffusion and facilitated translocation through native NPCs22–24. In this paper, we set out to use this methodology to determine the 3D spatial distributions of FG-FG and TR-FG interaction sites, map the 3D configuration of the FG-Nup barrier and measure the competition among TRs as they simultaneously interact with the barrier in the native NPCs of human cells.
RESULTS
3D maps of FG-FG and TR-FG interactions in the native NPC
To map the 3D spatial distribution of the TR-FG interactions or the FG-FG interactions in the NPCs, we first used fluorescently labeled TRs or FG segments isolated from FG Nups as probes (0.1–1 nM for labeled probes) to identify these interactions (Fig. 1b). With the spatiotemporal resolution of 400 μs and ~10 nm enabled by SPEED microscopy (Supplementary Fig. 1, Supplementary Table 1 and Supplementary Note), we tracked the dwelling positions of individual fluorescent probes in the native NPCs (Supplementary Movies 1–3). We then superimposed these positions to form two-dimensional (2D) super-resolution images of these probes in the NPC (Fig. 1c and Supplementary Fig. 2). Through well-established symmetrical transform algorithms (or back-projection conversion), these 2D distributions can be converted into 3D computed probability density maps in the NPC22–24 (Supplementary Fig. 3 and Supplementary Note). Finally, to examine whether these probes would conduct TR-FG or FG-FG interactions or passively diffuse without interaction in the NPC, we also used truncated or mutated versions of the probes and repeated the above experiments as controls and comparisons. Notably, in our experiments we directly measured the dwelling positions of these probes rather than the interaction strength or binding affinity between the probes and FG Nups.
To map FG-FG interactions in the native NPCs of digitonin-permeabilized HeLa cells, we first obtained the 2D and 3D spatial locations of Nup116(345–458), a GLFG segment isolated from wild-type (WT) yeast (y) Nup116 and its positively charged mutant (bearing mutations of several neutral amino acids around FG repeats to positively charged lysine; Online Methods) in the NPC21 (Fig. 2a,b). We found that the mutant was primarily concentrated at a central axial channel with a diameter of ~19 nm through the NPC (Fig. 2b, i–v), a result agreeing well with the passive-diffusion pathways of small signal-independent molecules in the NPC, including 10-kDa dextran (Fig. 2c) as well as GFP, insulin and α-lactalbumin23. Because of the lack of interaction between these diffusing molecules and FG repeats in the NPC, their spatial locations indicated that this central axial channel may have no or very sparse FG repeats23. In contrast, the WT yNup116 segment was almost completely located at the periphery around this central axial channel in the scaffold region of the NPC (Fig. 2a, i–v) and also had the highest spatial probability density of FG-FG interactions in this zone (from −55 nm to 20 nm, defined as a strong FG-FG–interaction zone, Fig. 2a, iv). Additionally, we observed some WT yNup116(345–458) molecules (~25% from 20 nm to 90 nm and ~8% from −55 nm to −100 nm) diffuse into the central axial channel on both sides of the NPC (defined as weak FG-FG–interaction zones highlighted in Fig. 2a, iv). The above observations are consistent with previous suggestions that WT yNup116 interacts effectively with most FG Nups anchored in the central scaffold of the NPC and less effectively with FG Nups located on either side of the NPC21; moreover, we found that the positively charged mutant completely lost all the FG-FG interactions in the native NPCs.
Figure 2.
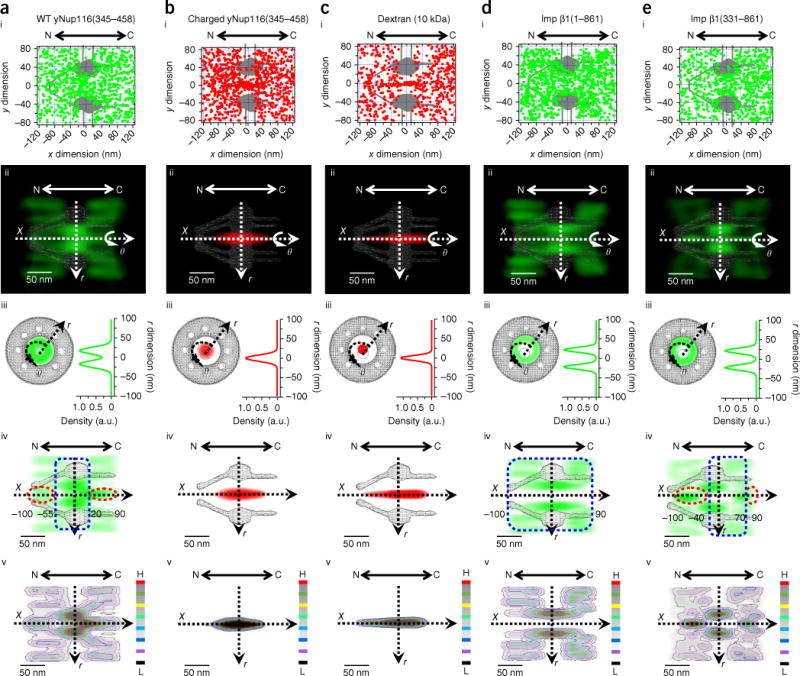
Detection of FG-FG and TR-FG interaction sites in the FG-Nup barrier by SPEED microscopy. (a–e) 2D and 3D spatial distributions of WT yNup116 (345–458) (a), charged yNup116(345–458) (b), 10-kDa dextran (c), Imp β1(1–861) (d) and Imp β1(331–861) (e) inside the NPCs of permeabilized cells. Typically, 3,000 to 6,000 spatial locations for each substrate were collected from 15 NPCs of 15 cells. (i) 2D spatial localizations of single molecules located primarily within a rectangular area of 240 × 160 nm around the centroid of the NPC, superimposed on the NPC architecture (gray). (ii) 3D probability density map obtained with a 2D-to-3D transform algorithm (green cloud; brighter color indicates higher density) and shown in 3D cut-away side-view, superimposed on the NPC architecture (gray). N, nucleoplasmic side of the NPC. C, cytoplasmic side of the NPC. (iii) Central lateral slice (top view) at the NPC middle plane of the 3D probability density maps. (iv) Central axial slice (side view) along the nucleocytoplasmic axis of the 3D probability density maps. The ranges of strong (blue dashed squares)- and weak (red dashed ovals)-interaction zones are highlighted and numbered in nanometers. (v) Heat map of iv. Red represents the highest density and black the lowest density in the color scale. A.u., absorbance units; X, r and θ, cylindrical coordinates; H, high; L, low.
Next, to map TR-FG interactions in the NPCs of permeabilized cells, we measured the 2D and 3D spatial locations of importin (Imp) β1 and its truncated version Imp β1(331–861), which lacks almost half of the ten functional sites interacting with FG Nups25. Imp β1 molecules seldom stayed in a ~23 nm central axial channel and instead primarily occupied the peripheral regions around this axial channel all along the NPC (a single strong-interaction zone from −100 nm to 90 nm; Fig. 2d, iv). This result indicated that the FG repeats recognized by Imp β1 are mainly available in the peripheral regions covering the entire NPC and was consistent with the notion that Imp β1 can interact with all the FG Nups in the NPC10,25 (Supplementary Table 2). In contrast, its truncated partner Imp β1(331–861) interacted effectively with only the FG Nups at the scaffold of the NPC (with a strong-interaction zone ranging from −40 nm to 70 nm) but partially lost interactions at both sides of the NPC (−40 nm to −100 nm on the nuclear side and 70 nm to 90 nm on the cytoplasmic side formed two weak-interaction zones) (Fig. 2e, iv). This observation is consistent with the previous measurements indicating that Imp β1(331–861) exhibits weaker binding activities in the NPC25 and ineffective interactions in vitro between Imp β1 (I178D) and most FG Nups located on both sides of the NPC26. Thus, the above tests proved that our approach allowed us to distinguish the effective and ineffective FG-FG and TR-FG interactions in the native NPCs.
3D tomography of the FG-Nup barrier in the native NPC
To provide a more comprehensive map of FG-FG or TR-FG interactions and then use these interacting sites to reconstruct the native tomography of the FG-Nup barrier in the NPC, we further tested whether different FG segments or TRs might recognize different FG repeats in the NPC. First, we further examined the spatial distributions of human (h) Nup62(1–300), hNup98(1–466), yNup42(1–372), yNsp1(1–603) and yNup159(441–881) in the NPC (Supplementary Fig. 2) by following the same experimental procedure applied to yNup116(345–458). Similarly to the spatial location of yNup116(345–458), the first three assayed FG domains reaffirmed two distinct FG-FG interaction regions in the FG-Nup barrier: (i) the strong-interaction zone, in which the FG domains primarily located at the peripheral regions around a central axial channel (from −50 nm to 90 nm for hNup62; from −80 nm to 20 nm for hNup98; and from −50 nm to −10 nm and 10 nm to 90 nm for yNup42); and (ii) the weak-interaction zone, where a fraction of the FG domains appeared in the central axial channel (~12% for hNup62, ~19% for hNup98 and ~24% for yNup42) (Fig. 3a–c). Moreover, we also found that, in contrast to the spatial distribution of yNup116(345–458), neither positively charged yNsp1(1–603) nor negatively charged yNup159(441–881) interacted with any FG Nups throughout the entire NPCs and instead primarily diffused through the central axial channel (Supplementary Fig. 4). The above results revealed that the spatial distributions of FG-FG interactions recognized by different FG segments had great similarities, but not all the FG Nups could interact with one another, and the native NPCs contained both interacting and noninteracting FG Nups, consistently with results from previous studies27.
Figure 3.
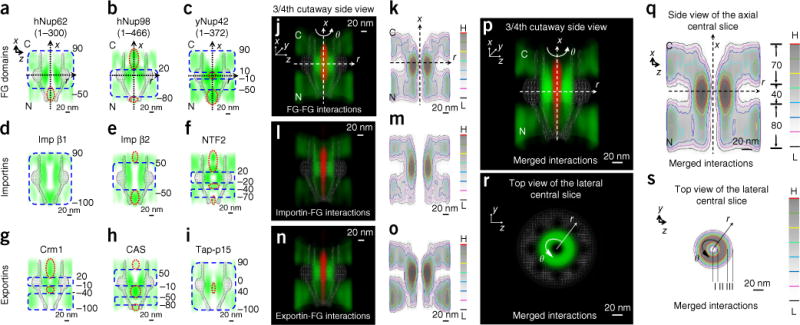
3D probability density maps of FG repeats in the FG-Nup barrier recognized by various FG segments, importins and exportins in permeabilized cells. (a–i) Side views of the central axial slices along the nucleocytoplasmic axis of the 3D probability density maps of various FG segments (a–c), importins (d–f) and exportins (g–i). The strong (blue dashed squares)- and weak (red dashed ovals)-interaction zones are highlighted. N, nucleoplasmic side. C, cytoplasmic side. (j) 3/4th cutaway side view of 3D probability density maps of all recognized FG-FG interaction sites from the tested FG segments (green), superimposed on the passive-diffusion pathway of yNup159(441–881) (red) and the NPC architecture (gray). (k) Heat map of the central slice of j. (l,m) Cutaway 3D view (l) and heat map (m) of the probability density map for the importin-recognized FG repeats (green), superimposed on the passive-diffusion pathway of 10-kDa dextran (red) and the NPC architecture (gray). (n,o) Cutaway 3D view (n) and heat map (o) of the probability density map for the exportin-recognized FG repeats (green), superimposed on the passive-diffusion pathway of 10-kDa dextran (red) and the NPC architecture (gray). (p–s) Merged 3D probability density maps and heat maps of the FG repeats in the NPC from j, l and n in both side view (p,q) and top view (r,s). Red represents the highest density and black the lowest density in the color scale. Each of the above measurements was repeated at least three times.
Next, we mapped the spatial distributions of two more major importins in the NPC, Imp β2 (also known as transportin) and nuclear transport factor 2 (NTF2), by following the same experimental protocol for Imp β1. In contrast to Imp β1, which had a single strong TR-FG–interaction zone, Imp β2 and NTF2 had both strong and weak TR-FG–interaction zones (Fig. 3d–f). For Imp β2, its strong-interaction region has a range approximately half that of Imp β1, starting at 50 nm on the cytoplasmic side and ending at −50 nm on the nuclear side of the NPC. Within its weak-interaction zones on both sides of the NPC, a fraction of Imp β2 molecules diffused into the central axial channel (~5% on the cytoplasmic side and ~12% on the nucleoplasmic side; Fig. 3e). NTF2 data revealed a more complicated result, with two strong-interaction zones (from −20 nm to 20 nm and from −70 nm to −40 nm) and three weak TR-FG–interaction regions along the NPC (from −100 nm to −70 nm, −40 nm to −20 nm and 20 nm to 90 nm; Fig. 3f). The above observations coincide well with those from previous studies on the binding affinities between FG Nups and the above tested importins10 (Supplementary Table 2). Imp β1 strongly binds all the FG Nups in the NPC6,7,10, whereas Imp β2 has relatively weaker binding affinities with the FG Nups, particularly with those FG Nups located at the cytoplasmic and nuclear ends of the NPC, e.g., Nup358, Nup 214, Nup 50 and Nup153 (refs. 10,28,29). Moreover, NTF2 possesses very weak binding activity toward most FG Nups on the cytoplasmic side and toward all of the GLFG Nups along the NPC30. One such GLFG Nup is Nup98, which has been suggested to play a critical role in the selectivity barrier of the NPC31.
Finally, we generated a spatial map of FG repeats based on the interactions detected among the FG Nups and several major exportins, including Crm1, CAS and the TapΔNLS–p15 complex (in which the mRNA-export receptor Tap was mutated to lack NLS and thus prevent complex formation with NLS-related TRs32). We found that TapΔNLS–p15 possessed a single long, strong-interaction zone (from −100 nm to 90 nm), and less than 1% of TapΔNLS–p15 complexes appeared in the central axial channel between 0 nm and 40 nm (Fig. 3g–i). Whereas Crm1 and CAS had multiple strong and weak TR-FG–interaction regions, which exhibited efficient binding to the FG Nups located on the nucleoplasmic side (from −100 nm to −40 nm for Crm1, and from −80 nm to −50 nm for CAS) and the central scaffold region (from −10 nm to 20 nm for Crm1, and from −10 nm to 50 nm for CAS) rather than those at the entrance to the central scaffold zone (from −40 nm to −10 nm for hCrm1, and from −50 nm to −10 nm for CAS) and on the cytoplasmic side (from 20 nm to 90 nm for Crm1, and from 50 nm to 90 nm for CAS) (Fig. 3g,h). The above 3D spatial maps largely agreed with the in vitro studies of binding affinities between these exportins and individual FG Nups10 (Supplementary Table 2).
Given that a small fraction of probe molecules diffused into the central axial channel in their weak-interaction zones, and that FG-Nup domains are absent or sparse in the central channel11,13,22–24, we excluded the locations of probes in the central axial channel and reconstructed the rest to obtain FG segment–based, importin-based or exportin-based tomography of FG repeats separately in the native NPCs (Fig. 3j–o and Supplementary Movie 4). As shown, these three obtained tomographies of FG repeats had fundamental similarities and shared large overlapping spatial regions. We further overlapped the three distributions to obtain a comprehensive spatial probability density map of the FG repeats in the native NPC (Fig. 3p–s and Supplementary Movie 5). The merged 3D map of FG repeats revealed four distinct subregions in the NPC (~70 nm on the cytoplasmic side, ~40 nm at the central scaffold, ~80 nm on the nucleoplasmic side and an ~10 nm–diameter central axial channel); the lowest spatial FG-repeat density was in the central axial channel, and the highest density was at the periphery around the channel in the central scaffold of the NPC (Fig. 3p,q). In particular, the central scaffold zone could be further divided into three layers: a central channel with the lowest FG-repeat density (I in Fig. 3s), a belt close to the wall of the nuclear pore, with a medium density (III in Fig. 3s) and an intermediate region with the highest density (II in Fig. 3s). The above experimentally determined spatial distributions of FG repeats are strongly supported by a recent computational simulation of spatial locations of all the FG repeats in the yeast NPC33 (Supplementary Fig. 5).
Competition among TRs in the native NPCs
Multiple importins and exportins simultaneously interact with the FG-Nup barrier in the NPCs of live cells. We have shown that there is substantial overlap among the 3D spatial pathways of different TRs through the NPC (Fig. 3). How the FG-Nup barrier coordinates the binding sites for these TRs and whether there is substantial competition among TRs in native NPCs still remain largely unknown. We selected Imp β1 and Crm1, the major importin and exportin in nuclear import and export, respectively, to test competition among TRs in our experiments. Our approach included three steps (illustrated by the experiments designed to study Imp β1’s competition with Imp β2). First, we determined the spatial distribution of 1 nM labeled Imp β2 in the absence of Imp β1 in the NPCs of permeabilized cells. Second, we incubated the native NPCs with 1 nM labeled Imp β2 and 15 μM unlabeled Imp β1, and then observed changes in the spatial distribution of 1 nM labeled Imp β2. We used a concentration of 15 μM, the maximum possible concentration for one TR in live cells34, for Imp β1 and other TRs in our tests of heavily TR-loaded NPCs. Third, we incubated cellular NPCs with 15 μM unlabeled Imp β1 and 1 nM labeled Imp β1, and then observed changes in the spatial distribution of 1 nM labeled Imp β1 in the absence of Imp β2, aiming at exploring any conformational changes of FG domains, as well as possible self-competition of Imp β1, induced by the 15 μM Imp β1.
We first found that the incubation of 15 μM Imp β1 with the NPCs in cells almost completely inhibited binding of 1 nM Imp β2 to the FG Nups within the strong-interaction region (from −50 nm to 50 nm) (Fig. 4a). In contrast, 15 μM Imp β2 incubated with the NPC had a negligible effect on the binding of 1 nM Imp β1 to the FG Nups at the central scaffold of the NPC and caused only ~5% of Imp β1 molecules to lose their effective interactions with the FG Nups on either side of the NPC (Fig. 4b). These results are consistent with previous in vitro biochemical measurements indicating that Imp β1 has much higher FG-Nup binding affinities than Imp β2 (ref. 29). Beyond this competition between Imp β1 and Imp β2, we found that a high concentration of either importin might have induced either slight conformational changes of the FG Nups or self-competition in the NPC and hence might have been responsible for the changes observed particularly in the nuclear basket for Imp β2 and at the cytoplasmic side for Imp β1 (Fig. 4a,b).
Figure 4.
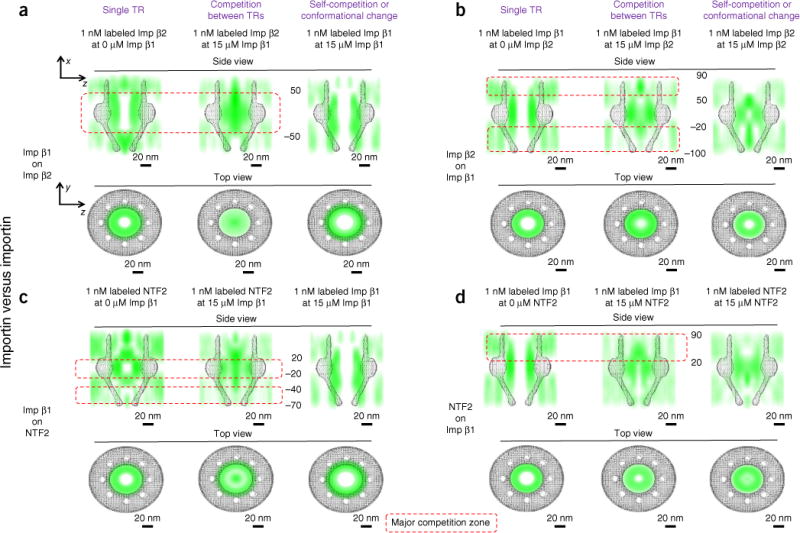
Competition among importins, determined in the NPCs of permeabilized cells. (a) Imp β1’s competition effect on Imp β2. Central-slice side view (top) and top view (bottom) indicating the 3D spatial probability maps of Imp β2 alone (left), Imp β2 in the presence of 15 μM Imp β1 (middle) and Imp β1 in the presence of 15 μM Imp β1 (right). NPC architecture is superimposed in gray. The major competition zone between Imp β1 and Imp β2 is highlighted and numbered in nanometers (red dashed rectangle). (b) Imp β2’s competition effect on Imp β1. (c) Imp β1’s competition effect on NTF2. (d) NTF2’s competition effect on Imp β1. Each of the above measurements was repeated at least three times.
We also revealed that 15 μM Imp β1 strongly outcompeted 1 nM NTF2 along the entire strong-interaction regions of NTF2 (from −70 nm to −40 nm and from −20 nm to 20 nm) and caused most NTF2 to diffuse into the central axial channel (Fig. 4c). In contrast, 1 nM Imp β1 retained its effective interactions with FG Nups in the nuclear basket and at the central scaffold (from −100 nm to 20 nm), and lost only ~9% of its interactions on the cytoplasmic side (from 20 nm to 90 nm) in the presence of 15 μM NTF2 (Fig. 4d). Our results are consistent with those of a recent in vitro study on the competition between NTF2 and Imp β1 (ref. 35). Again, we observed both self-competition of NTF2 and an altered conformation of the FG-Nup barrier at 15 μM NTFs; nonetheless, these changes had a minor contribution to the observed competition between Imp β1 and NTFs (Fig. 4c,d).
We next studied the competition between Crm1 and two other exportins (CAS and TapΔNLS–p15; Fig. 5a–d). Similarly to the competition of Imp β1 with other importins, 15 μM Crm1 outcompeted either 1 nM CAS or 1 nM TapΔNLS–p15 by significantly shrinking their effective interaction zones with FG Nups, thus causing the majority of CAS or TapΔNLS–p15 molecules in their strong TR-FG–interaction zones to diffuse into the central axial channel (Fig. 5a,c). In contrast, 15 μM CAS or TapΔNLS–p15 enhanced the interactions between 1 nM Crm1 and FG Nups in the weak-interaction zones of Crm1, by changing the two strong-interaction regions of Crm1 (from −10 to 20 nm and from −100 nm to −40 nm; Figs. 3g and 5b) to a single strong-interaction zone (from −100 nm to 20 nm for CAS, and from −40 nm to 50 nm for TapΔNLS–p15; Fig. 5b,d). Notably, the experiments with 15 μM CAS and TapΔNLS–p15 indicated that the conformation of the FG-Nup barrier had been substantially changed; this conformational change may have been the direct cause of the altered interaction regions of Crm1 induced by 15 μM CAS or TapΔNLS-p15 (Fig. 5b,d).
Figure 5.
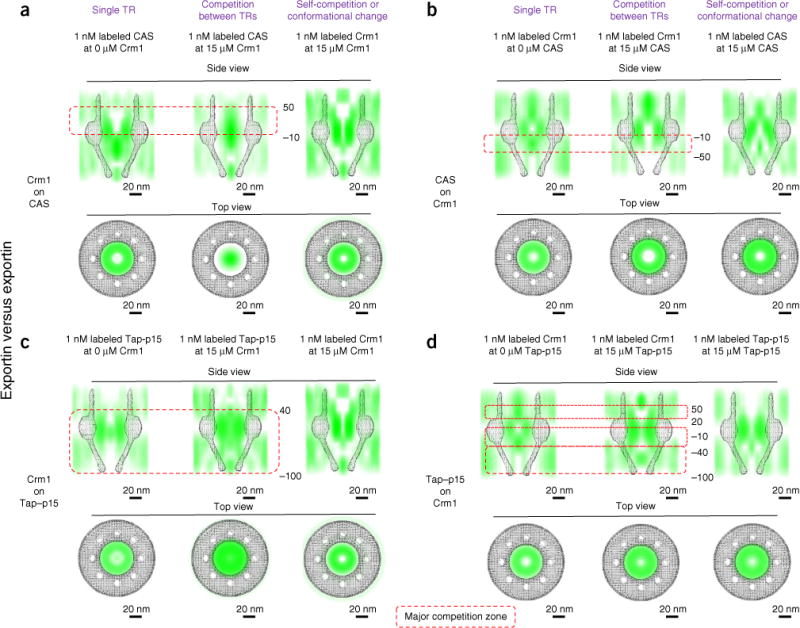
Competition among exportins, determined in the NPCs of permeabilized cells. (a) Crm1’s competition effect on CAS. (b) CAS’s competition effect on Crm1. (c) Crm1’s competition effect on Tap–p15. (d) Tap–p15’s competition effect on Crm1. Figure layout is as described in Figure 4. Each measurement was repeated at least three times.
Unexpectedly, we further found that Imp β1 and Crm1 scarcely affected each other’s pathways at either the central scaffold or the cytoplasmic side of the NPC and that their main competition occurred on the nuclear side of the NPC (Fig. 6a,b). Additionally, we examined the competition between TRs and FG segments in the NPC and found that both Imp β1 and Crm1 significantly outcompeted FG segments in almost all the tests (Supplementary Fig. 6), as expected, given the higher binding affinity of TR-FG interactions compared to FG-FG interactions36. In addition, the results supported the hypothesis that TRs need to dissolve into the FG-Nup barrier by outcompeting the FG-FG interactions to carry cargo through the NPC16–19.
Figure 6.
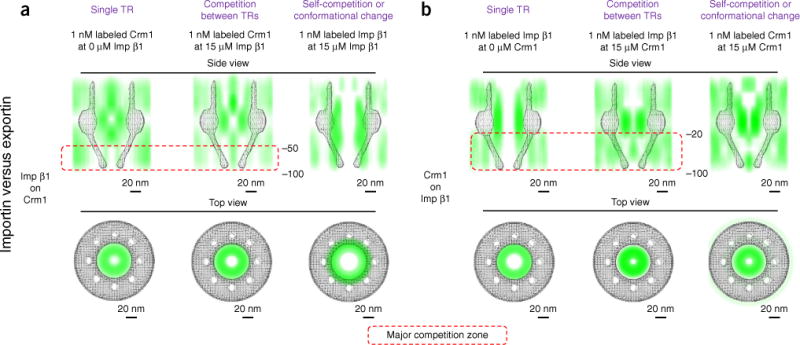
Competition between importin and exportin during binding to FG Nups in the NPCs of permeabilized cells. (a) Imp β1’s competition effect on Crm1. (b) Crm1’s competition effect on Imp β1. Figure layout is as described in Figure 4. The measurements were repeated at least three times.
Competition in living cells
Finally, we explored the spatial distribution of Imp β1 or Crm1 inside the NPCs in live cells. The in vivo spatial maps of Imp β1 and Crm1 inside the NPC, both of which were tagged with GFP on their C termini (at sites far from the known binding sites on the surfaces of these two TRs), had fundamental similarities but also some distinct differences in their distributions in permeabilized cells (Fig. 7). For Imp β1, the spatial distribution of its interacting sites with FG Nups in live cells largely overlapped with its distribution in the absence of any other TRs in permeabilized cells, except approximately 7% of Imp β1 molecules on the cytoplasmic side of the NPC (from 20 nm to 90 nm) appeared in the central axial channel (Fig. 7a). Considering the data obtained of competition between Imp β1 and other importins or exportins in permeabilized cells (Figs. 4 and 6), we suggest that the distribution of Imp β1 molecules on the cytoplasmic side of the NPC in live cells might be caused by its competition with other importins, such as NTF2, Imp β2 and other untested importins, but probably not with exportins. In live cells, Crm1 showed a spatial distribution highly similar to that of Crm1 alone in permeabilized cells, except for its localization in the nuclear basket (Fig. 7b). Notably, Crm1 retained a strong-interaction zone in the central scaffold of the NPC (from −10 nm to 20 nm), which was similar to that seen in permeabi-lized cells, but it partially lost the other strong-interaction zone (from −100 nm to −40 nm) in the nuclear basket (approximately 10% of Crm1 molecules diffused into the central axial channel in this region), thus suggesting that the multiple TRs present in live cells may substantially compete with Crm1 in the nuclear basket. In live cells, both Imp β1 and Crm1 would be cargo bound as they traverse the NPCs, and the bound cargos and the gradient of RanGTP and RanGDP across the NE would additionally affect their binding affinities with the FG Nups26. Previously, our measurements have indeed suggested that cargo-free and cargo-bound Imp β1 have slightly different transport routes through the NPCs in permeabilized cells22,23. Thus, the observed spatial transport routes of Imp β1 and Crm1 in live cells may be a combined effect of the competition among TRs and the alterations in binding affinity caused by bound molecules.
Figure 7.
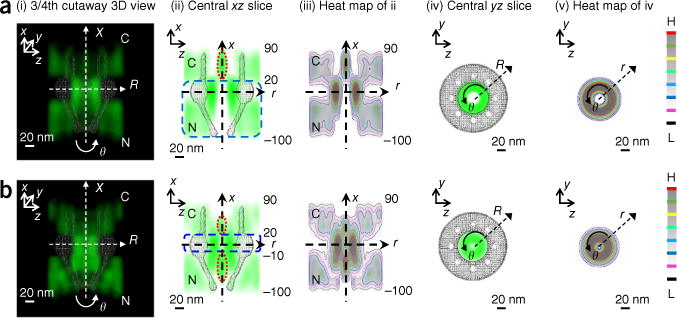
3D tomography of interaction sites for Imp β1 and Crm1 in the NPCs of live cells. (a,b) 3D probability density map of GFP-Imp β1 (a) or GFP-Crm1 (b) (green), superimposed on the NPC architecture (gray) in live cells. (i) 3/4th cutaway side view. (ii) Central _xz_-slice view along the nucleocytoplasmic axis (y = 0). The ranges of strong (blue dashed squares)- and weak (red dashed ovals)-interaction zones are highlighted and labeled in nanometers. (iii) Heat map of ii. (iv) Central _yz_-slice view (x = 0) at the NPC middle plane. (v) Heat map of iv. Red represents the highest density and black the lowest density in the color scale. N, nucleoplasmic side of the NPC. C, cytoplasmic side of the NPC. The above measurements were repeated at least three times.
DISCUSSION
The above 3D tomography of interactions and competition obtained in the native NPCs of human cells yielded new insights into the structure and function of the FG-Nup barrier and the nucleocytoplasmic transport mechanism. First, not all the FG Nups interacted effectively with one another in the native NPCs. Regardless of FG type (FG, FXFG or GLFG), the weak FG-FG hydrophobic interactions among FG Nups were affected by or even inhibited by the (negatively or positively) charged amino acids located around the FG repeats (Fig. 2b, Supplementary Fig. 4, Supplementary Table 2 and Online Methods). This conclusion obtained in native human NPCs agrees well with the results from previous tests conducted in yeast cells21,27 and also helps to settle the disputes in previous reports showing either interaction or no interaction among certain FG Nups19,36. Moreover, we concluded that the FG-FG interactions mapped in permeabilized cells are not induced by potential residual TRs in the NPCs. If they were, we would expect that the charged FG segments, including yNup 159(441–881) and yNsp1(1–603), would effectively interact with the native FG-Nup barrier as well, because many residual TRs such as Imp β1, Crm1 and TapΔNLS-p15 interact with almost all FG Nups (Supplementary Table 2). However, our data clearly did not support this possibility, because neither yNup 159(441–881) nor yNsp1(1–603) showed interaction with the native FG-Nup barrier. Additionally, the transit of isolated FG segments through the NPC has implied that some FG Nups facilitate trafficking and move together with trafficked macromolecules through the NPCs, as suggested previously37.
Second, the FG-Nup barrier is spatially inhomogeneous and possesses distinct concentrations of FG repeats in different subregions of the native NPC, all of which are much lower than previously estimated17,19. FG Nups form a saturated hydrogel in vitro that mimics the selectivity barrier in the native NPC when the concentration of FG repeats is increased up to 750 mM (~50 mM of FG Nups if there are ~15 FG repeats per FG Nup)17,19,28. However, on the basis of the 3D geometry of the FG-Nup barrier obtained here (Online Methods) and the total number of FG repeats estimated previously (n ≈ 2,650)28, we found that the FG-Nup barrier possesses an average FG-repeat concentration of ~5.6 mM in the central scaffold (−20 nm to 20 nm), ~2.1 mM on the nucleoplasmic side (−100 nm to −20 nm), ~1.8 mM on the cytoplasmic side (20 nm to 90 nm) and ~0 mM in the central axial channel (~10–17 nm in diameter) (Fig. 3q). These data suggest that it is unlikely that an FG-Nup hydrogel meshwork16–19 could form with such low concentrations of FG repeats under physiological conditions in the native NPCs.
Third, each TR has unique strong and weak TR-FG–interaction zones within the FG-Nup barrier. Among the tested TRs in the native NPC, Imp β1 and Tap–p15 possessed a single strong-interaction zone covering the entire passageway of the NPC, and the other TRs instead had multiple shorter strong- and weak-interaction zones within the FG-Nup barrier. The determined strong- or weak-interaction regions for these TRs coincided well with their previously measured or predicted binding abilities with different FG Nups except Crm1 (Supplementary Table 2). Previously Crm1 has been suggested to effectively interact with most FG Nups, on the basis of in vitro determinations10, but our data indicated that Crm1 possesses strong-interaction zones in only the central scaffold and at the nuclear basket of the native NPC. Additionally, we found that the addition of RanGTP (2 μM Ran and 1 mM GTP) in the measurements of TR-FG interactions in permeabilized cells did not cause clear changes in the transport routes of all these tested cargo-free TRs (data not shown). In summary, the boundaries of the strong-interaction zones depended on the strength of TR-FG binding affinities, the competition among TRs and the concentrations of FG repeats and TRs in the subregions of the NPC.
Finally, TRs alter the tomography of the FG-Nup barrier and affect one another’s pathways, depending on the competition circumstances. If the NPC was slightly loaded with TRs, the FG-Nup barrier largely maintained its tomography while interacting with FG segments, importins or exportins (Fig. 3). Moreover, each TR efficiently can pass through the FG-Nup barrier by finding the necessary binding sites to form its unique strong- and weak-interaction zones. However, under high TR concentrations and heavy competition among TRs, the TRs may alter the tomography of the FG-Nup barrier and modify one another’s transport routes, as evidenced by the different spatial distributions of FG domains and the different strong- and weak-interaction zones for each TR under 1 nM and 15 μM TRs (Figs. 4 and 5). As a consequence, a TR’s ability to pass through the NPC in TR-facilitated translocation heavily depends on the TR’s ability to find available binding sites in the FG-Nup barrier as it competes with other TRs. Interestingly, our real-time tracking of TRs through the NPCs of live cells suggests that the live NPCs may provide moderate competition circumstances for the substantial nucleocytoplasmic trafficking.
METHODS
Methods and any associated references are available in the online version of the paper.
ONLINE METHODS
Cell culture and transport conditions
A HeLa cell line (American Type Culture Collection) stably expressing the GFP conjugate of POM121 was used, and freshly split cells were grown overnight on coverslips or glass-bottomed dishes in DMEM supplemented with 10% FBS. Mycoplasma contamination in the cell culture was assessed by DAPI staining before experiments. For microscopy imaging in permeabilized cells, flow chambers were constructed with a top coverslip and two lines of silicone grease as spacers. Cells were washed with transport buffer (20 mM HEPES, 110 mM KOAc, 5 mM NaOAc, 2 mM MgOAc, and 1 mM EGTA, pH 7.3), permeabilized for 2 min with 40 μg/mL digitonin in transport buffer, and washed again with transport buffer supplemented with 1.5% polyvinylpyrrolidone (PVP; 360 kDa). PVP was included in all transport buffer solutions after digitonin treatment to prevent osmotic swelling of the nuclei. More details can be found in previously published methodology22–24,38–41. For live-cell imaging, cells were kept in the glass-bottomed dishes, and the medium was replaced by transport buffer just before detection.
For single-molecule measurements of substrates including FG domains, transport receptors and passive diffusion of small molecules in permeabilized HeLa cells, 1 nM Alexa Fluor 647–labeled substrates were tracked through the NPCs in the presence or absence of 15 μM unlabeled substrates. Specifically, to test the effect of RanGTP on TR-FG interactions in the NPCs of permeabilized cells, 1 mM GTP, 2 μM Ran, and 1 μM NTF2 were added into the transport buffer. For living-cell detection, GFP tagged Imp β1 or Crm1 was transfected into the HeLa cells, and single-molecule tracking of Imp β1 or Crm1 through the NPCs was conducted after complete photobleaching of the fluorescence of GFP-Pom121 in the NPCs.
FG segments and their labeling
Coding sequences for FG domains were PCR-amplified from Saccharomyces cerevisiae DNA or synthesized de novo by GenScript and were cloned into pGEX-2TK in frame with the 3′ end of the glutathione S-transferase (GST) gene. Where indicated, codons encoding six histidine and one tryptophan residues were added at the 3′ end. FG domains were expressed as GST fusions in the Escherichia coli BL21 strain, and glutathione-coated beads were used to isolate them from bacterial extracts. FG domains were then released by thrombolysis from their GST tags, and in some cases, nickel-coated beads were used to recapture the FG domain via its C-terminal histidine tag. Proteins were eluted from beads with 50 mM NaH2PO4, pH 8.0, 300 mM NaCl, 250 mM imidazole, and 0.1% Tween-20, and concentrated (Centricon 3) when necessary21,27. All proteins were then labeled with 20-fold molar excess Alexa Fluor 647 succinimidyl ester (Invitrogen) for 2 h at room temperature in binding buffer (20 mM HEPES, pH 6.8, 150 mM KOAc, and 2 mM MgOAc), and the products were dialyzed to remove the free dyes. The labeling ratios are shown in Supplementary Table 1.
Transport receptors, dextran and their labeling
N-terminal histidine-tagged Imp β1(1–861), Imp β1(331–861), Imp β2, NTF2, Crm1, CAS and human TapΔNLS–p15 heterodimer proteins were expressed in E. coli and purified with Ni-NTA Superflow (Qiagen), MonoQ and Superdex 200 (Amersham) chromatography. The solvent-accessible cysteines on the proteins were labeled with 20-fold molar excess Alexa Fluor 647 maleimide dye (Invitrogen) for 2 h at room temperature in 50 mM sodium phosphate, 150 mM NaCl, pH 7.5. Reactions were quenched with β-mercaptoethanol, and the products were dialyzed to remove the free dyes. Alexa Fluor 647–labeled 10-kDa dextrans were purchased from Invitrogen. The labeling ratios are shown in Supplementary Table 1.
Instrumentation
The SPEED microscope included an Olympus IX81 equipped with a 1.4-NA 100× oil-immersion apochromatic objective (UPLSAPO 100×, Olympus), a 35-mW 633-nm He-Ne laser (Melles Griot), a 120-mW ArKr tunable ion laser (Melles Griot), an on-chip multiplication gain charge-coupled-device camera (Cascade 128+, Roper Scientific) and the Slidebook software package (Intelligent Imaging Innovations) for data acquisition and processing. An optical chopper (Newport) was used to generate an on-off mode of laser excitation. GFP and Alexa Fluor 647 fluorescence were excited by 488 nm and 633 nm lasers, respectively. The two lasers were combined with an optical filter (FFF555/646 Di01, Semrock), collimated and focused into an overlapped illumination volume in the focal plane. The green and red fluorescence emissions were collected by the same objective, filtered by a dichroic filter (Di01-R405/488/561/635-25×36, Semrock) and an emission filter (NF01-405/488/561/635-25X5.0, Semrock) and imaged with an identical CCD camera.
Localization of the NE and determination of NPC orientation
The position of the NE was determined at super accuracy by fitting the fluorescence of GFP-POM121 as follows. The pixel intensities within a row or a column approximately perpendicular to the NE were fit with a Gaussian. The peak position of the Gaussian for a particular set of pixel intensities was considered to be the NE position for that row and column. The peak positions of a series of such Gaussians were then fit with a second-degree polynomial, yielding the orientation of the NE within the entire image. The following rules were then used to select a single NPC and determine its orientation, which needed to be perpendicular to the NE on the equator of the nucleus and to the y direction of the Cartesian coordinates (x, y) in the CCD camera: first, to focus on a GFP-NPC with eight copies of GFP-POM121, individual GFP-NPCs on the NE were selected when their fluorescence intensity was eight-fold that of a single GFP; second, we chose a fluorescent NPC on the equator of the nucleus, such that the tangent of the NE at the location of this NPC was parallel to the y direction of the Cartesian coordinates (x, y) in the CCD camera; and third, we examined the ratio of Gaussian widths in the long and short axes of the chosen GFP-NPC fluorescence spot, which needed to fall between 1.74 and 1.82. Within this range, an illuminated NPC has a free angle of 1.4° to the perpendicular direction to the NE22–24.
Localization precision for isolated fluorescent spots
The localization precision for fluorescent NPCs, immobile fluorescent molecules and moving fluorescent molecules was defined as how precisely the central point of each detected fluorescent diffraction-limited spot was determined. For immobile molecules or fluorescent NPCs, the fluorescent spots were fitted to a 2D symmetrical or an elliptical Gaussian function, respectively, and the localization precision was determined by the s.d. of multiple measurements of the central point. However, for moving molecules, the influence of particle motion during image acquisition should be considered in the determination of localization precision. In detail, the localization precision for moving substrates (σ) was determined by the algorithm
σ=F[16(s2+a2/12)9N+8πb2(s2+a2/12)2a2N2]
where F is equal to 2, N is the number of collected photons, a is the effective pixel size of the detector, and b is the s.d. of the background in photons per pixel, and
where s0 is the s.d. of the point spread function in the focal plane, D is the diffusion coefficient of substrate in the NPC, and Δ_t_ is the image acquisition time42–45.
In our experiments, more than 1,000 signal photons were collected from each targeted molecule. As shown in Supplementary Table 1, the localization precision for the immobile molecules based on the s.d. of multiple measurements was approximately 10 ± 1 nm. For moving molecules through the NPCs (captured within ~300 nm in the focal plane of SPEED microscopy as shown in Supplementary Fig. 1), the localization precision was calculated to be <13 nm, on the basis of the above equations and the parameters determined experimentally (_N_ > 1,000, a = 240 nm, b ≈ 2, s0 = 150 ± 50 nm, D = 0.4–0.8 μm2/s for the tested substrates). The approach to determine the diffusion coefficients followed a previously published procedure24. The localization precision of the NPC centroid was determined to be 2 ± 1 nm in permeabilized cells or 7 ± 2 nm in living cells, given the inevitable small vibration of NPCs in the NE of living cells. The system error of alignment between red and green fluorescence channels was 3.0 ± 0.1 nm, as determined by measuring 230 immobile Alexa Fluor 647–labeled GFP fluorescent molecules on the surface of a coverslip. Therefore, the overall tracking precision for transport of labeled molecules through the GFP-labeled NPC was estimated to be <13.5 nm in permeabilized cells and <15.1 nm in living cells.
2D-to-3D transform algorithms and image processing
The detailed transform process used to compute the 3D spatial probability density maps of particles transiting through the NPC was as described in our previous publications22–24 and demonstrated again here in Supplementary Figure 3. In short, the 3D spatial locations of molecules transiting through the NPC can be considered in either Cartesian (x, y, z) or cylindrical (X, r, θ) coordinates. In microscopic imaging, the observed 2D spatial distribution of particle localizations is a projection of its actual 3D spatial locations onto the xy plane. The underlying 3D spatial distributions can be recovered by projection of the measured Cartesian (x, y) coordinates back onto the simplified cylindrical (X, r, constant) coordinates, on the basis of the expected cylindrically symmetrical distribution along the θ direction of the nuclear pore. More detailed information can be found in Supplementary Figure 3 and its figure caption. The resulting 3D, surface-rendered visualizations shown in figures and movies were generated with Amira 5.2 (Visage Imaging).
Concentration of the FG repeats in the NPC
Given the 3D geometry of the FG-Nup barrier obtained in the native NPC (the nucleocytoplasmic axis x and the radius of NPC r, as shown in Fig. 3p) and the total number of FG repeats estimated previously (N = ~2,650)28, the spatial concentrations of FG repeats (C(x, r)) in the subregions of the FG-Nup barrier were quantitatively determined by following the formula ∫−10090∂x∫0802πr×C(x,r)=N, where C(x,r) = A × D(x,r), D(x, r) represents the relative density at the position of (x, r) in the cylindrical coordinate system, and A refers the ratio of the integration of the density D(x, r) in the entire NPC (x from −100 nm to 90 nm and r from 0 to 80 nm) over the total number of FG repeats estimated in one NPC (N = ~2,650). On the basis of the above formulas, the FG-Nup barrier was calculated to possess an average FG-repeat concentration of ~5.6 mM in the central scaffold (−20 nm to 20 nm), ~2.1 mM on the nucleoplasmic side (−100 nm to −20 nm), ~1.8 mM on the cytoplasmic side (20 nm to 90 nm) and ~0 mM in the axial central channel (~10–17 nm in diameter).
Sequences of FG segments, Imp β1 and mutants
Sequences of FG segments and Imp β1, including mutated sequences, can be found in Supplementary Data Set 1.
Standard error
Experimental measurement errors are reported as s.e.m., unless otherwise noted.
Supplementary Material
supplemental information
Acknowledgments
We thank M. Rexach (University of California, Santa Cruz), S. Musser (Texas A&M University) and D. Gorlich (Max Planck Institute) for providing plasmids. The project was supported by grants from the US National Institutes of Health (NIH GM094041, GM097037 and GM116204 to W.Y.).
Footnotes
Note: Any Supplementary Information and Source Data files are available in the online version of the paper.
AUTHOR CONTRIBUTIONS
W.Y. designed experiments; J.M. and W.Y. performed experiments, established cell lines and built microscopy equipment; J.M., A.G. and W.Y. conducted data analysis; and J.M. and W.Y. wrote the manuscript.
COMPETING FINANCIAL INTERESTS
The authors declare no competing financial interests.
References
- 1.Rout MP, et al. The yeast nuclear pore complex: composition, architecture, and transport mechanism. J Cell Biol. 2000;148:635–651. doi: 10.1083/jcb.148.4.635. [DOI] [PMC free article] [PubMed] [Google Scholar]
- 2.Suntharalingam M, Wente SR. Peering through the pore: nuclear pore complex structure, assembly, and function. Dev Cell. 2003;4:775–789. doi: 10.1016/s1534-5807(03)00162-x. [DOI] [PubMed] [Google Scholar]
- 3.Fried H, Kutay U. Nucleocytoplasmic transport: taking an inventory. Cell Mol Life Sci. 2003;60:1659–1688. doi: 10.1007/s00018-003-3070-3. [DOI] [PMC free article] [PubMed] [Google Scholar]
- 4.Fahrenkrog B, Aebi U. The nuclear pore complex: nucleocytoplasmic transport and beyond. Nat Rev Mol Cell Biol. 2003;4:757–766. doi: 10.1038/nrm1230. [DOI] [PubMed] [Google Scholar]
- 5.Denning DP, Patel SS, Uversky V, Fink AL, Rexach M. Disorder in the nuclear pore complex: the FG repeat regions of nucleoporins are natively unfolded. Proc Natl Acad Sci USA. 2003;100:2450–2455. doi: 10.1073/pnas.0437902100. [DOI] [PMC free article] [PubMed] [Google Scholar]
- 6.Stewart M. Molecular mechanism of the nuclear protein import cycle. Nat Rev Mol Cell Biol. 2007;8:195–208. doi: 10.1038/nrm2114. [DOI] [PubMed] [Google Scholar]
- 7.Palmeri D, Malim MH. Importin beta can mediate the nuclear import of an arginine-rich nuclear localization signal in the absence of importin alpha. Mol Cell Biol. 1999;19:1218–1225. doi: 10.1128/mcb.19.2.1218. [DOI] [PMC free article] [PubMed] [Google Scholar]
- 8.Hoelz A, Debler EW, Blobel G. The structure of the nuclear pore complex. Annu Rev Biochem. 2011;80:613–643. doi: 10.1146/annurev-biochem-060109-151030. [DOI] [PubMed] [Google Scholar]
- 9.Rout MP, Blobel G. Isolation of the yeast nuclear pore complex. J Cell Biol. 1993;123:771–783. doi: 10.1083/jcb.123.4.771. [DOI] [PMC free article] [PubMed] [Google Scholar]
- 10.Terry LJ, Wente SR. Flexible gates: dynamic topologies and functions for FG nucleoporins in nucleocytoplasmic transport. Eukaryot Cell. 2009;8:1814–1827. doi: 10.1128/EC.00225-09. [DOI] [PMC free article] [PubMed] [Google Scholar]
- 11.Macara IG. Transport into and out of the nucleus. Microbiol Mol Biol Rev. 2001;65:570–594. doi: 10.1128/MMBR.65.4.570-594.2001. [DOI] [PMC free article] [PubMed] [Google Scholar]
- 12.Rout MP, Aitchison JD. The nuclear pore complex as a transport machine. J Biol Chem. 2001;276:16593–16596. doi: 10.1074/jbc.R100015200. [DOI] [PubMed] [Google Scholar]
- 13.Peters R. Translocation through the nuclear pore complex: selectivity and speed by reduction-of-dimensionality. Traffic. 2005;6:421–427. doi: 10.1111/j.1600-0854.2005.00287.x. [DOI] [PubMed] [Google Scholar]
- 14.Lim RY, et al. Nanomechanical basis of selective gating by the nuclear pore complex. Science. 2007;318:640–643. doi: 10.1126/science.1145980. [DOI] [PubMed] [Google Scholar]
- 15.Rout MP, Aitchison JD, Magnasco MO, Chait BT. Virtual gating and nuclear transport: the hole picture. Trends Cell Biol. 2003;13:622–628. doi: 10.1016/j.tcb.2003.10.007. [DOI] [PubMed] [Google Scholar]
- 16.Ribbeck K, Görlich D. Kinetic analysis of translocation through nuclear pore complexes. EMBO J. 2001;20:1320–1330. doi: 10.1093/emboj/20.6.1320. [DOI] [PMC free article] [PubMed] [Google Scholar]
- 17.Frey S, Görlich D. A saturated FG-repeat hydrogel can reproduce the permeability properties of nuclear pore complexes. Cell. 2007;130:512–523. doi: 10.1016/j.cell.2007.06.024. [DOI] [PubMed] [Google Scholar]
- 18.Mohr D, Frey S, Fischer T, Güttler T, Görlich D. Characterisation of the passive permeability barrier of nuclear pore complexes. EMBO J. 2009;28:2541–2553. doi: 10.1038/emboj.2009.200. [DOI] [PMC free article] [PubMed] [Google Scholar]
- 19.Frey S, Richter RP, Görlich D. FG-rich repeats of nuclear pore proteins form a three-dimensional meshwork with hydrogel-like properties. Science. 2006;314:815–817. doi: 10.1126/science.1132516. [DOI] [PubMed] [Google Scholar]
- 20.la Cour T, et al. Analysis and prediction of leucine-rich nuclear export signals. Protein Eng Des Sel. 2004;17:527–536. doi: 10.1093/protein/gzh062. [DOI] [PubMed] [Google Scholar]
- 21.Yamada J, et al. A bimodal distribution of two distinct categories of intrinsically disordered structures with separate functions in FG nucleoporins. Mol Cell Proteomics. 2010;9:2205–2224. doi: 10.1074/mcp.M000035-MCP201. [DOI] [PMC free article] [PubMed] [Google Scholar]
- 22.Ma J, Yang W. Three-dimensional distribution of transient interactions in the nuclear pore complex obtained from single-molecule snapshots. Proc Natl Acad Sci USA. 2010;107:7305–7310. doi: 10.1073/pnas.0908269107. [DOI] [PMC free article] [PubMed] [Google Scholar]
- 23.Ma J, Goryaynov A, Sarma A, Yang W. Self-regulated viscous channel in the nuclear pore complex. Proc Natl Acad Sci USA. 2012;109:7326–7331. doi: 10.1073/pnas.1201724109. [DOI] [PMC free article] [PubMed] [Google Scholar]
- 24.Ma J, et al. High-resolution three-dimensional mapping of mRNA export through the nuclear pore. Nat Commun. 2013;4:2414. doi: 10.1038/ncomms3414. [DOI] [PMC free article] [PubMed] [Google Scholar]
- 25.Kutay U, Izaurralde E, Bischoff FR, Mattaj IW, Görlich D. Dominant-negative mutants of importin-beta block multiple pathways of import and export through the nuclear pore complex. EMBO J. 1997;16:1153–1163. doi: 10.1093/emboj/16.6.1153. [DOI] [PMC free article] [PubMed] [Google Scholar]
- 26.Bayliss R, Littlewood T, Strawn LA, Wente SR, Stewart M. GLFG and FxFG nucleoporins bind to overlapping sites on importin-beta. J Biol Chem. 2002;277:50597–50606. doi: 10.1074/jbc.M209037200. [DOI] [PubMed] [Google Scholar]
- 27.Patel SS, Belmont BJ, Sante JM, Rexach MF. Natively unfolded nucleoporins gate protein diffusion across the nuclear pore complex. Cell. 2007;129:83–96. doi: 10.1016/j.cell.2007.01.044. [DOI] [PubMed] [Google Scholar]
- 28.Peters R. Translocation through the nuclear pore: Kaps pave the way. BioEssays. 2009;31:466–477. doi: 10.1002/bies.200800159. [DOI] [PubMed] [Google Scholar]
- 29.Ben-Efraim I, Gerace L. Gradient of increasing affinity of importin beta for nucleoporins along the pathway of nuclear import. J Cell Biol. 2001;152:411–417. doi: 10.1083/jcb.152.2.411. [DOI] [PMC free article] [PubMed] [Google Scholar]
- 30.Isgro TA, Schulten K. Association of nuclear pore FG-repeat domains to NTF2 import and export complexes. J Mol Biol. 2007;366:330–345. doi: 10.1016/j.jmb.2006.11.048. [DOI] [PubMed] [Google Scholar]
- 31.Iwamoto M, Asakawa H, Hiraoka Y, Haraguchi T. Nucleoporin Nup98: a gatekeeper in the eukaryotic kingdoms. Genes Cells. 2010;15:661–669. doi: 10.1111/j.1365-2443.2010.01415.x. [DOI] [PubMed] [Google Scholar]
- 32.Katahira J, Straesser K, Saiwaki T, Yoneda Y, Hurt E. Complex formation between Tap and p15 affects binding to FG-repeat nucleoporins and nucleocytoplasmic shuttling. J Biol Chem. 2002;277:9242–9246. doi: 10.1074/jbc.M110007200. [DOI] [PubMed] [Google Scholar]
- 33.Ghavami A, Veenhoff LM, van der Giessen E, Onck PR. Probing the disordered domain of the nuclear pore complex through coarse-grained molecular dynamics simulations. Biophys J. 2014;107:1393–1402. doi: 10.1016/j.bpj.2014.07.060. [DOI] [PMC free article] [PubMed] [Google Scholar]
- 34.Dange T, Grünwald D, Grünwald A, Peters R, Kubitscheck U. Autonomy and robustness of translocation through the nuclear pore complex: a single-molecule study. J Cell Biol. 2008;183:77–86. doi: 10.1083/jcb.200806173. [DOI] [PMC free article] [PubMed] [Google Scholar]
- 35.Wagner RS, Kapinos LE, Marshall NJ, Stewart M, Lim RY. Promiscuous binding of Karyopherinβ1 modulates FG nucleoporin barrier function and expedites NTF2 transport kinetics. Biophys J. 2015;108:918–927. doi: 10.1016/j.bpj.2014.12.041. [DOI] [PMC free article] [PubMed] [Google Scholar]
- 36.Tetenbaum-Novatt J, Hough LE, Mironska R, McKenney AS, Rout MP. Nucleocytoplasmic transport: a role for nonspecific competition in karyopherin-nucleoporin interactions. Mol Cell Proteomics. 2012;11:31–46. doi: 10.1074/mcp.M111.013656. [DOI] [PMC free article] [PubMed] [Google Scholar]
- 37.Kerr AR, Schirmer EC. FG repeats facilitate integral protein trafficking to the inner nuclear membrane. Commun Integr Biol. 2011;4:557–559. doi: 10.4161/cib.4.5.16052. [DOI] [PMC free article] [PubMed] [Google Scholar]
- 38.Yang W, Gelles J, Musser SM. Imaging of single-molecule translocation through nuclear pore complexes. Proc Natl Acad Sci USA. 2004;101:12887–12892. doi: 10.1073/pnas.0403675101. [DOI] [PMC free article] [PubMed] [Google Scholar]
- 39.Yang W, Musser SM. Nuclear import time and transport efficiency depend on importin beta concentration. J Cell Biol. 2006;174:951–961. doi: 10.1083/jcb.200605053. [DOI] [PMC free article] [PubMed] [Google Scholar]
- 40.Yang W, Musser SM. Visualizing single molecules interacting with nuclear pore complexes by narrow-field epifluorescence microscopy. Methods. 2006;39:316–328. doi: 10.1016/j.ymeth.2006.06.002. [DOI] [PMC free article] [PubMed] [Google Scholar]
- 41.Sun C, Yang W, Tu LC, Musser SM. Single-molecule measurements of importin alpha/cargo complex dissociation at the nuclear pore. Proc Natl Acad Sci USA. 2008;105:8613–8618. doi: 10.1073/pnas.0710867105. [DOI] [PMC free article] [PubMed] [Google Scholar]
- 42.Mortensen KI, Churchman LS, Spudich JA, Flyvbjerg H. Optimized localization analysis for single-molecule tracking and super-resolution microscopy. Nat Methods. 2010;7:377–381. doi: 10.1038/nmeth.1447. [DOI] [PMC free article] [PubMed] [Google Scholar]
- 43.Quan T, Zeng S, Huang ZL. Localization capability and limitation of electron-multiplying charge-coupled, scientific complementary metal-oxide semiconductor, and charge-coupled devices for superresolution imaging. J Biomed Opt. 2010;15:066005. doi: 10.1117/1.3505017. [DOI] [PubMed] [Google Scholar]
- 44.Robbins MS, Hadwen BJ. The noise performance of electron multiplying charge-coupled devices. IEEE Trans Electron Dev. 2003;50:1227–1232. [Google Scholar]
- 45.Deschout H, Neyts K, Braeckmans K. The influence of movement on the localization precision of sub-resolution particles in fluorescence microscopy. J Biophotonics. 2012;5:97–109. doi: 10.1002/jbio.201100078. [DOI] [PubMed] [Google Scholar]
Associated Data
This section collects any data citations, data availability statements, or supplementary materials included in this article.
Supplementary Materials
supplemental information