Transcriptome profiling analysis of senescent gingival fibroblasts in response to Fusobacterium nucleatum infection (original) (raw)
Abstract
Periodontal disease is caused by dental plaque biofilms. Fusobacterium nucleatum is an important periodontal pathogen involved in the development of bacterial complexity in dental plaque biofilms. Human gingival fibroblasts (GFs) act as the first line of defense against oral microorganisms and locally orchestrate immune responses by triggering the production of reactive oxygen species and pro-inflammatory cytokines (IL-6 and IL-8). The frequency and severity of periodontal diseases is known to increase in elderly subjects. However, despite several studies exploring the effects of aging in periodontal disease, the underlying mechanisms through which aging affects the interaction between F. nucleatum and human GFs remain unclear. To identify genes affected by infection, aging, or both, we performed an RNA-Seq analysis using GFs isolated from a single healthy donor that were passaged for a short period of time (P4) ‘young GFs’ or for longer period of time (P22) ‘old GFs’, and infected or not with F. nucleatum. Comparing F. _nucleatum_-infected and uninfected GF(P4) cells the differentially expressed genes (DEGs) were involved in host defense mechanisms (i.e., immune responses and defense responses), whereas comparing F. _nucleatum_-infected and uninfected GF(P22) cells the DEGs were involved in cell maintenance (i.e., TGF-β signaling, skeletal development). Most DEGs in F. _nucleatum_-infected GF(P22) cells were downregulated (85%) and were significantly associated with host defense responses such as inflammatory responses, when compared to the DEGs in F. _nucleatum_-infected GF(P4) cells. Five genes (GADD45b, KLF10, CSRNP1, ID1, and TM4SF1) were upregulated in response to F. nucleatum infection; however, this effect was only seen in GF(P22) cells. The genes identified here appear to interact with each other in a network associated with free radical scavenging, cell cycle, and cancer; therefore, they could be potential candidates involved in the aged GF’s response to F. nucleatum infection. Further studies are needed to confirm these observations.
Introduction
Periodontitis is one of the most prevalent diseases worldwide and is the major cause of tooth loss in adults. Periodontitis is a chronic, multifactorial, polymicrobial infection that is initiated by dental plaque biofilms located in the gingival sulcus, and eventually leads to gingival inflammation and alveolar bone loss [1].
Fusobacterium nucleatum is a facultative oral bacterium that mediates aggregations between early (streptococci and actinomycetes) and late colonizers (Porphyromonas gingivalis, Tannerella forsythia, and Treponema denticola), which are strongly implicated in the pathogenesis of periodontal disease [2, 3]. It is known that F. nucleatum contributes to the reducing environment necessary for the emergence of oxygen-intolerant anaerobes [4, 5]. We recently reported that F. nucleatum stimulates P. gingivalis growth by triggering the activation of NADPH oxidase in host cells, which could provide a favorable environment for strictly anaerobic bacteria [6]. Although F. nucleatum may not be directly responsible for the severe pathological damage to periodontal tissues, it is an important intermediate species, bridging the attachment of several pathogenic bacteria associated with destructive periodontal disease. Moreover, F. nucleatum adheres to, and invades, human epithelial cells directly and might mediate the entry of non-invasive bacteria.
Human gingival fibroblasts (GFs) are the major cells in periodontal tissues and play a critical role as a protective barrier against various pathogenic microorganisms [5]. Human GFs are constantly exposed to a range of different oral bacteria, triggering the production of pro-inflammatory cytokines (IL-6 and IL-8) and various metalloproteases (MMP-3, -9, and -13) [7, 8]. The secreted cytokines then recruit immune cells to combat the infection [9] whereas the MMPs are associated with wound healing and tissue remodeling [10]. The susceptibility of GFs to bacterial infection is known to be affected by aging [8, 11, 12] and furthermore, the development and progression of periodontal disease is known to be significantly associated with aging [13, 14].
Infectious diseases are among the major causes of morbidity and mortality in the elderly population. A variety of factors contribute to the increased susceptibility to infection seen in elderly people [15]. There have been many studies addressing infectious diseases in elderly populations [16–18]. For example, it is well known that elderly people are more susceptible to infection with diverse pathogens including Streptococcus pneumoniae [19], Mycobacterium tuberculosis [20], Staphylococcus aureus [21], and Escherichia coli [22]. These infections can occur at various infection sites including the respiratory tract, skin, and the urinary tract. Despite several studies regarding the effects of aging on periodontal diseases [12, 23], the underlying mechanisms through which aging affects the interaction between F. nucleatum and human GFs remain unclear.
Senescence, a process in which normal somatic cells undergo an irreversible arrest in their proliferative capacity after a limited number of divisions [24], is thought to contribute to organismal aging [24, 25]. Senescent cells are therefore a useful tool for studying aging and age-related diseases [26]. Under standard culture conditions, primary human cells undergo a limited number of cell divisions, and after several serial passages in culture, the cells enter a senescent state [24]. In general, senescent cells exhibit a complex phenotype characterized by cell cycle arrest, increased cell size, altered morphology, and altered gene expression [27]. We previously reported that aged GFs (P22) can be more easily invaded by F. nucleatum, as well as having reduced reactive oxygen species (ROS) generation and cytokine responses, compared to young GFs [8].
In this study, we aimed to investigate the differences in gene expression between young (P4) and aged (P22) GFs in response to F. nucleatum infection using a deep RNA-seq analysis (about 20 Gb per sample). The differentially expressed genes (DEGs) in young GFs (P4), most of which were upregulated by F. nucleatum infection, were involved in host defense mechanisms, such as cell death and survival-related functions. In contrast, the DEGs in aged GFs (P22) were involved in cellular maintenance such as skeletal and cellular development-related functions. F. nucleatum genes themselves were associated with more active metabolic pathways including glycolysis, fatty acid/butyrate, and cell wall synthesis, and were more highly expressed in F. _nucleatum_-infected young GFs (P4) compared to aged GFs (P22). By comparing the DEGs, in response to F. nucleatum infection we found that twenty-four genes were unique to young GFs (P4), whereas ten genes were unique to aged GFs (P22). Among these latter ten DEGs, five were upregulated as a result of F. nucleatum infection of aged GFs (P22) and are known to be localized in the nucleus. These five genes require further study to determine their role in aging-related GF responses to infection.
Materials and methods
Ethics statement
This study was approved by the Chonnam National University Dental Hospital Institutional Review Board (approval No. CNUDH-2013-001). Written informed consent was obtained for all subjects after the nature and possible consequences of the studies were explained. All participants were adults without periodontal disease.
Cell cultures and reagents
Primary human GFs were prepared as previously described that all cells used in this study were obtained from a single healthy donor [6]. The collection of human gingival tissue was approved by the Chonnam National University IRB as described above. GFs were grown in Dulbecco's modified Eagle’s medium (DMEM; Gibco BRL, Grand Island, NY, USA) supplemented with 10% heat-inactivated fetal bovine serum (PAA Laboratories, Etobicoke, Ontario, Canada), 100 U/mL penicillin, and 100 μg/mL streptomycin (Gibco BRL) at 37°C in a humidified atmosphere containing 5% CO2. When confluent, the cells were trypsinized using a 0.25% trypsin/0.02% EDTA solution (Sigma, St Louis, MO, USA) and subcultured at a 1:3 ratio until the required passage number was reached and senescent characteristics were observed [8]. The cells used for all of the experiments were at either the fourth passage (P4) or the twenty-second passage (P22). Aged GFs at passage 22 were previously confirmed to have senescence-associated β-galactosidase (SA-β-gal) activity and express senescence markers such as p53, p21, and Cav-1 [8].
Bacterial strains and culture
F. nucleatum subsp. polymorphum (ATCC10953) was used in this study. Bacterial cells were prepared as previously described [8]. Briefly, F. nucleatum was cultured under anaerobic condition (85% N2, 5% CO2, and 10% H2) at 37°C in a tryptic soy broth containing 5 μg/mL hemin (Sigma) and 1 μg/mL menadione (Sigma). Bacteria were harvested by centrifugation at 3000 rpm for 10 minutes at 4°C, washed once in phosphate-buffered saline and resuspended in DPBS. GFs were infected with F. nucleatum for 2 h at an MOI = 10.
RNA isolation and sequencing
RNA was extracted from human GFs using the RNeasy Mini Kit (Qiagen, Hilden, Germany). The isolated RNA was treated with DNase I to remove any contaminating DNA. RNA quality was assessed using RNA screentape from the TapeStation system (Agilent Technologies, Santa Clara, CA, USA). The RIN scores for all RNA samples were higher than 7.
The mRNA-Seq sample was obtained using the Illumina TruSeq™ RNA Sample Preparation Kit (Illumina, Inc., San Diego, CA, USA). In brief, total RNA samples were treated with the RiboZero Human kit and the RiboZero bacteria kit (Epicentre) to deplete bacterial and eukaryotic rRNA, followed by thermal mRNA fragmentation. The RNA fragments were then transcribed into first strand cDNA using reverse transcriptase and random primers. The cDNA was synthesized to second strand cDNA using DNA Polymerase I and RNase H. After the end-repair process, single 'A' bases were added to the fragments and the adapters were then ligated and prepared for cDNA hybridization into the flow cell. Finally, the products were purified and enriched by PCR to create the cDNA library (Macrogen, Seoul, Korea). The cDNA libraries were sequenced on the HiSeq 2000 (Illumina) to obtain approximately 1 billion paired-end reads (2 x 101 bp).
Transcriptome analysis
The experimental procedures for the transcriptome analysis are illustrated in Fig 1. Initially, we pre-processed the RNA-seq data from our four samples using Trimmomatic (version 0.33) [28], to obtain clean reads by removing those containing adapter sequences, poly-N sequences, or low quality bases (below a mean Phred score of 15). The trimmed reads were aligned separately to the human and F. nucleatum genomes by Tophat2 [29] using default parameters. The genome sequences and the human (GRCh38) and F. nucleatum annotations were obtained from the NCBI genome database (https://www.ncbi.nlm.nih.gov/genome). For quantitation of mRNA transcripts, the resulting aligned reads were put into Cufflinks (v2.2.1) [29]. Unless otherwise stated, all gene expression levels used in our analyses are given using FPKM (_F_ragment _P_er _K_ilobase of exon per _M_illion fragments mapped) as the unit. Differential expression analyses were performed using Cuffdiff (v2.2.1) [29] and their visualization was generated using R (R Development Core Team, R Foundation for Statistical Computing, Vienna, Austria).
Fig 1. RNA-seq analysis pipeline.
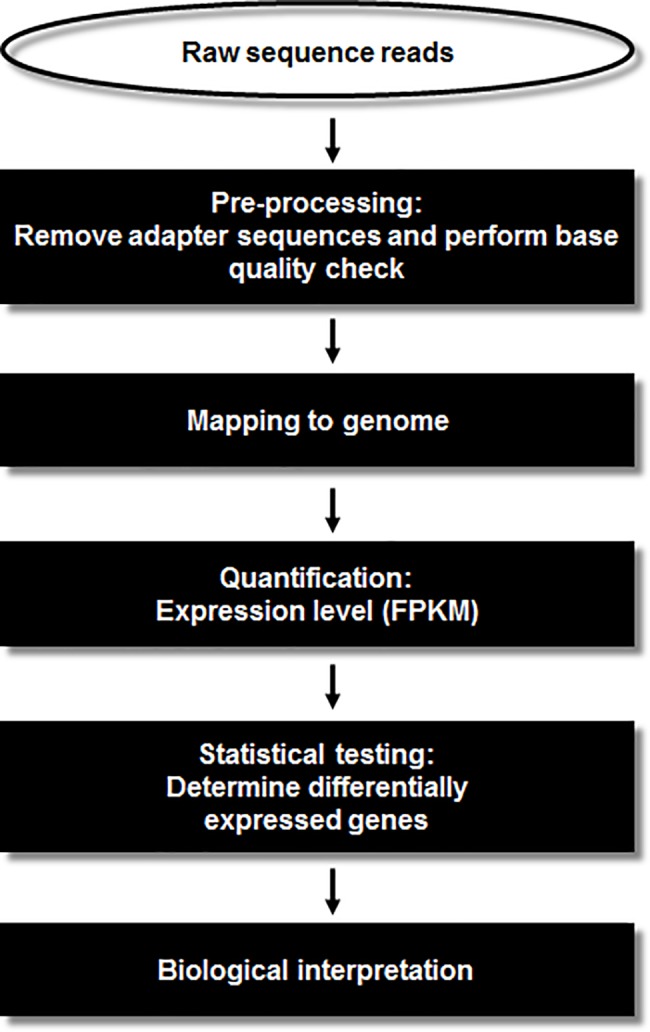
Laboratory pipeline for simultaneous depletion of rRNA from prokaryotic and eukaryotic RNA mixtures. The enriched mRNA was used to generate the RNA-Seq libraries.
Gene ontology (GO), network, and pathway analyses
We performed GO and functional pathway analyses of DEGs using the GATHER tool (http://gather.genome.duke.edu/) [30, 31] and Ingenuity Pathway Analysis (IPA), version 8.0 (Ingenuity® Systems, www.ingenuity.com), respectively. To investigate the enrichment analysis of the reads of F. nucleatum metabolic pathways involved in GF aging, a Kyoto Encyclopedia of Genes and Genomes (KEGG) pathway analysis was performed [17].
Results
RNA-seq data analysis
To better understand the global responses of GFs to F. nucleatum infection and the effect of aging, we performed a genome-wide transcriptome analysis using RNA-seq technology to determine the changes in gene expression in young GFs (P4) and aged GFs (P22), with or without F. nucleatum, infection. A total of 100 Gb of raw sequence data was generated from all four samples (Table 1). After trimming the raw sequence data, the clean reads of each sample were first mapped to the human genome, and the unmapped reads in the F. _nucleatum_-infected samples were remapped to the F. nucleatum genome (Table 1). A total of 433,937 and 109,468 sequence reads were uniquely matched to the F. nucleatum genome in F. _nucleatum_-infected GF(P4) cells and F. _nucleatum_-infected GF(P22) cells, respectively. Their GC contents were found to be similar (35.1% and 32.7%, respectively), and were different from the percentages obtained from sequences reads following mapping onto the human reference genome (51.11% and 51.08%, respectively). These results indicated that bacterial-specific sequences, having no homology with human DNA were well achieved. The distributions of normalized FPKM values are shown in Fig 2. The distribution of gene expression is shown as scatter plots using a one to one comparison. The overall expression patterns were similar to one another (R value ranges from 0.89 to 0.91).
Table 1. RNA-seq data statistics.
| Samples | Reference | Total reads (Raw data) | Total reads (w/o adaptor) | Aligned pairs | Multiple alignments | Concordant pair alignments |
|---|---|---|---|---|---|---|
| Uninfected GF(P4) | Homo sapiens | 240,914,330 | 240,591,122 | 109,770,915 | 4,661,202 | 108,834,930 (90.5%)* |
| F. _nucleatum_-infected GF(P4) | Homo sapiens | 249,525,110 | 249,311,972 | 107,274,408 | 3,153,643 | 106,723,775 (85.6%) |
| F. nucleatum ATCC25586 | 473,131 | 39,194 | 433,937 (0.1741%) | |||
| Uninfected GF(P22) | Homo sapiens | 266,758,386 | 266,438,682 | 124,654,404 | 2,965,534 | 123,496,658 (92.7%) |
| F. _nucleatum_-infected GF(P22) | Homo sapiens | 266,580,404 | 259,574,938 | 121,806,945 | 4,613,353 | 120,318,603(92.7%) |
| F. nucleatum ATCC25586 | 111,166 | 1,698 | 109,468(0.0422%) |
Fig 2. Distribution of RNA-seq data.
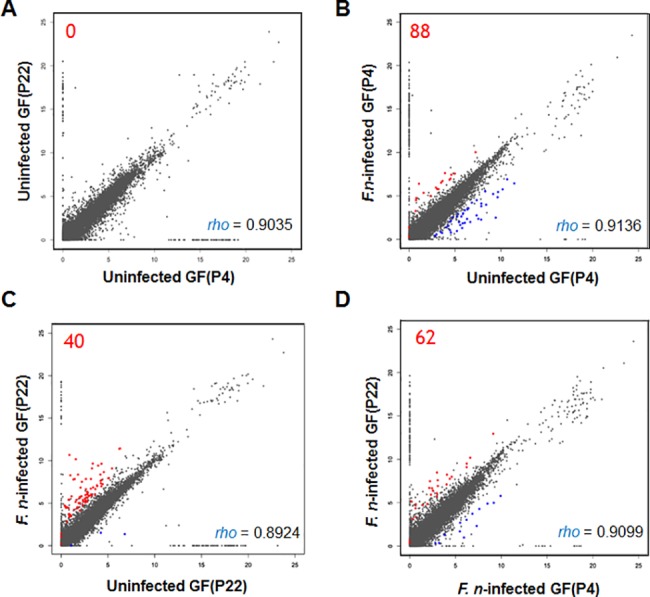
All gene expression levels were transformed to base two logarithms. (A) Uninfected GFs (P4) vs. uninfected GFs (P22). (B) Uninfected GFs (P4) vs. _Fusobacterium nucleatum_-infected GFs (P4). (C) Uninfected GFs (P22) vs. F. _nucleatum_-infected GFs (P22). (D) F. _nucleatum_-infected GFs (P4) vs. F. _nucleatum_-infected GFs (P22). The individual Spearman's rank correlation coefficients are shown on each graph. Significant DEGs between the two samples, with an FDR <5% when Benjamini-Hochberg multiple testing adjustment was used, are shown in red dots (upregulated) and blue dots (downregulated).
Differential expression analysis
To investigate the age-related changes in GFs following F. nucleatum infection, the transcriptome profiles of uninfected cells versus infected cells, for both young and old cells, were compared. First, we compared the gene expression patterns between uninfected GFs and F. _nucleatum-_infected GFs at early (P4) and late passages (P22). From this analysis, we identified eighty-eight and forty genes that were significantly differentially expressed in F. _nucleatum-_infected GF(P4) and GF(P22) cells, respectively, compared to the corresponding uninfected cells (Fig 3A). These gene sets therefore represent host responses to F. nucleatum infection in young (P4) and aged (P22) GFs, respectively. We also directly compared the transcriptome profiles of both GF(P4) and GF(P22) cells following F. nucleatum infection, as well as uninfected GF(P4) and GF(P22) cells, to identify gene expression changes relating to aging following infection, or to identify gene expression changes related to aging itself. As shown in Fig 3A, we did not find any genes that were significantly altered between uninfected GF(P4) and uninfected GF(P22) cells; however, we found sixty-two genes that were significantly differentially expressed between F. _nucleatum_-infected GF(P4) and F. _nucleatum_-infected GF(P22) cells. These sixty-two genes represent aging-related changes in the host response to F. nucleatum infection.
Fig 3. Strategy for the analysis of RNA-seq data.
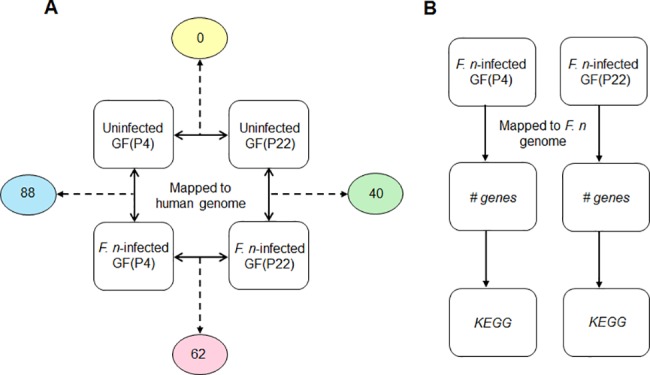
(A) The RNA-seq data was mapped onto the human genome and the indicated comparisons were conducted. The number of DEGs from each comparison is indicated in the circle. (B) The RNA-seq data were mapped onto the Fusobacterium nucleatum genome.
Full lists of all of these differentially expressed genes are shown in S2, S3 and S4 Tables. Intriguingly, in GF(P4) cells, only a few genes (3%, 3 out of 88) were downregulated by infection, whereas the vast majority of the DEGs (97%, 85 out of 88) were upregulated by infection (Fig 4A). However, compared to GF(P4) cells, a relatively greater percentage of DEGs (32.5%, 13 out of 40) in GF(P22) cells were found to be downregulated by infection; conversely, 67.5% of DEGs (27 out of 40) were upregulated by infection (Fig 4B). In addition, when F. _nucleatum_-infected GF(P4) cells were compared with F. _nucleatum_-infected GF(P22) cells, 70% of the DEGs (43 out of 62) were downregulated in the F. _nucleatum_-infected GF(P22) cells (Fig 4C).
Fig 4. Heat maps for the different gene expression comparisons.
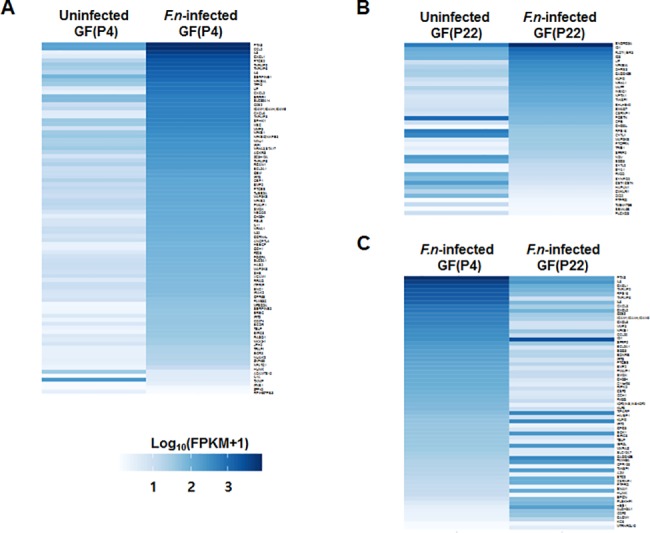
(A) Heat map of the eighty-eight DEGs identified between uninfected GF(P4) and F. _nucleatum_-infected GF(P4) cells. (B) Heat map of the forty DEGs identified between uninfected GF(P22) and _Fusobacterium nucleatum_-infected GF(P22) cells. (C) Heat map of the sixty-two DEGs identified between F. _nucleatum_-infected GF(P4) and F. _nucleatum_-infected GF(P22) cells. Genes were considered to be significantly differentially expressed if they obtained a q < 0.05 using a Benjamini-Hochberg multiple testing adjustment.
To investigate how F. nucleatum itself responds to the host age status, we collected all the sequence reads that were unmapped to the human genome and mapped them to the F. nucleatum genome, and in this way we identified F. nucleatum genes that were differentially expressed in GFs according to host age. A comparison of the gene expression of F. nucleatum in GF(P4) and GF(P22) cells was carried out and we found 391 and 224 genes that were highly expressed (more than a 10-fold increase) in these cells, respectively (S1 Table). We then analyzed the pathways these bacterial genes were involved in using the KEGG database. As a result, a relatively large number of the F. nucleatum genes (65 out of 391) in GF(P4) could be mapped to metabolic pathways, compared to those (11 out of 224) in GF(P22). When we compared the different bacterial pathways active in GF(P4) and GF(P22) cells, a larger variety of pathways were detected in GF(P4). For example, glycolysis, fatty acid metabolism, butyrate metabolism, and LPS/peptidoglycan biosynthesis pathways were identified as being highly expressed in F. _nucleatum_-infected GF(P4) cells, but none of these pathways appeared to be highly expressed in F. _nucleatum_-infected GF(P22) cells.
GO enrichment analysis of DEGs
Next, to investigate the biological relevance of these DEGs, we performed a GO analysis using the GATHER database. The top five significant GO annotations for each DEG set are listed in Table 2. It is notable that the relevant GO biological processes identified in the DEGs in response to infection in GF(P4) cells were remarkably different to those GO biological processes identified in response to infection in GF(P22) cells.
Table 2. Top five enriched GO terms for the DEGs from each comparison.
| Comparison groups | GO annotation | _p_-value* | Genes |
|---|---|---|---|
| DEGs from uninfected GF(P4) vs. F. _n_-infected GF(P4) | GO:0006955 [4]: immune response | <0.0001 | CCL2, CXCL1, CXCL2, CXCL6, GBP1, GEM, GPR68, IFIT2, IFIT3, IFNB1, IL11, IL1A, IL32, IL6, IL8, IRAK2, IRF1, LIF, NFKB1, PDCD1LG1, PTGES,PTGS2, PTX3, TNFAIP6 |
| GO:0006952 [5]: defense response | <0.0001 | CCL2, CXCL1, CXCL2, CXCL6, GBP1, GEM, GPR68, IFIT2, IFIT3, IFNB1, IL11, IL1A, IL32, IL6, IL8, IRAK2, IRF1, LIF, NFKB1, PDCD1LG1, PTGES, PTGS2, PTX3, TNFAIP6 | |
| GO:0009607 [4]: response to biotic stimulus | <0.0001 | CCL2, CXCL1, CXCL2, CXCL6, GBP1, GEM, GPR68, IFIT2, IFIT3, IFNB1, IL11, IL1A, IL32, IL6, IL8, IRAK2, IRF1, LIF, NFKB1, NFKBIA, PDCD1LG1, PTGES, PTGS2, PTX3, TNFAIP6 | |
| GO:0051243 [5]: negative regulation of cellular physiological processes | <0.0001 | ANGPTL4, BCL2A1, BIRC3, CCL2, CXCL1, IFNB1, IL1A, IL6, IL8, NFKB1, NFKBIA, SERPINB2, TNFAIP3, TNFAIP8 | |
| GO:0006954 [5]: inflammatory response | <0.0001 | CCL2, CXCL1, CXCL2, CXCL6, GPR68, IL1A, IL8, IRAK2, NFKB1, PTGS2, PTX3, TNFAIP6 | |
| DEGs from uninfected GF(P22) vs. F. _n_-infected GF(P22) | GO:0007179 [8]: transforming growth factor beta receptor signaling pathway | <0.0001 | FMOD, KLF10, SMAD7 |
| GO:0007178 [7]: transmembrane receptor protein serine/threonine kinase signaling pathway | 0.0001 | FMOD, KLF10, SMAD7 | |
| GO:0007167 [6]: enzyme-linked receptor protein signaling pathway | 0.0004 | FMOD, KLF10, PTPRD, SMAD7 | |
| GO:0007275 [2]: development | 0.0008 | CMKLR1, EYA1, GADD45B, ID1, ID3, IER3, KLF10, LIF, NOV, NPTX1, POSTN, SEMA6B | |
| GO:0001501 [5]: skeletal development | 0.04 | CMKLR1, KLF10, POSTN | |
| DEGs from F. _n_-infected GF(P4) vs. F. _n_-infected GF(P22) | GO:0006954 [5]: inflammatory response | <0.0001 | CCL20, CXCL1, CXCL2, CXCL3, CXCL6, IL8, NFKB1, PTX3, RIPK2, TNFAIP6 |
| GO:0009611 [5]: response to wounding | <0.0001 | CCL20, CSF2, CXCL1, CXCL2, CXCL3, CXCL6, IL8, NFKB1, PTX3, RIPK2, TNFAIP6 | |
| GO:0006955 [4]: immune response | <0.0001 | CCL20, CSF2, CXCL1, CXCL2, CXCL3, CXCL6, IFIT2, IFIT3, IL6, IL8, KLF6, NFKB1, PTGES, PTX3, RIPK2, TNFAIP6 | |
| GO:0009613 [5]: response to pest, pathogen, or parasite | <0.0001 | CCL20, CSF2, CXCL1, CXCL2, CXCL3, CXCL6, IL6, IL8, NFKB1, PTGES, PTX3, RIPK2, TNFAIP6 | |
| GO:0043207 [5]: response to external biotic stimulus | <0.0001 | CCL20, CSF2, CXCL1, CXCL2, CXCL3, CXCL6, IL6, IL8, NFKB1, PTGES, PTX3, RIPK2, TNFAIP6 |
For example, the eighty-eight DEGs identified in infected GF(P4) cells were more likely to be involved in host defense to bacterial infection such as immune responses, response to biotic stimulus, and inflammatory responses. However, the forty-four DEGs in infected GF(P22) cells were highly involved in cell maintenance such as the transforming growth factor beta receptor signaling pathway and skeletal development. Moreover, the sixty-two DEGs identified between F. _nucleatum_-infected GF(P4) and GF(P22) cells were associated with host responses to bacterial infection such as inflammatory responses, response to wounding, and immune responses.
Analysis of young GF(P4)- and aged GF(P22)-specific DEGs
The eighty-eight DEGs identified in F. _nucleatum_-infected GF(P4) cells, the forty DEGs from F. _nucleatum_-infected GF(22) cells, and the sixty-two DEGs found in F. _nucleatum_-infected GF(P4) versus GF(22) cells, were compared using an overlap analysis. As a result, we identified twenty-four DEGs that were overlapping between the eighty-eight F. _nucleatum_-infected GF(P4) DEGs and the sixty-two F. _nucleatum_-infected GF(P4) versus GF(22) DEGs. We also identified ten DEGs that were overlapping between the forty F. _nucleatum_-infected GF(22) DEGs and the sixty-two F. _nucleatum_-infected GF(P4) versus GF(22) DEGs (Fig 5A and 5B). These genes represent young GF(P4)- and aged GF(P22)-specific genes that respond to infection. Moreover, we directly compared the eighty-eight F. _nucleatum_-infected GF(P4) DEGs and the forty F. _nucleatum_-infected GF(22) DEGs, and as a result we identified only four overlapping genes (Fig 5C). These four genes reflect a common response to F. nucleatum infection between young GF(P4) and old GF(P22) cells. These overlapping gene are listed in Tables 3, 4 and 5. In addition, a heatmap showing the expression levels of these overlapping genes is shown in S1 Fig. The expression levels of both the twenty-four genes and the ten genes described above were significantly changed in GF(P4) and GF(P22), respectively, after infection with F. nucleatum (S1A and S1B Fig). The four genes described above had the same pattern of expression in both young GF(P4) and aged GF(P22) cells in response to F. nucleatum infection (S1C Fig), and these genes represent the age-independent host response to F. nucleatum infection. The differential gene expression results obtained by RNA sequencing analysis were validated by performing quantitative real-time PCR analysis using three biological replicates for each gene. S2 Fig. shows that there was a significant concordance between the RNA-seq data and the q-RT PCR data for each of the three sets of DEGs we identified, with Pearson’s correlation coefficient values ranging from R = 0.96~0.98 (_p_-values<0.0001).
Fig 5. Venn diagram summarizing the overlap analysis of DEGs from the three paired comparisons.
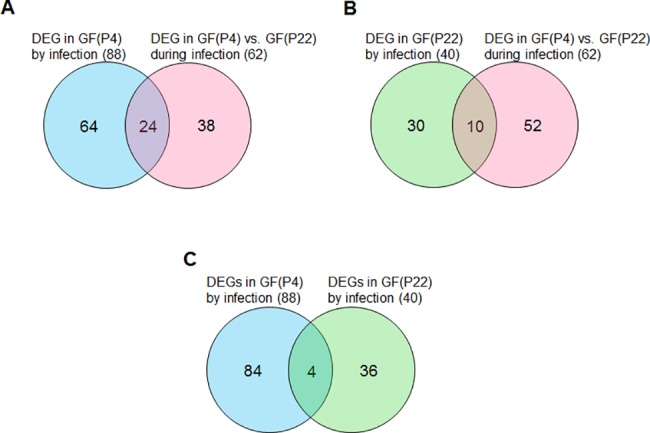
(A) Young GF(P4)-specific response to infection. (B) Aged GF(P22)-specific response to infection. (C) Common genes in young (P4) and aged (P22) GFs in response to infection.
Table 3. List of genes that are differentially expressed in GF(P4) cells following Fusobacterium nucleatum infection and are also differentially expressed between F. _nucleatum_-infected GF(P4) and F. _nucleatum_-infected GF(P22) cells.
| Gene Symbol | F. _n_-infected GF(P4)(FPKM) | F. _n_-infected GF(P22)(FPKM) | Fold change | _p_-value | _q_-value | Description |
|---|---|---|---|---|---|---|
| IL8 | 1649.19 | 118.884 | 13.9 | 0.0001 | 0.023 | immediate early response 5-like |
| PTX3 | 2807.05 | 85.6365 | 32.8 | 0.0001 | 0.023 | pentraxin 3 |
| CXCL1 | 1165.34 | 52.8973 | 22.0 | 0.0001 | 0.023 | chemokine (C-X-C motif) ligand 1 (melanoma growth stimulating activity, alpha) |
| CXCL2 | 312.759 | 44.7769 | 7.0 | 0.0001 | 0.023 | chemokine (C-X-C motif) ligand 2 |
| LOC102723726,TNFAIP2 | 827.893 | 42.7072 | 19.4 | 0.0001 | 0.023 | TNF alpha induced protein 2 |
| IL6 | 567.623 | 36.2704 | 15.6 | 0.0001 | 0.023 | interleukin 6 |
| NFKB1 | 163.171 | 21.6904 | 7.5 | 0.0001 | 0.023 | nuclear factor of kappa light polypeptide gene enhancer in B-cells 1 |
| G0S2 | 233.399 | 16.3777 | 14.3 | 0.0001 | 0.023 | G0/G1 switch 2 |
| ICAM1,ICAM4,ICAM5 | 232.878 | 13.0559 | 17.8 | 0.0001 | 0.023 | intercellular adhesion molecule |
| PTGES | 65.8038 | 9.17048 | 7.2 | 0.0001 | 0.039 | prostaglandin E synthase |
| PMAIP1 | 58.0263 | 6.98736 | 8.3 | 0.0002 | 0.048 | phorbol-12-myristate-13-acetate-induced protein 1 |
| SMOX | 57.2027 | 6.56187 | 8.7 | 0.0001 | 0.039 | spermine oxidase |
| TNFAIP6 | 695.135 | 4.63915 | 149.8 | 0.0001 | 0.023 | TNF alpha induced protein 6 |
| MMP3 | 185.183 | 4.15238 | 44.6 | 0.0001 | 0.023 | matrix metallopeptidase 3 |
| IFIT3 | 78.4845 | 4.11153 | 19.1 | 0.0001 | 0.023 | interferon induced protein with tetratricopeptide repeats 3 |
| CXCL6 | 230.687 | 3.81264 | 60.5 | 0.0001 | 0.023 | chemokine (C-X-C motif) ligand 6 |
| BIRC3 | 20.9153 | 3.06231 | 6.8 | 0.0001 | 0.023 | baculoviral IAP repeat containing 3 |
| BCL2A1 | 100.231 | 2.99886 | 33.4 | 0.0001 | 0.023 | BCL2-related protein A1 |
| GCH1 | 41.9286 | 2.97619 | 14.1 | 0.0002 | 0.048 | GTP cyclohydrolase 1 |
| BMP2 | 65.7944 | 2.7264 | 24.1 | 0.0001 | 0.023 | bone morphogenetic protein 2 |
| CH25H | 55.7454 | 2.58238 | 21.6 | 0.0001 | 0.039 | cholesterol 25-hydroxylase |
| TSLP | 20.9051 | 1.09448 | 19.1 | 0.0002 | 0.048 | thymic stromal lymphopoietin |
| IFIT2 | 22.3563 | 0.731211 | 30.6 | 0.0001 | 0.023 | interferon induced protein with tetratricopeptide repeats 2 |
| HUNK | 6.15449 | 0.343262 | 17.9 | 0.0001 | 0.023 | hormonally upregulated Neu-associated kinase |
Table 4. List of genes that are differentially expressed in GF(P22) cells following Fusobacterium nucleatum infection and are also differentially expressed between F. _nucleatum_-infected GF(P4) and F. _nucleatum_-infected GF(P22) cells.
| Gene Symbol | F. _n_-infected GF(P4)(FPKM) | F. _n_-infected GF(P22)(FPKM) | Fold change | _p_-value | _q_-value | Description |
|---|---|---|---|---|---|---|
| ID1 | 150.823 | 1044.03 | 6.9 | 0.00005 | 0.023 | inhibitor of DNA binding 1, dominant negative helix-loop-helix protein |
| GADD45B | 14.0317 | 196.617 | 14.0 | 0.00005 | 0.023 | growth arrest and DNA damage inducible beta |
| KLF10 | 23.1319 | 172.259 | 7.4 | 0.00005 | 0.023 | Kruppel-like factor 10 |
| TM4SF1 | 10.2752 | 91.4458 | 8.9 | 0.00005 | 0.023 | transmembrane 4 L six family member 1 |
| CSRNP1 | 7.34259 | 54.0771 | 7.4 | 0.00005 | 0.023 | cysteine-serine-rich nuclear protein 1 |
| RPS16 | 798.429 | 27.7512 | 0.0 | 0.00005 | 0.023 | ribosomal protein S16 |
| SFRP2 | 113.416 | 17.6024 | 0.2 | 0.00015 | 0.048 | secreted frizzled-related protein 2 |
| SOD3 | 87.2911 | 10.8697 | 0.1 | 0.00005 | 0.023 | superoxide dismutase 3, extracellular |
| PTPRD | 6.89248 | 0.499976 | 0.1 | 0.00005 | 0.023 | protein tyrosine phosphatase, receptor type, D |
| FMOD | 39.7058 | 6.48497 | 0.2 | 0.00015 | 0.048 | fibromodulin |
Table 5. List of genes that are differentially expressed in GF(P4) cells following Fusobacterium nucleatum infection and in GF(P22) cells following F. nucleatum infection.
| Gene Symbol | Description | Uninfected GF(P4) (FPKM) | F. nucleatum -infected GF(P4) (FPKM) | Fold change | _p_-value | _q_-value | Uninfected GF(P22) (FPKM) | F. nucleatum -infected GF(P22) (FPKM) | Fold change | _p_-value | _q_-value |
|---|---|---|---|---|---|---|---|---|---|---|---|
| LIF | leukemia inhibitory factor | 2.4761 | 328.352 | 132.6 | 0.0001 | 0.012 | 6.85492 | 355.645 | 51.9 | 5E-05 | 0.030 |
| NFKBIA | nuclear factor of kappa light polypeptide gene enhancer in B-cells inhibitor, alpha | 22.5946 | 402.558 | 17.8 | 0.0001 | 0.012 | 15.7592 | 299.9 | 19.0 | 5E-05 | 0.030 |
| MAP3K8 | mitogen-activated protein kinase kinase kinase 8 | 5.01763 | 61.4196 | 12.2 | 0.0001 | 0.012 | 2.81459 | 27.6778 | 9.8 | 5E-05 | 0.030 |
| NR4A1 | nuclear receptor subfamily 4 group A member 1 | 5.52154 | 49.976 | 9.1 | 0.0001 | 0.012 | 3.62807 | 176.594 | 48.7 | 5E-05 | 0.030 |
Functional annotation of DEGs by each comparison
To investigate the biological relevance of the gene sets described above, we functionally annotated the DEGs using the knowledge database IPA. The top 10 detailed categories of each set of DEGs presented in S2, S3, S4 and Tables and Tables 3 and 4 are listed in Table S5.the data showed a similar pattern as the GO analysis. For example, the biological functions of DEGs identified in young GF(P4) cells in response to infection (cell death and survival-related functions such as apoptosis, cell death, and proliferation) were distinctly different from the biological functions of DEGs identified in aged GF(P22) in response to infection (skeletal and cellular development-related functions such as morphology of skeleton, differentiation of connective tissue cells, and abnormal morphology of skeleton). Moreover, the DEGs identified using a direct comparison between F. _nucleatum_-infected young GF(P4) and F. _nucleatum_-infected aged GF(P22) cells revealed genes that are involved in cell death and survival-related functions such as apoptosis, cell death, and necrosis. In a similar context, young F. _nucleatum_-infected GF(P4)-specific DEGs were involved in immune responses such as esophagitis, osteoarthritis, and inflammatory responses, whereas aged F. _nucleatum_-infected GF(P22)-specific DEGs were associated with connective tissue disorders or developmental processes such as abnormal morphology of the skeleton and abnormal morphology of limb bones.
Network predicted by IPA
To investigate the possible interactions between these differentially regulated genes, a network analysis of F. _nucleatum_-infected young GF(P4)-specific and F. _nucleatum_-infected aged GF(P22)-specific DEGs was performed using IPA. The most significant molecular networks are shown in Fig 6A and 6B. The F. _nucleatum_-infected young GF(P4)-specific DEGs were highly associated with networks for gastrointestinal disease, inflammatory disease, organismal injury, and abnormalities pathways (score 33 and focus molecules 13). All of these DEGs were upregulated in F. _nucleatum_-infected GF(P4) cells, when compared to F. _nucleatum_-infected GF(P22) cells, and the majority of genes were related to NF-kB activation and various chemokines. Moreover, F. _nucleatum_-infected GF(P22)-specific DEGs were highly associated with networks for free radical scavenging, cell cycle, and cancer (score 30 and focus molecules 13). One gene involved in free radical scavenging, SOD3, was downregulated, whereas the genes associated with cell cycle or cancer, including GADD45B, ID1, KLF10, CSRNP1, and TM4SF1, were upregulated in F. _nucleatum_-infected GF(P22) cells when compared to F. _nucleatum_-infected GF(P4) cells. It is notable that all the upregulated DEGs in F. _nucleatum_-infected GF(P4) cells were localized in the nucleus and cytoplasm. Although the upregulated genes in F. _nucleatum_-infected GF(P22) cells were also localized in the nucleus, the downregulated genes were localized in the cytoplasm (S3 Fig).
Fig 6. Networks predicted by IPA for the DEGs.
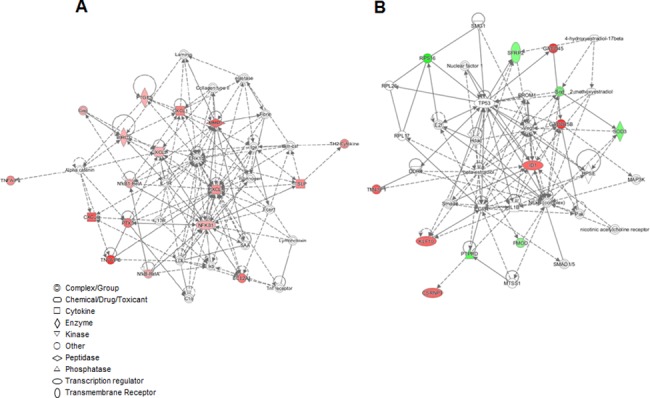
IPA network analysis of the genes from (A) young GF(P4)-specific response to F. nucleatum infection and the genes from (B) aged GF(P22)-specific response to F. nucleatum infection. The network is displayed graphically as nodes (genes). The node color intensity indicates the expression of genes, with red representing upregulation and green representing downregulation. Solid lines and dotted lines indicate direct relationship and indirect relationships, respectively. Red and blue denote upregulated and downregulated DEGs, respectively.
Discussion
Using RNA-seq technology, this study reports a novel, quantitative, and comprehensive gene expression mapping in GFs following F. nucleatum infection, and furthermore examines the effect of cell age. In previous studies, we have shown that F. nucleatum infection in GFs triggers ROS generation, which is involved in the host defense mechanism. This activation of NADPH oxidase occurs 2 h post-infection with F. nucleatum [6], and was reduced in aged GF(P22) cells [8]. In the present study, we used an RNA-seq strategy to assess the overall impact of aging on the host response to F. nucleatum at an early stage of infection (2 h), which exhibiting bacterial invasion and host defense mechanisms, according to previous studies [6, 8]. We also attempted to determine changes in the F. nucleatum gene expression pattern between old and young infected GFs using the same RNA-seq technology.
RNA-seq has been widely used in many differential gene expression studies [32, 33]. It is a comprehensive and systematic approach to defining the transcriptome of an organism with minimal bias [34], that can be used across various cell types and experimental settings [35, 36], without specific probes or cross-hybridization issues. However, parallel RNA-Seq profiling of both prokaryotic and eukaryotic gene expression in bacterially-infected cells is technically challenging. Total RNA extracted from bacterially-infected mammalian cells is a heterogeneous mixture of host and bacterial RNAs. Ribosomal RNA (rRNA) is the most abundant RNA in the cell (accounting for up to 98% of total RNA) [34]. Bacterial mRNA is typically a minor portion of the total RNA in an infected host cell. To approach bacterial RNA sequencing, many studies have tried to directly isolate bacterial mRNA from eukaryotic mRNA to then amplify it because it is present at extremely low levels. However, this could result in unnecessary loss and over interpretation by RNA amplification of small amounts. Thus, in this study we favored a deep RNA-seq (20 Gb depth) approach, rather than the typical depth for eukaryotic RNA-seq of 6 Gb, in order to be able to obtain reads for bacterial mRNAs. As a result, when we mapped the RNA-seq data onto the F. nucleatum genome sequence, almost 70% of the open reading frames appeared from the total RNA-seq data. By comparing bacterial gene expression between F. _nucleatum_-infected young (P4) and aged (P22) GFs, we identified 391 F. nucleatum genes that were highly expressed specifically in infected GF(P4) cells when compared to F. _nucleatum_-infected GF(P22) cells. In contrast, 224 F. nucleatum genes were highly expressed in infected GF(P22) cells, when compared to infected GF(P4) cells. Interestingly, the F. nucleatum genes that were highly expressed in GF(P4) cells were involved in numerous metabolic pathways including glycolysis, lipid metabolism, and biosynthesis of cell wall components. These data indicate that, during F. nucleatum infection, the host immune response predominates in young GF(P4) cells, but not in aged GF(P22) cells.
GFs act as the first physical line of defense against oral microflora and locally orchestrate immune reactions following specific recognition of pathogen-associated molecular patterns by their respective TOLL-like receptors (TLRs) [37]. F. nucleatum is considered to be more of an opportunistic pathogen that may participate in the disease process when environmental conditions allow it. From our RNA-seq data, it is notable that, among the more than 38,000 genes tested, IL-8 expression was the most significantly increased gene (about 1900-fold upregulation) in young GFs following F. nucleatum infection. IL-8 is a key chemokine for the accumulation of neutrophils. A similar upregulation of IL-8 has been found in epithelial cells infected with H. pylori [38] suggesting that it is of paramount importance in the acute inflammatory response following H. pylori infection. Several other groups have also demonstrated an increase in IL-8 in response to H. pylori infection both in vivo [39], and in vitro [40]. These data are therefore consistent with our results in F. _nucleatum_-infected young GFs. As expected from our previous study [8], the levels of IL-8 and IL-6 were significantly decreased in F. _nucleatum_-infected aged GF(P22) cells compared to that in F. _nucleatum_-infected young GF(P4) cells (S4 Table). According to Eftang et al., the increase in IL-8 in H. _pylori_-infected gastric epithelial cells can be explained by the upregulation of NF-kB, TNFAIP3, RELB, and BIRC3 [38]. We also found that these same four genes were upregulated in F. _nucleatum_-infected young GF(P4) cells (S2 Table), but not in F. _nucleatum_-infected aged GF(P22) cells (S3 Table).
One representative antioxidant enzyme, SOD3, was found to be downregulated in F. _nucleatum_-infected aged GF(P22) cells compared to F. _nucleatum_-infected young GF(P4) cells (Table 4 and S4 Table). SOD catalyzes the dismutation of two superoxide anion radicals into superoxide and hydrogen peroxide, which can then be removed by the actions of catalase, glutathione peroxidases, and peroxidases [41]. Three types of SOD exist in cells, Cu, Zn-SOD (SOD1) in the cytosol, and Mn-SOD (SOD2) in mitochondria. The third form, also containing Cu and Zn (SOD3), is found extracellularly. There have been numerous studies examining changes in SOD activity with aging, but the results have been inconsistent. It has also been reported that there is an increase in SOD3 with aging in the prostatic lobes [42] and renal cortex of rats [43]. In contrast, SOD3 expression has been reported to be decreased in retinal pigment epithelial cells from older donors compared to those from younger donors [44]. Similarly, lipopolysaccharide (LPS)-treated mice showed an age-associated decrease in the expression of SOD3. Although the data in the literature are inconsistent, the latter two studies do support our data.
To the best of our knowledge, this is the first study that has used RNA-seq and IPA to assess the effect of aging and infection on the transcriptome of primary GFs. The IPA network analysis revealed that infection induced aged GF(P22)-specific DEGs were connected to each other (Fig 6) and the upregulated genes (Id1, KLF10, GADD45b, and CSRNP1) were all mainly localized in the nucleus (S3 Fig). These nuclear genes might be involved in mediating the downregulation of other target genes in aged GF(P22) cells during F. nucleatum infection.
Id1 is known to play a role in the control of senescence in vitro. In fact, Swarbrick et al. have also reported that overexpression of Id1 regulates senescence in vivo [45]. Id family proteins (Id1, Id2, Id3, and Id4) have been implicated in a variety of biological processes including cellular growth, senescence, differentiation, apoptosis, angiogenesis, and T-cell receptor signaling [46], although the role of Id family members in the regulation of these functions and the exact mechanisms are still under active investigation. The aging-related host responses that have been described so far for Id1 raise questions about its role in periodontal diseases, but currently very little is known.
KLF10 is a TGF-β responsive gene that plays a role in human osteoblasts [47]. Using knockout mice, Subramaniam et al., have described a critical role for KLF10 in osteoblast-mediated mineralization, as well as osteoblast support of osteoclast differentiation [48]. Moreover, KLF10 has been shown to have a role as either a transcriptional activator or suppressor, depending on the cell line examined [49].
GADD45B is a member of a group of genes that are usually upregulated in response to stressful growth arrest or DNA damage [50], and it has also been reported that GADD45B has pro-apoptotic activity [51]. GADD45B is therefore associated with many processes during cellular adaptation to a diverse array of cellular stresses including apoptosis, DNA repair, and cell cycle delay [52]. Chen et al., have suggested that the role of GADD45B in cell stress responses is complex, and that it can exert either protective or deleterious effects depending on the type of cell and the insult [52].
Using multiple computational tools, a prioritized list of twenty-one candidate genes involved in periodontitis has recently been reported. Among these promising genes, involved, or potentially involved, in periodontitis CXCL1 and MMP3 were also identified in our present study as being gene induced in young GFs in response to F. nucleatum infection. In contrast, the roles of GADD45B and BIRC3 have not been thoroughly investigated in the progression of periodontitis [53]. In our study, GADD45B was identified as being one of the upregulated genes in aged GF(P22) cells compared to that in young GF(P4) cells in a setting of F. nucleatum infection. It would be interesting to further investigate the role of GADD45b in the development of periodontitis in elderly subjects.
The current study has several limitations. First, this study contains a low number of biological replicates. However, the RNA-seq analysis was performed in combination with deep sequencing (20 Gb). Other studies support our approach by suggesting that most RNA-seq studies have high technical reproducibility means that a large number of technical replicates is not necessary [54], but this fact does not improve the need for biological replicates in order to make statistical inferences [55]. Moreover, large-scale RNA-seq studies with extensive differential expression analyses have frequently used limited biological replicas, favoring in its place a strategy of a low number of biological replicas coupled with deep sequencing [56, 57]. Nevertheless, to minimize the concern about biological replicates, we validated the differential expression of several gene sets using a q-PCR assay. Second, this study was based on an in vitro model. Several studies have been performed using in vivo samples, such as gingival tissue from patient with periodontitis, or aged patients [7, 58, 59]. In our previous study in which we used RNA-seq to analyze gingival tissue from young and aged subjects with no periodontal disease we found a major difference in matrix metalloprotease (MMP) expression in aged gingiva [7]. Although this result might provide a potential molecular target involved in gingival aging, it does not explain why aged patients are more susceptible to bacterial infection. Moreover, the gingival tissue used in that study contained many different cell types (i.e. it was heterogeneous), and it is likely that the natural aging process itself increases the likelihood of the gingival tissue being exposed to a number of external stimulants such as physical stress, bacterial contaminants, as well as other contaminants, thus inhibiting optimal analysis. Therefore, in the present study, we elected to focus on a specific cell type and used an in vitro model employing aging primary GFs.
Nevertheless, the results of this study suggest that the potential target genes identified here, especially the five genes upregulated in GF(P22) cells during F. nucleatum infection, might contribute to the aged GF(P22) response to F. nucleatum infection, which could leave aged GF(P22) susceptible to infection. In addition, we also attempted to investigate the pattern of bacterial gene expression within host cells. Taken together, our study provides important insights into the transcriptome profiling of GFs in response to F. nucleatum infection. Further investigation to elucidate the function of target genes in aged GFs will contribute to a better understanding of the mechanism by which aged cells behave following bacterial infection. In addition, these target genes might serve as potential markers for aging-related periodontal diseases.
Supporting information
S1 Fig. Heat maps of DEGs.
(A) Heat map of the twenty-four DEGs that were overlapping between the eighty-eight F. _nucleatum_-infected GF(P4) DEGs and the sixty-two F. _nucleatum_-infected GF(P4) versus GF(22) DEGs (B) Heat map of the ten DEGs that were overlapping between the forty F. _nucleatum_-infected GF(22) DEGs and the sixty-two F. _nucleatum_-infected GF(P4) versus GF(22) DEGs (C) Heat map of the four genes that were overlapping between eighty-eight F. _nucleatum_-infected GF(P4) DEGs and the forty F. _nucleatum_-infected GF(22) DEGs.
(TIF)
S2 Fig. Validation of the number of biological replicates used for DEG analysis by quantitative real-time PCR analysis.
The expression of selected genes from the RNA sequencing data was validated by real-time PCR analysis. The x-axis represents log2 (fold change) obtained by RNA sequencing and the y-axis indicates the–ΔΔCt values. The linear regression was performed using Pearson’s correlation (R) and the corresponding p value is based in the gene expression values by both methods. (A) Twenty-eight genes upregulated in GF(P4) cells in response to F. nucleatum infection (B) Fourteen up- or down-regulated genes in GF(P22) cells in response to F. nucleatum infection, and (C) the four genes found in common in GF(P4) and GF(P22) in response to F. nucleatum infection.
(TIF)
S3 Fig. Subcellular networks in the DEGs predicted by IPA.
(A) Subcellular network analysis of the genes from (A) young GF(P4)-specific response to F. nucleatum infection and (B) aged GF(P22)-specific response to F. nucleatum infection.
(TIF)
S1 Table. F. nucleatum genes upregulated in GF(P4) or GF(P22) cells.
The reads (FPKM) for F. nucleatum were compared between infected GF(P4) and GF(P22) cells.
(XLS)
S2 Table. DEGs identified between uninfected GF(P4) and F. _nucleatum_-infected GF(P4) cells.
(XLS)
S3 Table. DEGs identified between uninfected GF(P22) and F. _nucleatum_-infected GF(P22) cells.
(XLS)
S4 Table. DEGs identified between F. _n_-infected GF(P4) and F. _nucleatum_-infected GF(P22) cells.
(XLS)
S5 Table. Summary of the top five functional annotations of DEGs from each comparison.
All DEG datasets were analyzed using IPA software. The significance value associated with a function in Global Analysis is a measure of the likelihood that a gene from the dataset file under investigation participates in that function. The significance is expressed as a p-value, which is calculated using a right-tailed Fisher's Exact Test.
(XLS)
Acknowledgments
We thank Dr. Seunggon Jung for kindly providing the human GFs.
Data Availability
All relevant data are within the paper and its Supporting Information files. All high-throughput sequencing data files are available from the GenBank Sequence Read Archive (SRA). Accession number: SRP108236.
Funding Statement
This work was supported by the Bio & Medical Technology Development Program (2016M3A9B6903087) and the Basic Science Research Program (2017R1A2B2005938) of the National Research Foundation (NRF) funded by the Ministry of Science, ICT & Future Planning. Sun Hee Ahn was supported by the Basic Science Research Program (2016R1A6A3A11932468) through the NRF funded by the Ministry of Education and The grant from the World Institute of Kimchi (KE1701-2) to Dr. Jong-Hee Lee. The funders had no role in study design, data collection and analysis, decision to publish, or preparation of the manuscript.
References
- 1.Armitage GC. Development of a classification system for periodontal diseases and conditions. Ann Periodontol. 1999;4(1):1–6. doi: 10.1902/annals.1999.4.1.1 . [DOI] [PubMed] [Google Scholar]
- 2.Kolenbrander PE. Oral microbial communities: biofilms, interactions, and genetic systems. Annu Rev Microbiol. 2000;54:413–37. doi: 10.1146/annurev.micro.54.1.413 . [DOI] [PubMed] [Google Scholar]
- 3.van Winkelhoff AJ, Loos BG, van der Reijden WA, van der Velden U. Porphyromonas gingivalis, Bacteroides forsythus and other putative periodontal pathogens in subjects with and without periodontal destruction. Journal of clinical periodontology. 2002;29(11):1023–8. . [DOI] [PubMed] [Google Scholar]
- 4.Diaz PI, Zilm PS, Rogers AH. Fusobacterium nucleatum supports the growth of Porphyromonas gingivalis in oxygenated and carbon-dioxide-depleted environments. Microbiology. 2002;148(Pt 2):467–72. doi: 10.1099/00221287-148-2-467 . [DOI] [PubMed] [Google Scholar]
- 5.Signat B, Roques C, Poulet P, Duffaut D. Fusobacterium nucleatum in periodontal health and disease. Current issues in molecular biology. 2011;13(2):25–36. . [PubMed] [Google Scholar]
- 6.Ahn SH, Song JE, Kim S, Cho SH, Lim YK, Kook JK, et al. NOX1/2 activation in human gingival fibroblasts by Fusobacterium nucleatum facilitates attachment of Porphyromonas gingivalis. Arch Microbiol. 2016;198(6):573–83. doi: 10.1007/s00203-016-1223-7 . [DOI] [PubMed] [Google Scholar]
- 7.Kim S, Ahn SH, Lee JS, Song JE, Cho SH, Jung S, et al. Differential Matrix Metalloprotease (MMP) Expression Profiles Found in Aged Gingiva. PloS one. 2016;11(7):e0158777 doi: 10.1371/journal.pone.0158777 ; PubMed Central PMCID: PMCPMC4938517. [DOI] [PMC free article] [PubMed] [Google Scholar]
- 8.Ahn SH, Cho SH, Song JE, Kim S, Oh SS, Jung S, et al. Caveolin-1 serves as a negative effector in senescent human gingival fibroblasts during Fusobacterium nucleatum infection. Molecular oral microbiology. 2016. doi: 10.1111/omi.12167 . [DOI] [PubMed] [Google Scholar]
- 9.Cekici A, Kantarci A, Hasturk H, Van Dyke TE. Inflammatory and immune pathways in the pathogenesis of periodontal disease. Periodontology 2000. 2014;64(1):57–80. doi: 10.1111/prd.12002 ; PubMed Central PMCID: PMCPMC4500791. [DOI] [PMC free article] [PubMed] [Google Scholar]
- 10.Birkedal-Hansen H. Role of matrix metalloproteinases in human periodontal diseases. Journal of periodontology. 1993;64(5 Suppl):474–84. doi: 10.1902/jop.1993.64.5s.474 . [DOI] [PubMed] [Google Scholar]
- 11.Rajendran M, Priyadharshini V, Arora G. Is immunesenescence a contributing factor for periodontal diseases? J Indian Soc Periodontol. 2013;17(2):169–74. doi: 10.4103/0972-124X.113064 ; PubMed Central PMCID: PMCPMC3713746. [DOI] [PMC free article] [PubMed] [Google Scholar]
- 12.Domon H, Tabeta K, Nakajima T, Yamazaki K. Age-related alterations in gene expression of gingival fibroblasts stimulated with Porphyromonas gingivalis. Journal of periodontal research. 2014;49(4):536–43. doi: 10.1111/jre.12134 . [DOI] [PubMed] [Google Scholar]
- 13.Krustrup U, Erik Petersen P. Periodontal conditions in 35–44 and 65-74-year-old adults in Denmark . Acta Odontol Scand. 2006;64(2):65–73. doi: 10.1080/00016350500377859 . [DOI] [PubMed] [Google Scholar]
- 14.Hajishengallis G. Too old to Fig.ht? Aging and its toll on innate immunity. Molecular oral microbiology. 2010;25(1):25–37. doi: 10.1111/j.2041-1014.2009.00562.x ; PubMed Central PMCID: PMCPMC2839454. [DOI] [PMC free article] [PubMed] [Google Scholar]
- 15.Yoshikawa TT. Aging and infectious diseases: state of the art. Gerontology. 1984;30(5):275–8. . [DOI] [PubMed] [Google Scholar]
- 16.Yoshikawa TT. Epidemiology and unique aspects of aging and infectious diseases. Clinical infectious diseases: an official publication of the Infectious Diseases Society of America. 2000;30(6):931–3. doi: 10.1086/313792 . [DOI] [PubMed] [Google Scholar]
- 17.Gavazzi G, Krause KH. Ageing and infection. Lancet Infect Dis. 2002;2(11):659–66. . [DOI] [PubMed] [Google Scholar]
- 18.Gavazzi G, Herrmann F, Krause KH. Aging and infectious diseases in the developing world. Clinical infectious diseases: an official publication of the Infectious Diseases Society of America. 2004;39(1):83–91. doi: 10.1086/421559 . [DOI] [PubMed] [Google Scholar]
- 19.Meyer KC. Aging. Proc Am Thorac Soc. 2005;2(5):433–9. doi: 10.1513/pats.200508-081JS . [DOI] [PubMed] [Google Scholar]
- 20.Harrison DE, Astle CM, Niazi MK, Major S, Beamer GL. Genetically diverse mice are novel and valuable models of age-associated susceptibility to Mycobacterium tuberculosis. Immun Ageing. 2014;11(1):24 doi: 10.1186/s12979-014-0024-6 ; PubMed Central PMCID: PMCPMC4299371. [DOI] [PMC free article] [PubMed] [Google Scholar]
- 21.Kang CI, Song JH, Ko KS, Chung DR, Peck KR. Clinical features and outcome of Staphylococcus aureus infection in elderly versus younger adult patients. Int J Infect Dis. 2011;15(1):e58–62. doi: 10.1016/j.ijid.2010.09.012 . [DOI] [PubMed] [Google Scholar]
- 22.Tal S, Guller V, Levi S, Bardenstein R, Berger D, Gurevich I, et al. Profile and prognosis of febrile elderly patients with bacteremic urinary tract infection. J Infect. 2005;50(4):296–305. doi: 10.1016/j.jinf.2004.04.004 . [DOI] [PubMed] [Google Scholar]
- 23.Shaik-Dasthagirisaheb YB, Kantarci A, Gibson FC 3rd. Immune response of macrophages from young and aged mice to the oral pathogenic bacterium Porphyromonas gingivalis. Immun Ageing. 2010;7:15 doi: 10.1186/1742-4933-7-15 ; PubMed Central PMCID: PMCPMC3001696. [DOI] [PMC free article] [PubMed] [Google Scholar]
- 24.Hayflick L, Moorhead PS. The serial cultivation of human diploid cell strains. Exp Cell Res. 1961;25:585–621. . [DOI] [PubMed] [Google Scholar]
- 25.Sharpless NE, DePinho RA. Telomeres, stem cells, senescence, and cancer. The Journal of clinical investigation. 2004;113(2):160–8. doi: 10.1172/JCI20761 ; PubMed Central PMCID: PMCPMC311439. [DOI] [PMC free article] [PubMed] [Google Scholar]
- 26.Campisi J. Senescent cells, tumor suppression, and organismal aging: good citizens, bad neighbors. Cell. 2005;120(4):513–22. doi: 10.1016/j.cell.2005.02.003 . [DOI] [PubMed] [Google Scholar]
- 27.Naylor RM, Baker DJ, van Deursen JM. Senescent cells: a novel therapeutic target for aging and age-related diseases. Clin Pharmacol Ther. 2013;93(1):105–16. doi: 10.1038/clpt.2012.193 ; PubMed Central PMCID: PMCPMC4051295. [DOI] [PMC free article] [PubMed] [Google Scholar]
- 28.Bolger AM, Lohse M, Usadel B. Trimmomatic: a flexible trimmer for Illumina sequence data. Bioinformatics. 2014;30(15):2114–20. doi: 10.1093/bioinformatics/btu170 ; PubMed Central PMCID: PMCPMC4103590. [DOI] [PMC free article] [PubMed] [Google Scholar]
- 29.Trapnell C, Roberts A, Goff L, Pertea G, Kim D, Kelley DR, et al. Differential gene and transcript expression analysis of RNA-seq experiments with TopHat and Cufflinks. Nat Protoc. 2012;7(3):562–78. doi: 10.1038/nprot.2012.016 ; PubMed Central PMCID: PMCPMC3334321. [DOI] [PMC free article] [PubMed] [Google Scholar]
- 30.Sharma-Kuinkel BK, Zhang Y, Yan Q, Ahn SH, Fowler VG Jr. Host gene expression profiling and in vivo cytokine studies to characterize the role of linezolid and vancomycin in methicillin-resistant Staphylococcus aureus (MRSA) murine sepsis model. PloS one. 2013;8(4):e60463 doi: 10.1371/journal.pone.0060463 ; PubMed Central PMCID: PMCPMC3614971. [DOI] [PMC free article] [PubMed] [Google Scholar]
- 31.Chang JT, Nevins JR. GATHER: a systems approach to interpreting genomic signatures. Bioinformatics. 2006;22(23):2926–33. doi: 10.1093/bioinformatics/btl483 . [DOI] [PubMed] [Google Scholar]
- 32.Oshlack A, Robinson MD, Young MD. From RNA-seq reads to differential expression results. Genome Biol. 2010;11(12):220 doi: 10.1186/gb-2010-11-12-220 ; PubMed Central PMCID: PMCPMC3046478. [DOI] [PMC free article] [PubMed] [Google Scholar]
- 33.Ozsolak F, Milos PM. RNA sequencing: advances, challenges and opportunities. Nat Rev Genet. 2011;12(2):87–98. doi: 10.1038/nrg2934 ; PubMed Central PMCID: PMCPMC3031867. [DOI] [PMC free article] [PubMed] [Google Scholar]
- 34.Humphrys MS, Creasy T, Sun Y, Shetty AC, Chibucos MC, Drabek EF, et al. Simultaneous transcriptional profiling of bacteria and their host cells. PloS one. 2013;8(12):e80597 doi: 10.1371/journal.pone.0080597 ; PubMed Central PMCID: PMCPMC3851178. [DOI] [PMC free article] [PubMed] [Google Scholar]
- 35.Mortazavi A, Williams BA, McCue K, Schaeffer L, Wold B. Mapping and quantifying mammalian transcriptomes by RNA-Seq. Nat Methods. 2008;5(7):621–8. doi: 10.1038/nmeth.1226 . [DOI] [PubMed] [Google Scholar]
- 36.Bruno VM, Wang Z, Marjani SL, Euskirchen GM, Martin J, Sherlock G, et al. Comprehensive annotation of the transcriptome of the human fungal pathogen Candida albicans using RNA-seq. Genome Res. 2010;20(10):1451–8. doi: 10.1101/gr.109553.110 ; PubMed Central PMCID: PMCPMC2945194. [DOI] [PMC free article] [PubMed] [Google Scholar]
- 37.Handfield M, Baker HV, Lamont RJ. Beyond good and evil in the oral cavity: insights into host-microbe relationships derived from transcriptional profiling of gingival cells. Journal of dental research. 2008;87(3):203–23. doi: 10.1177/154405910808700302 ; PubMed Central PMCID: PMCPMC2633067. [DOI] [PMC free article] [PubMed] [Google Scholar]
- 38.Eftang LL, Esbensen Y, Tannaes TM, Bukholm IR, Bukholm G. Interleukin-8 is the single most up-regulated gene in whole genome profiling of H. pylori exposed gastric epithelial cells. BMC Microbiol. 2012;12:9 doi: 10.1186/1471-2180-12-9 ; PubMed Central PMCID: PMCPMC3292955. [DOI] [PMC free article] [PubMed] [Google Scholar]
- 39.Naito Y, Ito M, Watanabe T, Suzuki H. Biomarkers in patients with gastric inflammation: a systematic review. Digestion. 2005;72(2–3):164–80. doi: 10.1159/000088396 . [DOI] [PubMed] [Google Scholar]
- 40.Sharma SA, Tummuru MK, Miller GG, Blaser MJ. Interleukin-8 response of gastric epithelial cell lines to Helicobacter pylori stimulation in vitro. Infection and immunity. 1995;63(5):1681–87. ; PubMed Central PMCID: PMCPMC173210. [DOI] [PMC free article] [PubMed] [Google Scholar]
- 41.Zhang H, Davies KJ, Forman HJ. Oxidative stress response and Nrf2 signaling in aging. Free radical biology & medicine. 2015;88(Pt B):314–36. doi: 10.1016/j.freeradbiomed.2015.05.036 ; PubMed Central PMCID: PMCPMC4628850. [DOI] [PMC free article] [PubMed] [Google Scholar]
- 42.Pechenino AS, Brown TR. Superoxide dismutase in the prostate lobes of aging Brown Norway rats. Prostate. 2006;66(5):522–35. doi: 10.1002/pros.20364 . [DOI] [PubMed] [Google Scholar]
- 43.Gomes P, Simao S, Silva E, Pinto V, Amaral JS, Afonso J, et al. Aging increases oxidative stress and renal expression of oxidant and antioxidant enzymes that are associated with an increased trend in systolic blood pressure. Oxid Med Cell Longev. 2009;2(3):138–45. ; PubMed Central PMCID: PMCPMC2763239. [DOI] [PMC free article] [PubMed] [Google Scholar]
- 44.He Y, Tombran-Tink J. Mitochondrial decay and impairment of antioxidant defenses in aging RPE cells. Adv Exp Med Biol. 2010;664:165–83. doi: 10.1007/978-1-4419-1399-9_20 . [DOI] [PubMed] [Google Scholar]
- 45.Swarbrick A, Roy E, Allen T, Bishop JM. Id1 cooperates with oncogenic Ras to induce metastatic mammary carcinoma by subversion of the cellular senescence response. Proceedings of the National Academy of Sciences of the United States of America. 2008;105(14):5402–7. doi: 10.1073/pnas.0801505105 ; PubMed Central PMCID: PMCPMC2291136. [DOI] [PMC free article] [PubMed] [Google Scholar]
- 46.Sikder HA, Devlin MK, Dunlap S, Ryu B, Alani RM. Id proteins in cell growth and tumorigenesis. Cancer Cell. 2003;3(6):525–30. . [DOI] [PubMed] [Google Scholar]
- 47.Subramaniam M, Harris SA, Oursler MJ, Rasmussen K, Riggs BL, Spelsberg TC. Identification of a novel TGF-beta-regulated gene encoding a putative zinc finger protein in human osteoblasts. Nucleic Acids Res. 1995;23(23):4907–12. ; PubMed Central PMCID: PMCPMC307482. [DOI] [PMC free article] [PubMed] [Google Scholar]
- 48.Subramaniam M, Gorny G, Johnsen SA, Monroe DG, Evans GL, Fraser DG, et al. TIEG1 null mouse-derived osteoblasts are defective in mineralization and in support of osteoclast differentiation in vitro. Mol Cell Biol. 2005;25(3):1191–9. doi: 10.1128/MCB.25.3.1191-1199.2005 ; PubMed Central PMCID: PMCPMC543998. [DOI] [PMC free article] [PubMed] [Google Scholar]
- 49.Cao Z, Wara AK, Icli B, Sun X, Packard RR, Esen F, et al. Kruppel-like factor KLF10 targets transforming growth factor-beta1 to regulate CD4(+)CD25(-) T cells and T regulatory cells. The Journal of biological chemistry. 2009;284(37):24914–24. doi: 10.1074/jbc.M109.000059 ; PubMed Central PMCID: PMCPMC2757194. [DOI] [PMC free article] [PubMed] [Google Scholar]
- 50.Liu B, Suyeoka G, Papa S, Franzoso G, Neufeld AH. Growth arrest and DNA damage protein 45b (Gadd45b) protects retinal ganglion cells from injuries. Neurobiol Dis. 2009;33(1):104–10. doi: 10.1016/j.nbd.2008.09.020 ; PubMed Central PMCID: PMCPMC2662500. [DOI] [PMC free article] [PubMed] [Google Scholar]
- 51.Guo W, Dong Z, Guo Y, Chen Z, Kuang G, Yang Z. Methylation-mediated repression of GADD45A and GADD45G expression in gastric cardia adenocarcinoma. Int J Cancer. 2013;133(9):2043–53. doi: 10.1002/ijc.28223 . [DOI] [PubMed] [Google Scholar]
- 52.Chen Z, Wan X, Hou Q, Shi S, Wang L, Chen P, et al. GADD45B mediates podocyte injury in zebrafish by activating the ROS-GADD45B-p38 pathway. Cell Death Dis. 2016;7:e2068 doi: 10.1038/cddis.2015.300 ; PubMed Central PMCID: PMCPMC4816163. [DOI] [PMC free article] [PubMed] [Google Scholar]
- 53.Zhan Y, Zhang R, Lv H, Song X, Xu X, Chai L, et al. Prioritization of candidate genes for periodontitis using multiple computational tools. Journal of periodontology. 2014;85(8):1059–69. doi: 10.1902/jop.2014.130523 . [DOI] [PubMed] [Google Scholar]
- 54.Liu Y, Zhou J, White KP. RNA-seq differential expression studies: more sequence or more replication? Bioinformatics. 2014;30(3):301–4. doi: 10.1093/bioinformatics/btt688 ; PubMed Central PMCID: PMCPMC3904521. [DOI] [PMC free article] [PubMed] [Google Scholar]
- 55.Hansen KD, Wu Z, Irizarry RA, Leek JT. Sequencing technology does not eliminate biological variability. Nat Biotechnol. 2011;29(7):572–3. doi: 10.1038/nbt.1910 ; PubMed Central PMCID: PMCPMC3137276. [DOI] [PMC free article] [PubMed] [Google Scholar]
- 56.Brawand D, Soumillon M, Necsulea A, Julien P, Csardi G, Harrigan P, et al. The evolution of gene expression levels in mammalian organs. Nature. 2011;478(7369):343–8. doi: 10.1038/nature10532 . [DOI] [PubMed] [Google Scholar]
- 57.Hah N, Danko CG, Core L, Waterfall JJ, Siepel A, Lis JT, et al. A rapid, extensive, and transient transcriptional response to estrogen signaling in breast cancer cells. Cell. 2011;145(4):622–34. doi: 10.1016/j.cell.2011.03.042 ; PubMed Central PMCID: PMCPMC3099127. [DOI] [PMC free article] [PubMed] [Google Scholar]
- 58.Davanian H, Stranneheim H, Bage T, Lagervall M, Jansson L, Lundeberg J, et al. Gene expression profiles in paired gingival biopsies from periodontitis-affected and healthy tissues revealed by massively parallel sequencing. PloS one. 2012;7(9):e46440 doi: 10.1371/journal.pone.0046440 ; PubMed Central PMCID: PMCPMC3460903. [DOI] [PMC free article] [PubMed] [Google Scholar]
- 59.Gonzalez OA, Novak MJ, Kirakodu S, Orraca L, Chen KC, Stromberg A, et al. Comparative analysis of gingival tissue antigen presentation pathways in ageing and periodontitis. Journal of clinical periodontology. 2014;41(4):327–39. doi: 10.1111/jcpe.12212 ; PubMed Central PMCID: PMCPMC3951170. [DOI] [PMC free article] [PubMed] [Google Scholar]
Associated Data
This section collects any data citations, data availability statements, or supplementary materials included in this article.
Supplementary Materials
S1 Fig. Heat maps of DEGs.
(A) Heat map of the twenty-four DEGs that were overlapping between the eighty-eight F. _nucleatum_-infected GF(P4) DEGs and the sixty-two F. _nucleatum_-infected GF(P4) versus GF(22) DEGs (B) Heat map of the ten DEGs that were overlapping between the forty F. _nucleatum_-infected GF(22) DEGs and the sixty-two F. _nucleatum_-infected GF(P4) versus GF(22) DEGs (C) Heat map of the four genes that were overlapping between eighty-eight F. _nucleatum_-infected GF(P4) DEGs and the forty F. _nucleatum_-infected GF(22) DEGs.
(TIF)
S2 Fig. Validation of the number of biological replicates used for DEG analysis by quantitative real-time PCR analysis.
The expression of selected genes from the RNA sequencing data was validated by real-time PCR analysis. The x-axis represents log2 (fold change) obtained by RNA sequencing and the y-axis indicates the–ΔΔCt values. The linear regression was performed using Pearson’s correlation (R) and the corresponding p value is based in the gene expression values by both methods. (A) Twenty-eight genes upregulated in GF(P4) cells in response to F. nucleatum infection (B) Fourteen up- or down-regulated genes in GF(P22) cells in response to F. nucleatum infection, and (C) the four genes found in common in GF(P4) and GF(P22) in response to F. nucleatum infection.
(TIF)
S3 Fig. Subcellular networks in the DEGs predicted by IPA.
(A) Subcellular network analysis of the genes from (A) young GF(P4)-specific response to F. nucleatum infection and (B) aged GF(P22)-specific response to F. nucleatum infection.
(TIF)
S1 Table. F. nucleatum genes upregulated in GF(P4) or GF(P22) cells.
The reads (FPKM) for F. nucleatum were compared between infected GF(P4) and GF(P22) cells.
(XLS)
S2 Table. DEGs identified between uninfected GF(P4) and F. _nucleatum_-infected GF(P4) cells.
(XLS)
S3 Table. DEGs identified between uninfected GF(P22) and F. _nucleatum_-infected GF(P22) cells.
(XLS)
S4 Table. DEGs identified between F. _n_-infected GF(P4) and F. _nucleatum_-infected GF(P22) cells.
(XLS)
S5 Table. Summary of the top five functional annotations of DEGs from each comparison.
All DEG datasets were analyzed using IPA software. The significance value associated with a function in Global Analysis is a measure of the likelihood that a gene from the dataset file under investigation participates in that function. The significance is expressed as a p-value, which is calculated using a right-tailed Fisher's Exact Test.
(XLS)
Data Availability Statement
All relevant data are within the paper and its Supporting Information files. All high-throughput sequencing data files are available from the GenBank Sequence Read Archive (SRA). Accession number: SRP108236.