The folding pathway of a protein at high resolution from microseconds to seconds (original) (raw)
Abstract
We have documented the folding pathway of the 10-kDa protein barstar from the first few microseconds at the resolution of individual residues from its well characterized denatured state. The denatured state had been shown from NMR to have flickering native-like structure in the first two of its four α-helices. Φ-value analysis shows that the first helix becomes substantially consolidated as the intermediate is formed in a few hundred microseconds, as does the second to a lesser extent. A native-like structure then is formed in a few hundred milliseconds as the whole structure consolidates. Peptide fragments corresponding to sequences containing the first two helices separately and together as a helix-loop-helix motif have little helical structure under conditions that favor folding. The early stages of folding fit the nucleation–condensation model that was proposed for the smaller chymotrypsin inhibitor 2, which is a single module of structure and folds by two-state kinetics. The early stages of the multistate folding of the larger, multimodular, barnase have proved experimentally inaccessible. The folding pathway of barstar links those of CI2 and barnase to give a unified scheme for folding.
Keywords: barstar, nucleation, temperature jump, NMR, protein engineering
There is strong current experimental and theoretical focus on the early stages of protein folding to understand how a conformationally disperse polypeptide chain can so rapidly rearrange to its native state (1, 2). Proteins fold either by two-state kinetics in which no stable intermediates accumulate on the pathway or by multistate kinetics through one or more detectable intermediates. Conventional rapid mixing techniques on the millisecond time range—for example, stopped flow—are adequate for monitoring the time course of folding for many of the two-state systems and for the later stages of multistate systems. But, faster methods are required to detect the intermediates that are formed in the first stages of the more complex pathways (3–6). The temperature-jump (T-jump) procedure (7) has been applied to a cold-denatured protein, rapidly inducing it to fold by raising its temperature through the thermal unfolding transition in 500 ns or greater by Joule heating (8) or about 15 ns by laser radiation (9). Analysis of the derived fast kinetic data in terms of structure can be performed by inserting spectral probes into the protein, which can identify the formation of gross elements of structure in intermediates (9). But, the only procedure for following the fate of individual residues in the transition states for the formation of structure is by Φ-value analysis (10–12), in which individual mutations act as indirect reporter groups during kinetics. Further, this procedure is probably the only means of giving a residue-by-residue structural analysis of the rapidly formed intermediates. Φ values also fit in nicely with modern theoretical methods for folding, because they can be correlated with the acquisition of the number of native-like contacts and the precision of molecular dynamics for unfolding (13–16). Here, we report the resolution of a multistate folding pathway of a protein (barstar) from a well characterized denatured state at the level of individual residues on a microsecond time scale. Barstar has properties intermediate between those of the small chymotrypsin inhibitor 2 (CI2) and the larger barnase. While the intermediate of barnase is distinctly stable, by 3 kcal·mol−1 (1 kcal = 4.18 kJ) relative to the fully unfolded state, barstar displays a folding behavior closer to that of a two-state mechanism with an intermediate of only marginal stability, about 0.6 kcal·mol−1, representing only a shallow valley in the energy landscape of folding. We find in this study that the folding pathway of barstar links the simple two-state kinetics and nucleation mechanism of folding of CI2 with the pronounced stepwise formation of structure of native barnase.
EXPERIMENTAL
Expression and Purification.
The “pseudo-wild type” barstar used in this study is C40A/C82A/P27A barstar (8) containing no cysteines and only one proline residue (Pro-48). Mass spectrometry and N-terminal sequencing showed that the N-terminal methionine was not cleaved in these highly expressed barstar mutants, including pseudo-wild type. Site-directed mutagenesis was performed as described (8) or by PCR (17). Screening of mutant plasmids (pML2bs), expressed in Escherichia coli BL21(DE3)(pLysE), was simplified by introducing a silent mutation for a restriction site. Expression was simplified by transferring directly freshly transformed colonies into a 2-liter flask with 800 ml of 2 TY medium with 200 μM ampicillin and incubating at 30°C for 30 h with addition of 4 mM isopropyl β-d-thiogalactoside after 10 and 20 h each. Intense, pulsed ultrasonication of the ice-cold cell suspension was used for cell lysis, resulting in >95% purity of barstar mutants in the crude cell extract before chromatography. Electrospray mass spectrometry confirmed the size of the mutants within ± 1 Da. The expression level was typically 100 mg/liter, and the protein was concentrated to 1–2 mM in water without any precipitation occurring.
Equilibrium Studies.
Free energies of unfolding for pseudo-wild type and mutants in 0 M urea, Δ_G_U-F, were determined as described (8) by CD signal at 222 nm in 50 mM Tris·HCl buffer, pH 8/100 mM KCl, at 10°C as function of urea concentration using a Jasco (Easton, MD) model J-720 spectrometer with a spectral resolution of 2 nm. The protein concentration was 10–20 μM, and the path length was 0.1 cm. Barstar concentrations were determined using an extinction coefficient at 280 nm of 22,690 M−1·cm−1 (18).
Kinetic Measurements.
To avoid artifacts, low protein concentrations and only small-amplitude T-jumps were used, with a fluorimeter from DIA-LOG (Düsseldorf, Germany), equipped with a 200-W mercury–xenon lamp and a 50-nF capacitor and supplemented with a Nicolet (Madison, WI) model Pro 90 storage oscilloscope. The fluorescence signals at ± 90° angles were detected with two photomultipliers, summed and filtered with a 1- or 5-μs response time for the fast phase and 1-ms response time for the slow transition. To obtain a high dynamic range, 2000 data points at 12-bit resolution were recorded for each trace. Fluorescence excitation was at 280 nm, and a cut-off filter at 295 nm was used for emission. Folding proceeds under isothermal conditions, because after T-jump, the temperature of the interior of the protein molecule equilibrates with the bulk solvent in the nanosecond time scale (19–21). The conditions were typically 2–10 μM protein, 100 mM KCl, 50 mM Tris·Cl buffer at pH 8 and urea concentration as stated. T-jumps were from 2°C to 10°C. At 2°C, about 1% of the pseudo-wild-type barstar molecules are in the denatured state. Changing the concentration of pseudo-wild type from 5 to 30 μM at 0 M urea does not change the rate constants and relative amplitudes of the fast folding transition by more than 5%, but deviations could be seen at very high concentrations. Rapid mixing experiments were performed at 10°C using a BioSequential DX-17MV stopped-flow apparatus from Applied Photophysics (Leatherhead, U.K.). Fluorescence excitation was at 280 nm, and for emission a cut-off filter at 320 nm was used. The conditions were 2 μM final protein concentration, 100 mM KCl, 50 mM Tris·HCl buffer at pH 8, and urea as stated.
Stopped-Flow CD Studies.
Kinetic stopped-flow experiments used a BioSequential DX-17MV stopped-flow spectrometer adjusted with a CD.1 accessory with a dead time of 7 ms. Measurements were performed at 15°C in 10 mM sodium phosphate buffer at pH 8.0 at about 24 μM final protein concentration. Refolding was initiated by 11-fold dilution of urea solutions. Changes in CD were recorded at 222 nm. Just a single slow phase of rate constant of 10 s−1, or less, depending on urea concentration, was observed. Its amplitude was obtained as a function of urea concentration by fitting the refolding curves to a single exponential function. A small correction (<7%) was made for the amplitude lost in the dead time. The denaturant dependence of the amplitude reflects the stability curves of the secondary structure of the intermediate and native-like folded state with trans conformation of the peptidyl-prolyl (48) bond, respectively. The baseline for the unfolded state barstar was measured in urea solution with 25 mM KOH (C. M. Johnson and A.R.F., unpublished data) and subtracted from the amplitudes from the kinetic experiments.
NMR and CD Studies on Peptide Fragments.
Peptides of barstar comprising residues 11–29, 28–44, 33–44, and 14–43 were synthesized with a Synergy Personal peptide synthesizer, using fluorenylmethoxycarbonyl protection. All were purified by reverse HPLC. CD experiments were recorded at 5°C (pH 6.3 Mes buffer) on a Jasco J-720 spectropolarimeter. Trifluroethanol titration experiments were performed under the same conditions. Peptide concentrations were in all cases 18 μM. NMR experiments were acquired using standard pulse sequences (22) with an AMX-500 Bruker spectrometer (pH 5.3, acetate buffer, 5°C). Concentrations were in the range 1–1.5 mM.
RESULTS AND DISCUSSION
Structure of Barstar.
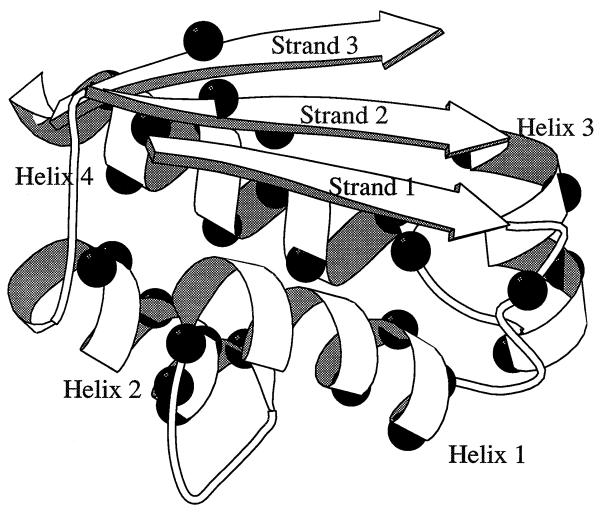
Barstar is an 89-residue protein that has evolved to be the specific intracellular inhibitor of the ribonuclease barnase that is secreted from Bacillus amyloliquefaciens (23, 24). Barstar (Fig. 1) has four α-helices: helix1 from Ser-14 to Ala-25, helix2 from Asn-33 to Gly-43, helix3 from Gln-55 to Thr-63, and helix4 from Glu-68 to Gly-81. There are three strands of parallel β-sheet: Lys-1 to Asn-6, Leu-49 to Arg-54, and Asp-3 to Ser-89. Residues 26–44 comprise a loop as well as the second helix of barstar, which together form the binding site for barnase (18). An inter-residue contact map displays significantly more side-chain contacts in barstar relative to the smaller CI2. The divisions between possible subdomains, such as residues 1–50 and 51–89, are very weak, and barstar is on the borderline of being a single- or two-module protein.
Figure 1.
Structure of barstar, indicating the residues mutated in this study [drawn with the program molscript (25)].
The cold-denatured state of barstar has been extensively analyzed by NMR (26). Three regions have residual structure, which is in the α-helical region of (φ, ψ) space. Two of these are native-like, because they are also helical in the native protein: Ser-12 to Lys-21 of helix1 and Tyr-29 to Glu-46 (which includes helix2). The third, Leu-51 to Phe-56, is part of the β-sheet plus the loop connecting it to the third helix and so is nonnative. The C-terminal region, Asn-65 to Ser-89, is indistinguishable from random coil.
There is a _cis_-peptidyl-proline bond to Pro-48, which complicates the folding pathway, because the major conformation present in the denatured state, D, is the trans. The major pathway for the folding of barstar is the sequence:
 |
1 |
|---|
where Itrans is the early intermediate and Ntrans is a native-like state that binds barnase and has similar fluorescence properties to the true native state, Ncis. The sequence Itrans → Ntrans → Ncis has been detected by stopped-flow studies (27, 28). D → Itrans was found from T-jump studies to proceed at about 2000–3000 s−1 and that Itrans was found to be a collapsed state with solvent-exposed side chains of high mobility (3).
Gross Features of Fast Transition.
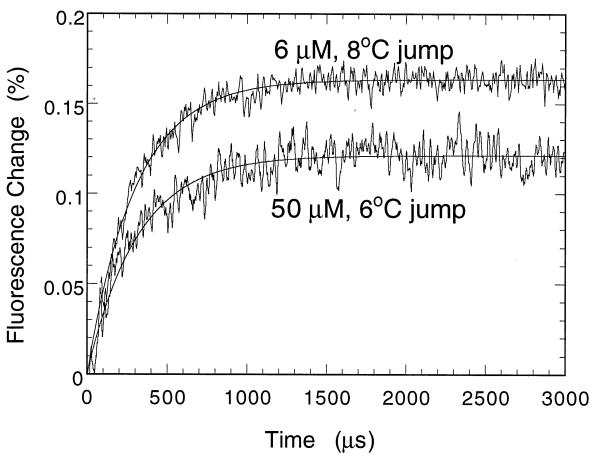
The folding intermediate Itrans is formed with a rate constant _k_1 = 2300 s−1 and _k_−1 = 800 s−1 (Fig. 2), so that Δ_G_I(trans)−D = -0.6 kcal mol−1. The Itrans proceeds to Ntrans with _k_2 = 11 s−1. _k_−2 is ≈2 s−1, so that Δ_G_N(trans)−I(trans) = −1 kcal mol−1. The overall free energy of folding is −3.0 kcal·mol−1, so that Δ_G_N(cis)−N(trans) is −1.4 kcal·mol−1. The conversion of Ntrans to Ncis has a half-life of several minutes. The folding was monitored from the combined changes in fluorescence of tryptophans 38, 44, and 53.
Figure 2.
T-jump traces for the folding of pseudo-wild-type (P27A/C40A/C82A) barstar in 0 M urea/0.1 M KCl/50 mM Tris·HCl at pH 8 and 10°C under different instrument settings and concentrations. Thirty-six traces were accumulated, each with 500-ns step width, corresponding to 6000 points per trace and a time constant of 1 μs for the measurement with 50 μM protein. Noise was reduced by digital smoothing using a moving window of 30 data points. For the measurement with 6 μM protein, 42 traces were accumulated with a time constant of 5 μs. A 5 times higher light intensity relative to the measurement with 50 μM protein was used. The rate constant did not deviate by more than 5% of 3100 s−1 (= _k_1 + _k_−1) over the concentration range 6 to 50 μM protein and a wide range of instrument settings and heating times. There is no evidence for a lag phase preceding the formation of Itrans.
The change in surface exposure of each state during folding can be estimated from the sensitivity of each of the rate constants to the effect of urea concentration compared with that of the overall equilibrium constant for folding, _K_N-D. For the overall reaction, ∂log_K_N-D/∂[urea] = −0.9. The individual rate constants are found to change with urea concentration according to: ∂log_k_1/∂[urea] = −0.2; ∂log_k_−1/∂[urea] = 0.3; ∂log_k_2/∂[urea] = −0.3; and ∂log_k_−2/∂[urea] = 0.1 (all in units of M−1). Thus, the first transition state is approximately 20% compacted in surface area; Itrans, 50%, and the second transition state 90%.
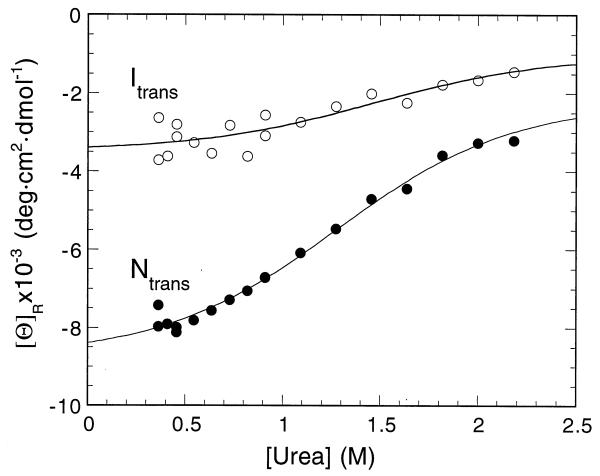
We have estimated the amount of α-helical secondary structure formed in Itrans from a stopped-flow measurement of the CD signal at 222 nm, which is characteristic of the formation of the helix (Fig. 3). Barstar has a very large change of signal at 222 nm upon folding of 8.4 × 10³ deg·cm2·dmol−1, which is far above intrusive contributions from aromatic residues. Forty percent of the signal (3.4 × 10³ deg cm2 dmol−1) is formed in the dead time of a stopped-flow measurement, showing considerable formation of helix in Itrans. Agashe et al. (29) have reported that there is only very little formation of helical structure in Itrans and that the initial stages of barstar folding proceed by a hydrophobic collapse. But, their experiments were performed only above 1 M GdmCl, and our data (Fig. 2) show that at 2 M urea, which is equivalent to 1 M GdmCl, the helical signal is nearly suppressed, so there is no inconsistency between the two sets of experiments.
Figure 3.
Amplitude of the CD signal at 222 nm on the folding of barstar at 15°C in a stopped-flow spectrometer. The burst of signal in the dead time relative to the baseline corresponds to the ellipticity of Itrans. The total amplitude of the signal on folding corresponds to that of Ntrans.
Itrans is thus a fairly compact state with about 50% of its surface area buried, relative to the denatured and native states, and with nearly half the amount of α-helical content of the native structure. The formation of Itrans is cooperative, because its rate constant is affected by many mutations all over the molecule.
Φ-Value Analysis.
The degree of formation of structure at individual positions in a particular state, I, on the folding pathway can be estimated from the changes of its free energy on mutation (ΔΔ_G_I-D) relative to the change in the overall free energy of folding (ΔΔ_G_N-D) (11, 12). When the quantity ΦF(I), = ΔΔ_G_I-D/ΔΔ_G_N-D, is = 1, then the state I is destabilized by mutation by the same amount of energy as is the fully native state, N. When ΦF(I) = 0, I is as unaffected by mutation as is the denatured state D. Intermediate values of Φ indicate either partial formation of structure or a mixture of states of different degrees of formation of structure.
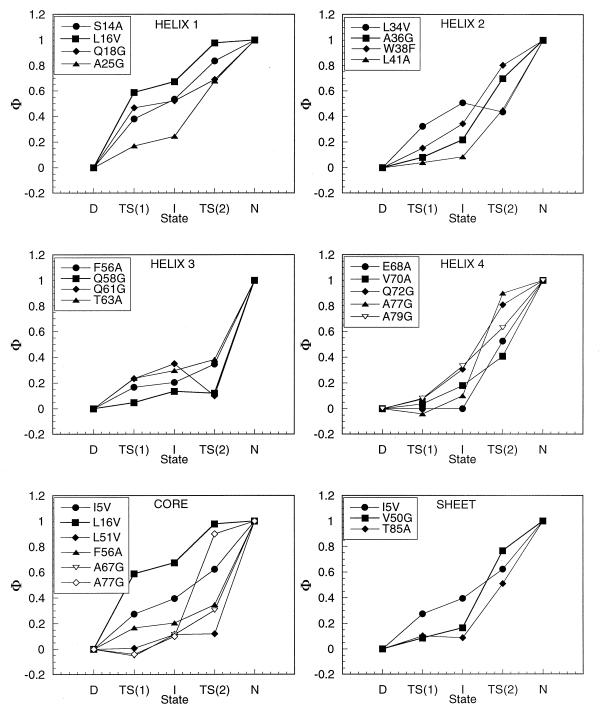
The Φ values for the transition state for the formation of Itrans [TS(1)] and for the equilibrium constant for its formation are in Fig. 4 as well as those for the transition state TS(2) for formation of Ntrans. Helix1 has significant values of Φ for TS(1), which slightly increase in I and show that it is nearly completely formed in TS(2). Mutation of residues in helix2 indicates that it is less well formed in all three states, but these mutations are more radical than those in helix1, because of the large hydrophobic groups involved, so there are also contributions from changes in their interactions with the hydrophobic core. In particular, Leu-34, which shows a high Φ in I, has strong interactions with helix4. Helix3 is only very weakly formed in TS(1), I, and TS(2). Helix4 is not formed in TS(1), is slightly consolidated in I, but is formed during TS(2). Hydrophobic residues in the core make varying degrees of their interactions; only part of the core is formed in TS(1) and I. L16V with a high Φ in I probes mainly interactions in helix1 and between helix1 and helix4. There are only three probes in the strands constituting the sheet, but these tend to show that it is formed primarily in TS(2).
Figure 4.
Φ-value analysis. The Φ values for the transition state for the formation of Itrans [TS(1)] are calculated from _k_1 and those for the equilibrium constant for the formation Itrans are calculated from _k_1/_k_−1 with a precision of better than ± 0.1. The Φ values for the transition state for the formation of Ntrans are calculated from the measured values of _k_−2 [from a folding–unfolding double-jump experiment (26)] and are accurate to ±0.15.
These values will be refined by a further round of mutations to perform a fine structure analysis as done for barnase (30) and CI2 (31). But, it is clear at this stage of refinement that TS(1) is structured around helix1 being considerably formed and helix4 being in the process of consolidation in I.
Structure of Peptides.
We have synthesized the following peptides that correspond to sequences in barstar: 11–29, which contains the sequence of helix1; 33–44, which contains the sequence of helix2; 28–44, which comprises the connecting loop and helix2; and 14–43, which contains the entire helix-loop-helix motif. Although 40% trifluoroethanol induces helical structure in all peptides, their two-dimensional 1H NMR spectra in H2O at pH 5.3 and 5°C resemble those expected for a random coil, apart from some specific interactions involving tryptophan residues (the 14–43 peptide could not be studied in aqueous solutions because of signal broadness). CD spectra in H2O are also close to random coil with less than 5–10% of the signal at 222 nm expected for a helical structure, and less than 5% helical structure calculated from a titration procedure (32) (data not shown). Thus, helix1 and helix2 do not form significant amounts of helical structure under folding conditions in the absence of the rest of the protein. The formation of the helical structure in helix1 in the folding intermediate I must, accordingly, be coupled with the formation of long-range interactions that stabilize the helix.
Mechanism of Folding.
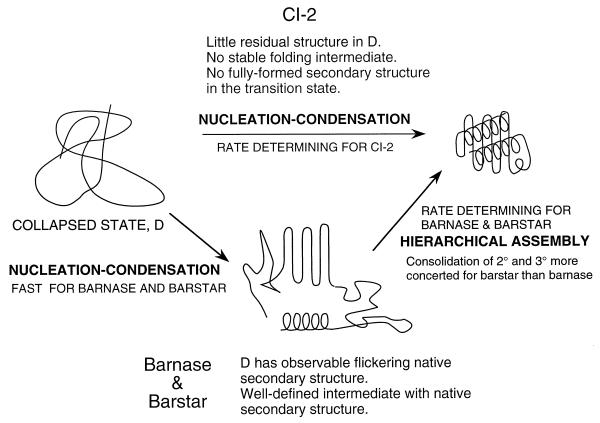
The 64-residue (truncated form) protein CI2 consists of a single module of structure, has one α-helix, and folds by simple two-state kinetics (33, 34). Φ-value analysis of folding showed that there was concurrent formation of secondary and tertiary structure (35), with the single α-helix being the only well developed element of local secondary structure. This helix is hardly formed in peptide fragments of CI2 or in its denatured state (ref. 36; Y. J. Tan and A.R.F. unpublished results). A mechanism was proposed for folding, initially called global collapse (35) and renamed nucleation–condensation (31). The classical nucleation-growth mechanism invokes the initial formation of a well defined nucleus followed by growth of structure from it (37, 38). The nucleation-condensation mechanism, on the other hand, has a diffuse nucleus that consists of some neighboring residues whose conformations are stabilized by long-range interactions with residues that are remote in sequence. An essential component of the mechanism is that the nucleus and its stabilizing interactions elsewhere in the protein develop concurrently. The α-helix is unstable in the absence of long-range interactions, and the rest of the structure is unstable without the interactions with the helix. There is cooperative formation of the nucleus and the surrounding structure. The 110-residue barnase has a clear modular structure (39) and folds via multistate kinetics and a distinct folding intermediate. Φ-value analysis of the later stages of folding suggested a framework mechanism in which a preformed secondary structure of α-helix docked on that of β-sheet (30). A general scheme was proposed in which modules of structures in larger proteins, such as barnase, were formed initially by nucleation–condensation (31, 40). These then would dock, either in a purely stepwise manner or by the processes of docking and nucleation–condensation being coupled, depending on the stability of the modules (31). The more stable the individual modules, the greater the stepwise tendency of the reaction. But, it was not possible to measure the rate of formation of the folding intermediate of barnase, so there was no direct evidence for the initial nucleation–condensation.
Application of T-jump methods to the fast folding of barstar allows us to test the mechanism directly. The results on barstar are directly consistent with the general nucleation-condensation scheme (Fig. 5). A peptide corresponding to part of a nucleus (residues 14–43) is mainly random under folding conditions. This region in the denatured protein has flickering native-like structure, showing that it is stabilized by long-range interactions, even in the denatured state. A nucleus centered on helix1 is substantially, but not completely, formed in the transition state for the formation of the folding intermediate on the microsecond timescale [TS(1)]. Many of the rest of the residues in the protein make weak interactions in the early formed intermediate, which are then more highly consolidated in the later transition state [TS(2)]. There is thus the progression from the formation of secondary and tertiary structure being formed in parallel in the folding of CI2, to the formation of secondary and tertiary being loosely coupled in the folding of barstar, and formation being more stepwise for barnase where secondary structure is clearly formed in its folding intermediate.
Figure 5.
General nucleation–condensation model.
Acknowledgments
B.N. is supported by a European Union Human Capital and Mobility Fellowship and a Medical Research Council Fellowship.
Footnotes
Abbreviations: CI2, chymotrypsin inhibitor 2; TS, transition state; T-jump, temperature jump.
References
- 1.Wolynes P G, Lutheyschulten Z, Onuchic J N. Chem Biol. 1996;3:425–432. doi: 10.1016/s1074-5521(96)90090-3. [DOI] [PubMed] [Google Scholar]
- 2.Eaton W A, Thompson P A, Chan C K, Hagen S J, Hofrichter J. Structure (London) 1996;4:1133–1139. doi: 10.1016/s0969-2126(96)00121-9. [DOI] [PubMed] [Google Scholar]
- 3.Jones C M, Henry E R, Hu Y, Chan C-K, Luck S D, Bhuyan A, Roder H, Hofrichter J, Eaton W A. Proc Natl Acad Sci USA. 1993;90:11860–11864. doi: 10.1073/pnas.90.24.11860. [DOI] [PMC free article] [PubMed] [Google Scholar]
- 4.Pascher T, Chesick J P, Winkler J R, Gray H B. Science. 1996;271:1558–1560. doi: 10.1126/science.271.5255.1558. [DOI] [PubMed] [Google Scholar]
- 5.Hagen S J, Hofrichter J, Szabo A, Eaton W A. Proc Natl Acad Sci USA. 1996;93:11615–11617. doi: 10.1073/pnas.93.21.11615. [DOI] [PMC free article] [PubMed] [Google Scholar]
- 6.Chan C K, Hofrichter J, Eaton W A. Science. 1996;274:628–629. doi: 10.1126/science.274.5287.628. [DOI] [PubMed] [Google Scholar]
- 7.Eigen M, de Maeyer L. In: Techniques of Organic Chemistry. Friess S L, Lewis E S, Weissberger A, editors. Vol. 8. New York: Wiley Interscience; 1963. Part 28951954. [Google Scholar]
- 8.Nölting B, Golbik R, Fersht A R. Proc Natl Acad Sci USA. 1995;92:10668–10672. doi: 10.1073/pnas.92.23.10668. [DOI] [PMC free article] [PubMed] [Google Scholar]
- 9.Ballew R M, Sabelko J, Gruebele M. Proc Natl Acad Sci USA. 1996;93:5759–5764. doi: 10.1073/pnas.93.12.5759. [DOI] [PMC free article] [PubMed] [Google Scholar]
- 10.Matouschek A, Kellis J T, Jr, Serrano L, Fersht A R. Nature (London) 1989;340:122–126. doi: 10.1038/340122a0. [DOI] [PubMed] [Google Scholar]
- 11.Fersht A R, Matouschek A, Serrano L. J Mol Biol. 1992;224:771–782. doi: 10.1016/0022-2836(92)90561-w. [DOI] [PubMed] [Google Scholar]
- 12.Fersht A R. Curr Opin Struct Biol. 1995;5:79–84. doi: 10.1016/0959-440x(95)80012-p. [DOI] [PubMed] [Google Scholar]
- 13.Caflisch A, Karplus M. Proc Natl Acad Sci USA. 1994;91:1746–1750. doi: 10.1073/pnas.91.5.1746. [DOI] [PMC free article] [PubMed] [Google Scholar]
- 14.Caflisch A, Karplus M. J Mol Biol. 1995;252:672–708. doi: 10.1006/jmbi.1995.0528. [DOI] [PubMed] [Google Scholar]
- 15.Li A J, Daggett V. Proc Natl Acad Sci USA. 1994;91:10430–10434. doi: 10.1073/pnas.91.22.10430. [DOI] [PMC free article] [PubMed] [Google Scholar]
- 16.Daggett V, Li A J, Itzhaki L S, Otzen D E, Fersht A R. J Mol Biol. 1996;257:430–440. doi: 10.1006/jmbi.1996.0173. [DOI] [PubMed] [Google Scholar]
- 17.Ausubel F M, Brent R, Kingston R E, Moore D D, Seidman J G, Smith J A, Struhl K, editors. Short Protocols in Molecular Biology. New York: Wiley; 1992. pp. 8.23–8.25. [Google Scholar]
- 18.Lubienski M J, Bycroft M, Freund S M V, Fersht A R. Biochemistry. 1994;33:8866–8877. [PubMed] [Google Scholar]
- 19.Nölting B, Jiang M, Sligar S G. J Am Chem Soc. 1993;115:9879–9882. [Google Scholar]
- 20.Nölting B, Sligar S G. Biochemistry. 1993;32:12319–12323. doi: 10.1021/bi00097a007. [DOI] [PubMed] [Google Scholar]
- 21.Nölting B. J Theor Biol. 1995;175:191–196. doi: 10.1006/jtbi.1995.0131. [DOI] [PubMed] [Google Scholar]
- 22.Wüthrich K. NMR of Proteins and Nucleic Acids. New York: Wiley; 1986. [Google Scholar]
- 23.Hartley R W. J Mol Biol. 1988;202:913–915. doi: 10.1016/0022-2836(88)90568-2. [DOI] [PubMed] [Google Scholar]
- 24.Schreiber G, Fersht A R. Biochemistry. 1993;32:5145–5150. doi: 10.1021/bi00070a025. [DOI] [PubMed] [Google Scholar]
- 25.Kraulis P. J Appl Crystallogr. 1991;24:946–950. [Google Scholar]
- 26.Wong K B, Freund S M V, Fersht A R. J Mol Biol. 1996;259:805–818. doi: 10.1006/jmbi.1996.0359. [DOI] [PubMed] [Google Scholar]
- 27.Schreiber G, Fersht A R. Biochemistry. 1993;32:11195–11203. doi: 10.1021/bi00092a032. [DOI] [PubMed] [Google Scholar]
- 28.Agashe V R, Udgaonkar J B. Biochemistry. 1995;34:3286–3299. doi: 10.1021/bi00010a019. [DOI] [PubMed] [Google Scholar]
- 29.Agashe V R, Shastry M C R, Udgaonkar J B. Nature (London) 1995;377:754–757. doi: 10.1038/377754a0. [DOI] [PubMed] [Google Scholar]
- 30.Serrano L, Matouschek A, Fersht A R. J Mol Biol. 1992;224:847–859. doi: 10.1016/0022-2836(92)90566-3. [DOI] [PubMed] [Google Scholar]
- 31.Itzhaki L S, Otzen D E, Fersht A R. J Mol Biol. 1995;254:260–288. doi: 10.1006/jmbi.1995.0616. [DOI] [PubMed] [Google Scholar]
- 32.Jasanoff A, Fersht A R. Biochemistry. 1994;33:2129–2135. doi: 10.1021/bi00174a020. [DOI] [PubMed] [Google Scholar]
- 33.Jackson S E, Fersht A R. Biochemistry. 1991;30:10428–10435. doi: 10.1021/bi00107a010. [DOI] [PubMed] [Google Scholar]
- 34.Jackson S E, Fersht A R. Biochemistry. 1991;30:10436–10443. doi: 10.1021/bi00107a011. [DOI] [PubMed] [Google Scholar]
- 35.Otzen D E, Itzhaki L S, Elmasry N F, Jackson S E, Fersht A R. Proc Natl Acad Sci USA. 1994;91:10422–10425. doi: 10.1073/pnas.91.22.10422. [DOI] [PMC free article] [PubMed] [Google Scholar]
- 36.Itzhaki L S, Neira J L, Ruiz-Sanz J, Prat Gay G de, Fersht A R. J Mol Biol. 1995;254:289–304. doi: 10.1006/jmbi.1995.0617. [DOI] [PubMed] [Google Scholar]
- 37.Wetlaufer D B. Proc Natl Acad Sci USA. 1973;70:697–701. doi: 10.1073/pnas.70.3.697. [DOI] [PMC free article] [PubMed] [Google Scholar]
- 38.Wetlaufer D B. Trends Biochem Sci. 1990;15:414–415. doi: 10.1016/0968-0004(90)90275-g. [DOI] [PubMed] [Google Scholar]
- 39.Yanagawa H, Yoshida K, Torigoe C, Park J S, Sato K, Shirai T, Go M. J Biol Chem. 1993;268:5861–5865. [PubMed] [Google Scholar]
- 40.Abkevich V I, Gutin A M, Shakhnovich E I. Biochemistry. 1994;33:10026–10036. doi: 10.1021/bi00199a029. [DOI] [PubMed] [Google Scholar]
