Ponsin/SH3P12: an l-afadin- and vinculin-binding protein localized at cell-cell and cell-matrix adherens junctions - PubMed (original) (raw)
Ponsin/SH3P12: an l-afadin- and vinculin-binding protein localized at cell-cell and cell-matrix adherens junctions
K Mandai et al. J Cell Biol. 1999.
Abstract
We recently isolated a novel actin filament (F-actin)-binding protein, afadin, that has two isoforms, l- and s-afadins. l-Afadin is ubiquitously expressed and specifically localized at zonula adherens (ZA) in epithelial cells and at cell-cell adherens junction (AJ) in nonepithelial cells, whereas s-afadin is abundantly expressed in neural tissue. l-Afadin has one PDZ domain, three proline-rich regions, and one F-actin-binding domain, whereas s-afadin lacks the third proline-rich region and the F-actin-binding domain. To understand the molecular mechanism of the specific localization of l-afadin at ZA in epithelial cells and at cell-cell AJ in nonepithelial cells, we attempted here to identify an l-afadin-binding protein(s) and isolated a protein, named ponsin. Ponsin had many splicing variants and the primary structures of two of them were determined. Both the two variants had three Src homology 3 (SH3) domains and turned out to be splicing variants of SH3P12. The third proline-rich region of l-afadin bound to the region of ponsin containing the second and third SH3 domains. Ponsin was ubiquitously expressed and localized at ZA in epithelial cells, at cell-cell AJ in nonepithelial cells, and at cell-matrix AJ in both types of cells. Ponsin furthermore directly bound vinculin, an F-actin-binding protein localized at ZA in epithelial cells, at cell-cell AJ in nonepithelial cells, and at cell-matrix AJ in both types of cells. Vinculin has one proline-rich region where two proline-rich sequences are located. The proline-rich region bound to the region of ponsin containing the first and second SH3 domains. l-Afadin and vinculin bound to ponsin in a competitive manner and these three proteins hardly formed a ternary complex. These results indicate that ponsin is an l-afadin- and vinculin-binding protein localized at ZA in epithelial cells, at cell-cell AJ in nonepithelial cells, and at cell-matrix AJ in both types of cells.
Figures
Figure 1
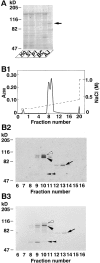
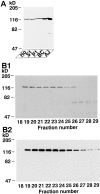
35S-Labeled l-afadin–binding proteins. (A) Subcellular distribution of 35S-labeled l-afadin–binding proteins in rat liver. An aliquot (30 μg protein) of each subcellular fraction was subjected to SDS-PAGE (8% polyacrylamide gel), followed by 35S-labeled l-afadin blot overlay. (Arrow) p93, (Ho) homogenate, (S1) soluble fraction, (P1) pellet fraction, (BC) fraction rich in bile canaliculi, and (AJ) fraction rich in AJ. (B) 35S-Labeled l-afadin–binding proteins in Mono S column chromatography. (B1) Absorbance at 280 nm (A280). (B2) 35S-Labeled l-afadin blot overlay. An aliquot (0.75 μl) of each fraction was subjected to SDS-PAGE (8% polyacrylamide gel), followed by 35S-labeled l-afadin blot overlay. (B3) Protein staining with Coomassie brilliant blue. An aliquot (2 μl) of each fraction was subjected to SDS-PAGE (8% polyacrylamide gel), followed by protein staining with Coomassie brilliant blue. (Open arrowhead) p95, (closed arrowhead) p93, (arrow) p70, and (double arrowhead) p55. The results are representative of three independent experiments.
Figure 2
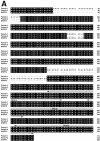
Molecular characterization of ponsin-1 and -2. (A) Deduced amino acid sequences of ponsin-1, -2, and SH3P12. Identity is highlighted. Signaling domain organization was determined with the Web-based tool, SMART (simple modular architecture research tool) program (Schultz et al., 1998). (B) l-Afadin–binding activity of ponsin-1 and -2. Myc– ponsin-1 (the full length) or -2 (the full length) was expressed in COS7 cells by transfection with pCMV-Myc– ponsin-1 or -2, respectively. The Myc-tagged protein was immunoprecipitated with the anti–Myc antibody, and then subjected to SDS-PAGE (8% polyacrylamide gel), followed by 35S-labeled l-afadin blot overlay or protein staining with Coomassie brilliant blue. An aliquot (2 μl) of fraction 10 in the Mono S column chromatography was also subjected to SDS-PAGE, followed by 35S-labeled l-afadin blot overlay or by protein staining. (B1) 35S-Labeled l-afadin blot overlay, and (B2) protein staining. The results are representative of three independent experiments.
Figure 3
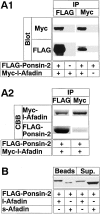
Binding of l-afadin to ponsin in vivo. (A) Immunoprecipitation analysis of l-afadin and ponsin-2. FLAG–ponsin-2 (the full length) and Myc–l-afadin (the full length) were coexpressed in COS7 cells in various combinations by transfection with pFLAG-CMV2–ponsin-2 and pCMV-Myc–l-afadin, respectively. Each cell extract was subjected to immunoprecipitation with the anti–FLAG or anti–Myc antibody. The precipitate was then subjected to SDS-PAGE (8% polyacrylamide gel), followed by Western blot analysis using the anti–FLAG or anti–Myc antibody, or by protein staining with Coomassie brilliant blue. (A1) Western blot analysis, and (A2) protein staining. (IP) Immunoprecipitation, and (CBB) staining with Coomassie brilliant blue. (B) Immunoprecipitation analysis of s-afadin and ponsin-2. Both FLAG–ponsin-2 and tag-free l-afadin (the full length) or both FLAG–ponsin-2 and tag-free s-afadin (the full length) were coexpressed in COS7 cells by transfection with both pFLAG-CMV2– ponsin-2 and pCMV5–l-afadin or both pFLAG-CMV2–ponsin-2 and pCMV5–s-afadin, respectively. Each cell extract was incubated with the anti–FLAG antibody and protein G–Sepharose beads, followed by centrifugation. The beads and the supernatant were separately subjected to SDS-PAGE (8% polyacrylamide gel), followed by Western blot analysis using the anti–l- and s-afadin antibody. (Sup) supernatant. The results are representative of three independent experiments.
Figure 4
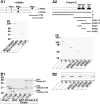
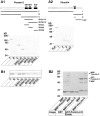
Binding regions of l-afadin and ponsin. (A) Blot overlay. (A1) 35S-Labeled ponsin-2 blot overlay. Myc–l-Afadin (the full length), Myc–s-afadin (the full length), His6–l-afadin-C199 (the COOH-terminal 199 aa region including the third proline-rich region), and His6– l-afadin-C132 (the COOH-terminal 132 aa region lacking the aa residues [PPLP] of the third proline-rich domain) (5 pmol each) were subjected to SDS-PAGE (8 and 12% discontinuous polyacrylamide gel), followed by 35S-labeled ponsin-2 blot overlay. (A2) 35S-Labeled l-afadin blot overlay. Various GST-fused proteins of ponsin-2 (5 pmol each) were subjected to SDS-PAGE (8% polyacrylamide gel), followed by 35S-labeled l-afadin blot overlay. (B) Affinity chromatography. (B1) Binding region of l-afadin. His6–l-Afadin-C199 or His6–l-afadin-C132 was incubated with GST–ponsin-2-C (the COOH-terminal half) or GST alone immobilized on glutathione-Sepharose beads. Each original sample and eluate were subjected to SDS-PAGE (15% polyacrylamide gel), followed by protein staining with Coomassie brilliant blue. (B2) Binding region of ponsin. His6– l-afadin-C199 was incubated with various GST-fused proteins of ponsin-2 immobilized on glutathione-Sepharose beads. Each eluate was subjected to SDS-PAGE (12% polyacrylamide gel), followed by Western blot analysis using the anti–l-afadin antibody. [PR(1)] the first proline-rich region (aa 1219–1229), [PR(2)] the second proline-rich region (aa 1372–1399), [PR(3)] the third proline-rich region (aa 1691–1713), (C199) His6–l-afadin-C199, (C132) His6–l-afadin-C132, (F) GST–ponsin-2-F (the full length), (N) GST–ponsin-2-N (the NH2-terminal half), (C) GST–ponsin-2-C, [SH3(1+2)] GST– ponsin-2-SH3(1+2) (the first and second SH3 domains), [SH3(2+3)] GST–ponsin-2-SH3(2+3) (the second and third SH3 domains), [SH3(1)] GST–ponsin-2-SH3(1) (the first SH3 domain), [SH3(2)] GST–ponsin-2-SH3(2) (the second SH3 domain), and [SH3(3)] GST– ponsin-2-SH3(3) (the third SH3 domain). The results are representative of three independent experiments.
Figure 5
Binding of ponsin to vinculin in vitro. (A) Subcellular distribution of 35S-labeled ponsin-2–binding proteins in rat liver. An aliquot (60 μg protein) of each subcellular fraction was subjected to SDS-PAGE (8% polyacrylamide gel), followed by 35S-labeled ponsin-2 blot overlay. (Ho) homogenate, (S1) soluble fraction, (P1) pellet fraction, (BC) fraction rich in bile canaliculi, and (AJ) fraction rich in AJ. (B) Mono Q column chromatography of 35S-labeled ponsin-2–binding proteins. (B1) 35S-labeled ponsin-2 blot overlay. An aliquot (10 μl) of each fraction was subjected to SDS-PAGE (8% polyacrylamide gel), followed by 35S-labeled ponsin-2 blot overlay. (B2) Western blot analysis. An aliquot (4 μl) of each fraction was subjected to SDS-PAGE (8% polyacrylamide gel), followed by Western blot analysis using the anti-vinculin antibody. The results are representative of three independent experiments.
Figure 6
Immunoprecipitation analysis of ponsin-2 and vinculin. FLAG–ponsin-2 (the full length), Myc–vinculin-N (the NH2-terminal half), and Myc–vinculin-C (the COOH-terminal half) were expressed in COS7 cells in various combinations by transfection with pFLAG-CMV2–ponsin-2, pCMV-Myc–vinculin-N, and pCMV-Myc–vinculin-C, respectively. Each cell extract was subjected to immunoprecipitation with the anti–FLAG or anti–Myc antibody. The precipitate was then subjected to SDS-PAGE (8% polyacrylamide gel), followed by Western blot analysis using the anti–FLAG or anti–Myc antibody. (IP) Immunoprecipitation. The results are representative of three independent experiments.
Figure 7
Binding regions of ponsin and vinculin. (A) Blot overlay. (A1) 35S-Labeled vinculin blot overlay. Various GST-fused proteins of ponsin-2 (5 pmol each) were subjected to SDS-PAGE (8% polyacrylamide gel), followed by 35S-labeled vinculin blot overlay. (A2) 35S- Labeled ponsin-2 blot overlay. Full-length native vinculin and various recombinant proteins of vinculin (5 pmol each) were subjected to SDS-PAGE (8 and 12% discontinuous polyacrylamide gel), followed by 35S- labeled ponsin blot overlay. (B) Affinity chromatography. (B1) Binding region of ponsin. MBP– vinculin-C (the COOH-terminal half) was incubated with various GST-fused proteins of ponsin-2 immobilized on glutathione-Sepharose beads. Each eluate was subjected to SDS-PAGE (10% polyacrylamide gel), followed by Western blot analysis using the anti-vinculin antibody. (B2) Binding region of vinculin. MBP–vinculin-C or MBP alone was incubated with GST–ponsin-2-C (the COOH-terminal half) or GST alone immobilized on glutathione-Sepharose beads. Each original sample and eluate were subjected to SDS-PAGE (12% polyacrylamide gel), followed by protein staining with Coomassie brilliant blue. (F) GST– ponsin-2-F (the full length), (N) GST–ponsin-2-N (the NH2-terminal half), (C) GST–ponsin-2-C, [SH3(1+2)] GST–ponsin-2-SH3(1+2) (the first and second SH3 domains), [SH3(2+3)] GST–ponsin-2-SH3(2+3) (the second and third SH3 domains), [SH3(1)] GST–ponsin-2-SH3(1) (the first SH3 domain), [SH3(2)] GST–ponsin-2-SH3(2) (the second SH3 domain), [SH3(3)] GST–ponsin-2-SH3(3) (the third SH3 domain), [PR] the proline-rich region of vinculin (aa 837–878), (1) Myc–vinculin-1 (the NH2-terminal region, aa 1–800), (2) Myc–vinculin-2 (the COOH-terminal region, aa 801–1066); (P) GST–vinculin-P (the proline-rich region), and (C-ΔP) GST–vinculin-C-ΔP (the COOH-terminal region lacking the proline-rich region). The results are representative of three independent experiments.
Figure 8
Inability of ponsin to form a ternary complex with l-afadin and vinculin. (A) Immunoprecipitation from COS7 cells. Myc– l-afadin (the full length), FLAG–ponsin-2 (full length), and Myc–vinculin-C (the COOH-terminal half) were expressed in COS7 cells in various combinations by transfection with pCMV-Myc–l-afadin, pFLAG-CMV2–ponsin-2, and pCMV-Myc–vinculin-C, respectively. Each cell extract was subjected to immunoprecipitation with the anti–Myc or anti–FLAG antibody. The precipitate was then subjected to SDS-PAGE (8% polyacrylamide gel), followed by Western blot analysis using the anti–Myc, anti–FLAG, anti–l-afadin, or anti-vinculin antibody. (A1) COS7 cells expressing FLAG–ponsin-2 alone, (A2) COS7 cells expressing both FLAG–ponsin-2 and Myc–vinculin-C, (A3) COS7 cells expressing both Myc–l-afadin and FLAG–ponsin-2. (IP) Immunoprecipitation. (B) Affinity chromatography using ponsin-immobilized beads. Various doses of His6–l-afadin-C199 (the COOH-terminal 199 aa region including the third proline-rich region) and MBP–vinculin-C (the COOH-terminal half) were mixed and incubated with GST–ponsin-2-C (the COOH-terminal half) immobilized on glutathione-Sepharose beads. Each eluate was subjected to SDS-PAGE (15% polyacrylamide gel), followed by protein staining with Coomassie brilliant blue. The results are representative of three independent experiments.
Figure 9
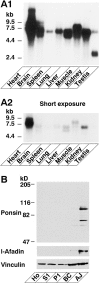
Tissue and subcellular distribution of ponsin. (A) Northern blot analysis. A mouse RNA blot membrane (Clontech) was hybridized with the 32P-labeled full-length cDNA of ponsin-2, followed by autoradiography with 48- or 8-h exposure. (A1) 48-h exposure, and (A2) 8-h exposure. (B) Subcellular distribution in rat liver. An aliquot (15 μg protein) of each subcellular fraction was subjected to SDS-PAGE (8% polyacrylamide gel), followed by Western blot analysis using the anti-ponsin, anti–l-afadin, or anti-vinculin antibody. (Ho) homogenate, (S1) soluble fraction, (P1) pellet fraction, (BC) fraction rich in bile canaliculi, and (AJ) fraction rich in AJ.
Figure 10
Localization of l-afadin, ponsin, and vinculin in cultured mouse mammary tumor MTD-1A cells. The cells were doubly stained with the rabbit anti-ponsin and mouse anti–l-afadin antibodies, or with the rabbit anti-ponsin and mouse anti-vinculin antibodies. There were nuclear stainings with this anti-ponsin antibody, but its significance was not clear. (A) The double staining with the antiponsin and anti–l-afadin antibodies. (A1 and A3) Ponsin, (A2 and A4) l-afadin, (A1 and A2) junctional level, and (A3 and A4) basal level. (B) The double staining with the anti-ponsin and anti-vinculin antibodies. (B1, B3, and B5) Ponsin, (B2, B4, and B6) vinculin, (B1 and B2) junctional level, (B3 and B4) middle level, and (B5 and B6) basal level. Bars: (A) 25 μm and (B) 50 μm. The results are representative of three independent experiments.
Figure 11
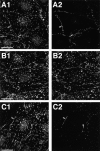
Localization of l-afadin, ponsin, vinculin, and P-cadherin in cultured rat 3Y1 fibroblasts. (A) The double staining with the anti-ponsin and anti–l-afadin antibodies. (A1) Ponsin and (A2) l-afadin. (B) The double staining with the anti-ponsin and anti-vinculin antibodies. (B1) Ponsin and (B2) vinculin. (C) The double staining with the anti-ponsin and anti–P-cadherin antibodies. (C1) Ponsin and (C2) P-cadherin. (Arrows) Cell–cell AJ. Bars: 25 μm. The results are representative of three independent experiments.
Figure 12
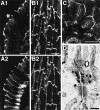
Localization of ponsin, E-cadherin, and vinculin in various rat tissues. (A) The double staining of small intestine absorptive epithelial cells with the antiponsin and anti–E-cadherin antibodies. (A1) Ponsin and (A2) E-cadherin. *Apical side. (B) The double staining of heart with the anti-ponsin and anti-vinculin antibodies. (B1) Ponsin and (B2) vinculin. (Arrow) Intercalated disc and (arrowhead) costamere. (C) The staining of liver with the anti-ponsin antibody. (D) Ultrastructural localization of ponsin in small intestine absorptive epithelial cells. Intestine absorptive epithelial cells were labeled with the anti-ponsin antibody. (Open arrow) ZO, (closed arrow) ZA, and (open arrowhead) desmosome. Bars: (A and C) 10, (B) 50, and (D) 0.1 μm. The results are representative of three independent experiments.
Figure 13
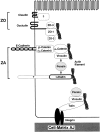
Schematic diagram of ZO, ZA, and cell–matrix AJ.
Similar articles
- Afadin: A novel actin filament-binding protein with one PDZ domain localized at cadherin-based cell-to-cell adherens junction.
Mandai K, Nakanishi H, Satoh A, Obaishi H, Wada M, Nishioka H, Itoh M, Mizoguchi A, Aoki T, Fujimoto T, Matsuda Y, Tsukita S, Takai Y. Mandai K, et al. J Cell Biol. 1997 Oct 20;139(2):517-28. doi: 10.1083/jcb.139.2.517. J Cell Biol. 1997. PMID: 9334353 Free PMC article. - alpha-catenin-independent recruitment of ZO-1 to nectin-based cell-cell adhesion sites through afadin.
Yokoyama S, Tachibana K, Nakanishi H, Yamamoto Y, Irie K, Mandai K, Nagafuchi A, Monden M, Takai Y. Yokoyama S, et al. Mol Biol Cell. 2001 Jun;12(6):1595-609. doi: 10.1091/mbc.12.6.1595. Mol Biol Cell. 2001. PMID: 11408571 Free PMC article. - Similar and differential behaviour between the nectin-afadin-ponsin and cadherin-catenin systems during the formation and disruption of the polarized junctional alignment in epithelial cells.
Asakura T, Nakanishi H, Sakisaka T, Takahashi K, Mandai K, Nishimura M, Sasaki T, Takai Y. Asakura T, et al. Genes Cells. 1999 Oct;4(10):573-81. doi: 10.1046/j.1365-2443.1999.00283.x. Genes Cells. 1999. PMID: 10583506 - Afadin/AF-6 and canoe: roles in cell adhesion and beyond.
Mandai K, Rikitake Y, Shimono Y, Takai Y. Mandai K, et al. Prog Mol Biol Transl Sci. 2013;116:433-54. doi: 10.1016/B978-0-12-394311-8.00019-4. Prog Mol Biol Transl Sci. 2013. PMID: 23481206 Review. - PLEKHA7: Cytoskeletal adaptor protein at center stage in junctional organization and signaling.
Shah J, Guerrera D, Vasileva E, Sluysmans S, Bertels E, Citi S. Shah J, et al. Int J Biochem Cell Biol. 2016 Jun;75:112-6. doi: 10.1016/j.biocel.2016.04.001. Epub 2016 Apr 9. Int J Biochem Cell Biol. 2016. PMID: 27072621 Review.
Cited by
- Adaptor molecules mediate negative regulation of macrophage inflammatory pathways: a closer look.
Baig MS, Barmpoutsi S, Bharti S, Weigert A, Hirani N, Atre R, Khabiya R, Sharma R, Sarup S, Savai R. Baig MS, et al. Front Immunol. 2024 Feb 28;15:1355012. doi: 10.3389/fimmu.2024.1355012. eCollection 2024. Front Immunol. 2024. PMID: 38482001 Free PMC article. Review. - The zonula adherens matura redefines the apical junction of intestinal epithelia.
Mangeol P, Massey-Harroche D, Sebbagh M, Richard F, Le Bivic A, Lenne PF. Mangeol P, et al. Proc Natl Acad Sci U S A. 2024 Feb 27;121(9):e2316722121. doi: 10.1073/pnas.2316722121. Epub 2024 Feb 20. Proc Natl Acad Sci U S A. 2024. PMID: 38377188 Free PMC article. - DOCK3 regulates normal skeletal muscle regeneration and glucose metabolism.
Samani A, Karuppasamy M, English KG, Siler CA, Wang Y, Widrick JJ, Alexander MS. Samani A, et al. FASEB J. 2023 Oct;37(10):e23198. doi: 10.1096/fj.202300386RR. FASEB J. 2023. PMID: 37742307 Free PMC article. - DOCK3 regulates normal skeletal muscle regeneration and glucose metabolism.
Samani A, Karuppasamy M, English KG, Siler CA, Wang Y, Widrick JJ, Alexander MS. Samani A, et al. bioRxiv [Preprint]. 2023 Feb 27:2023.02.22.529576. doi: 10.1101/2023.02.22.529576. bioRxiv. 2023. PMID: 36865261 Free PMC article. Updated. Preprint. - The Actin Network Interfacing Diverse Integrin-Mediated Adhesions.
Geiger B, Boujemaa-Paterski R, Winograd-Katz SE, Balan Venghateri J, Chung WL, Medalia O. Geiger B, et al. Biomolecules. 2023 Feb 4;13(2):294. doi: 10.3390/biom13020294. Biomolecules. 2023. PMID: 36830665 Free PMC article. Review.
References
- Aberle H, Butz S, Stappert J, Weissig H, Kemler R, Hoschuetzky H. Assembly of the cadherin–catenin complex in vitro with recombinant proteins. J Cell Sci. 1994;107:3655–3663. - PubMed
- Bradford MM. A rapid and sensitive method for the quantitation of microgram quantities of protein utilizing the principle of protein-dye binding. Anal Biochem. 1976;72:248–254. - PubMed
- Burridge K, Mangeat P. An interaction between vinculin and talin. Nature. 1984;308:744–746. - PubMed
MeSH terms
Substances
LinkOut - more resources
Full Text Sources
Molecular Biology Databases
Miscellaneous
