c-Myc overexpression uncouples DNA replication from mitosis - PubMed (original) (raw)
c-Myc overexpression uncouples DNA replication from mitosis
Q Li et al. Mol Cell Biol. 1999 Aug.
Abstract
c-myc has been shown to regulate G(1)/S transition, but a role for c-myc in other phases of the cell cycle has not been identified. Exposure of cells to colcemid activates the mitotic spindle checkpoint and arrests cells transiently in metaphase. After prolonged colcemid exposure, the cells withdraw from mitosis and enter a G(1)-like state. In contrast to cells in G(1), colcemid-arrested cells have decreased G(1) cyclin-dependent kinase activity and show hypophosphorylation of the retinoblastoma protein. We have found that overexpression of c-myc causes colcemid-treated human and rodent cells to become either apoptotic or polyploid by replicating DNA without chromosomal segregation. Although c-myc-induced polyploidy is not inhibited by wild-type p53 in immortalized murine fibroblasts, overexpression of c-myc in primary fibroblasts resulted in massive apoptosis of colcemid-treated cells. We surmise that additional genes are altered in immortalized cells to suppress the apoptotic pathway and allow c-myc-overexpressing cells to progress forward in the presence of colcemid. Our results also suggest that c-myc induces DNA rereplication in this G(1)-like state by activating CDK2 activity. These observations indicate that activation of c-myc may contribute to the genomic instability commonly found in human cancers.
Figures
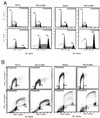
FIG. 1
Formation of polyploid population by overexpressed c-myc in the presence of colcemid in rodent and human cells. (A) DNA content (propidium iodide staining) flow cytometric histograms of untreated and colcemid-treated Rat1a and Rat1a-Myc cells. Cells with or without colcemid (25 ng/ml) were incubated for 18 and 22 h. Primary data are displayed as dots, and the computer best fit of data is shown as dashed lines and hatched contours. Without colcemid, the cells in the 2N, 2N-to-4N, and 4N populations account for 38.6, 43.8, and 17.6% for Rat1a and 35.4, 49.7, and 14.9% for Rat1a-Myc cells, respectively. With colcemid for 18 h, 53.8 and 23.0% of cells were arrested at 4N for Rat1a and Rat1a-Myc, respectively. Of the Rat1a cells, 36.5% were in the 4N-to-8N population, and 9.7% had 8N DNA content, while the percentages of the 4N-to-8N and 8N populations for Rat1a-Myc were 54.1 and 22.8%, respectively. After 22 h of colcemid incubation, 40.8 and 16.7% of the Rat1a and Rat1a-Myc cells were arrested at 4N, respectively. Of the Rat1a cells, 43.4% were in the S phase after 4N, and 15.7% accumulated at 8N, whereas 36.4% of Rat1a-Myc cells were in the S phase after 4N, and 46.9% were octaploid. (B) Two-dimensional BrdU incorporation (y axis) and DNA content (x axis) flow cytometric diagrams. The DNA contents of the cells are indicated in the diagrams. All experiments were replicated in separate studies. (C) Flow cytometric histograms of immortalized human breast epithelial A1N4 and A1N4-Myc cells with or without exposure to colcemid (25 ng/ml) for 24 and 48 h. Without colcemid, 57.1% of A1N4 cells were in G1, 28.7% were in S phase, and 14.2% were in G2/M phase. The percentages of A1N4-Myc cells in the G1, S, and G2/M phases were 49.0, 38.8, and 12.2%, respectively. With colcemid exposure for 24 h, 80.8% of A1N4 cells were arrested in G2/M, 15.5% were in the subsequent S phase, and 3.7% accumulated at 8N. At the same time point, 81.3% of the A1N4-Myc cells were arrested at 4N, 12.2% were in the interval from 4N to 8N, and 6.6% were at 8N. At 48 h after colcemid treatment, 68.8% of the A1N4 cells were arrested at 4N, 23.4% were in interval from 4N to 8N, and 7.8% were at 8N, whereas only 25.0% of the A1N4-Myc cells were arrested in G2/M, 31.8% of A1N4-Myc cells were within the interval from 4N to 8N, and 43.2% had a DNA content of 8N.
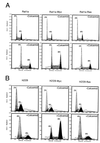
FIG. 2
Overexpression of c-myc but not ras induces polyploidy. (A) DNA content flow cytometric histograms of Rat1a, Rat1a-Myc, and transformed Rat1a-Ras fibroblasts with or without exposure to colcemid (25 ng/ml) for 18 h. Culture conditions were as described in Fig. 1. The percentages of untreated cells in the G1, S, and G2/M phases were 39.7, 39.9, and 20.4%, respectively, for Rat1a; 39.7, 42.1, and 18.2%, respectively, for Rat1a-Myc; and 39.6, 38.4, and 22.0%, respectively, for Rat1a-Ras. With 18 h of treatment, the percentages of cells with 4N, 4N-to-8N, and 8N DNA contents were 40.9, 43.5, and 15.6%, respectively, for Rat1a; 25.6, 47.7, and 26.7%, respectively, for Rat1a-Myc cells; and 44.0, 36.6, and 19.4%, respectively, for Rat1a-Ras cells. (B) Flow cytometric histograms of human lung carcinoma NCI H209, H209-Myc, and H209-Ras cells with or without exposure to colcemid (25 ng/ml) for 72 h. The percentages of untreated cells in the G1, S, and G2/M phases were 46.8, 17.3, and 35.9%, respectively, for H209 cells; 48.6, 25.0, and 26.4%, respectively, for H209-Myc cells; and 50.0, 25.0, and 25.1%, respectively, for H209-Ras cells. After 72 h of exposure to colcemid, the percentages of cells with DNA contents of 4N, 4N to 8N, and 8N were 64.8, 16.0, and 19.2%, respectively, for H209 cells; 22.2, 24.4, and 53.5%, respectively, for H209-Myc cells; and 67.3, 8.9, and 23.8%, respectively, for H209-Ras cells.
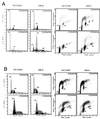
FIG. 3
Overexpression of c-myc induces polyploidy in the presence of overexpressed wild-type p53 in a murine fibroblast cell line. (A) Cells cultured at 32°C were left untreated or were treated with colcemid (25 ng/ml) for 48 h. Murine BALB/c fibroblasts line 10(1)Val5 expresses a temperature-sensitive p53 allele; VM10 is derived from 10(1)Val5 by transfection of a murine c-myc expression vector. The two left panel columns show DNA histograms, and the two right panel columns represent BrdU and propidium iodide two-dimensional flow cytometric diagrams. The percentages of untreated cells in 2N, 2N to 4N, and 4N were 74.6, 8.1, and 17.4%, respectively, for 10(1)Val5 cells and 49.6, 30.4, and 20.0%, respectively, for VM10 cells. With colcemid exposure, 57.9% of the 10(1)Val5 cells were in 2N, 13.6% were in 2N to 4N, and 28.6% were in 4N. Meanwhile, 9.3% of VM10 cells were in 2N, 11.4% were in 2N to 4N, 61.1% were in 4N, 12.9% were in 4N to 8N, and 5.7% were in 8N. (B) Cells grown at 37.5°C were left untreated or were treated with colcemid for 24 h. The two left panel columns show DNA histograms, and the two right panel columns represent BrdU and propidium iodide two-dimensional flow cytometric diagrams. Without colcemid, the percentages of cells in 2N, 2N to 4N and 4N were 36.7, 48.0, and 15.2%, respectively, for 10(1)Val5 and 32.0, 52.3, and 15.8%, respectively, for VM10 cells. With colcemid exposure, 52.2% of the 10(1)Val5 cells were in 4N and 47.8% were in 4N to 8N, whereas 45.9% of the VM10 cells were in 4N, 46.9% were in 4N to 8N, and 7.2% were in 8N. (C) The effect of colcemid on synchronized 10(1)Val5 and VM10 cells at 32°C. Cells were synchronized by incubating with mimosine (200 μM) at 37.5°C for 22 h and then released into regular medium. At 6 h after their release from mimosine, the cells were switched to 32°C and grown for 48 h with or without colcemid (25 ng/ml). Without colcemid, the percentages of cells in 2N, 2N to 4N, and 4N were 73.3, 14.6, and 12.0%, respectively, for 10(1)Val5 cells and 67.2, 25.7, and 7.1%, respectively, for VM10 cells. With colcemid exposure, 33.4% of the 10(1)Val5 cells were in 2N, 29.2% were in 2N to 4N, 30.7% were in 4N, 5.6% were in 4N to 8N, and 1.0% were in 8N. With colcemid exposure, most of the viable VM10 cells had a DNA content equal to or higher than 4N with 65.0% in 4N, 28.1% in 4N to 8N, and 6.9% at 8N.
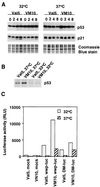
FIG. 4
Status of p53 in (10)1Val5 (Val5) and VM10 cells. (A) Immunoblot of p21 induction by etoposide as a surrogate marker of p53 function. Val5 and VM10 cells were collected at different times (shown in hours at the top) after exposure to etoposide (40 μg/ml). A Coomassie blue-stained gel was used as loading control. (B) Immunoprecipitation of metabolically labeled p53 in Val5 and VM10 cells. (C) Luciferase reporter assay with p21 promoter. Cells were transfected with either a control promoterless vector with luciferase reporter gene (Mock), the wild-type 2.4-kb p21 promoter cloned into the reporter vector (wwp-luc), or a mutated p21 promoter with the p53 responsive element at 2.4 kb upstream deleted in the reporter vector (DM-luc) (19). Luciferase activity is shown as relative light units (RLU).
FIG. 5
Apoptosis of colcemid-treated Rat1a, Rat1a-Myc, and Rat1a-Ras cells. Cells were treated with colcemid for 18 h. DNA content determined by propidium iodide staining is shown on the x axis. A TDT end-labeling assay (i.e., a TUNEL assay) was performed as described by Gorczyca et al. (24). Without colcemid, the level of staining is lower than 3% for all three cell lines. With colcemid, 15.2% of Rat1a, 36.2% of Rat1a-Myc, and 13.3% of Rat1a-Ras cells were stained.
FIG. 6
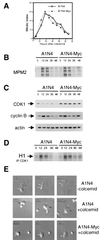
Adaptation of human breast epithelial A1N4 and A1N4-Myc cells after prolonged exposure to colcemid. (A) Mitotic index of A1N4 and A1N4-Myc at different intervals of colcemid incubation. Asynchronous cells were treated with colcemid and fixed and stained with DAPI at different times. The mitotic index was measured by counting the percentage of cells with condensed chromosomes. (B) Immunoblot analysis of mitosis-specific phosphoepitope with MPM-2 antibody in lysates from asynchronous A1N4 or A1N4-Myc cells at various times (shown at the top in hours) after exposure to colcemid. (C) Protein levels of CDK1-cyclin B complex. The actin level was used as a loading control. (D) Autoradiogram of phosphorylated histone H1. Histone H1 kinase activities were measured from p34cdc2 immunoprecipitates (IP) of A1N4 or A1N4-Myc cell lysates obtained at different times after treatment with colcemid. (E) Videomi- croscopic photographs of A1N4 cells without (upper panel) or with (middle panel) colcemid exposure, as well as A1N4-Myc cells with colcemid treatment (lower panel). Arrows mark individual cells during time-lapse microscopy.
FIG. 7
Activities of G1 kinases and phosphorylation status of RB protein in colcemid-treated A1N4 cells. (A) Protein abundance and kinase activity of CDK4-cyclin D1 complexes. Histone H1 kinase activities were measured from CDK4 immunoprecipitates (IP) of A1N4 or A1N4-Myc cell lysates obtained at various times after treatment with colcemid. (B) Protein abundance and kinase activity of CDK2-cyclin complexes. Histone H1 kinase activities were measured from CDK2 immunoprecipitates of A1N4 or A1N4-Myc cell lysates obtained at various times after treatment with colcemid. (C) Immunoblot analysis of RB protein in lysates obtained at various time points shows RB hypophosphorylation with colcemid exposure.
FIG. 8
Proposed model of the activity of c-myc in uncoupling DNA synthesis from mitosis. Spindle disruption is shown to cause hypophosphorylation of RB protein. c-myc is shown to bypass hypophosphorylated RB, inducing endoreduplication and apoptosis.
Similar articles
- DNA rereplication in the presence of mitotic spindle inhibitors in human and mouse fibroblasts lacking either p53 or pRb function.
Di Leonardo A, Khan SH, Linke SP, Greco V, Seidita G, Wahl GM. Di Leonardo A, et al. Cancer Res. 1997 Mar 15;57(6):1013-9. Cancer Res. 1997. PMID: 9067261 - Expression of apoptosis and cell cycle related genes in proliferating and colcemid arrested cells of divergent lineage.
Gallaher BW, Berthold A, Klammt J, Knüpfer M, Kratzsch J, Bartsch M, Kiess W. Gallaher BW, et al. Cell Mol Biol (Noisy-le-grand). 2000 Feb;46(1):79-88. Cell Mol Biol (Noisy-le-grand). 2000. PMID: 10726974 - Activation of c-Myc uncouples DNA replication from activation of G1-cyclin-dependent kinases.
Pusch O, Bernaschek G, Eilers M, Hengstschläger M. Pusch O, et al. Oncogene. 1997 Aug 7;15(6):649-56. doi: 10.1038/sj.onc.1201236. Oncogene. 1997. PMID: 9264405 - Therapeutic opportunities to control tumor cell cycles.
Malumbres M. Malumbres M. Clin Transl Oncol. 2006 Jun;8(6):399-408. doi: 10.1007/s12094-006-0193-7. Clin Transl Oncol. 2006. PMID: 16790392 Review. - The functions of Myc in cell cycle progression and apoptosis.
Steiner P, Rudolph B, Müller D, Eilers M. Steiner P, et al. Prog Cell Cycle Res. 1996;2:73-82. doi: 10.1007/978-1-4615-5873-6_7. Prog Cell Cycle Res. 1996. PMID: 9552384 Review.
Cited by
- MYC, metabolism, cell growth, and tumorigenesis.
Dang CV. Dang CV. Cold Spring Harb Perspect Med. 2013 Aug 1;3(8):a014217. doi: 10.1101/cshperspect.a014217. Cold Spring Harb Perspect Med. 2013. PMID: 23906881 Free PMC article. - Estrogen mediates Aurora-A overexpression, centrosome amplification, chromosomal instability, and breast cancer in female ACI rats.
Li JJ, Weroha SJ, Lingle WL, Papa D, Salisbury JL, Li SA. Li JJ, et al. Proc Natl Acad Sci U S A. 2004 Dec 28;101(52):18123-8. doi: 10.1073/pnas.0408273101. Epub 2004 Dec 15. Proc Natl Acad Sci U S A. 2004. PMID: 15601761 Free PMC article. - A role for polyploidy in the tumorigenicity of Pim-1-expressing human prostate and mammary epithelial cells.
Roh M, Franco OE, Hayward SW, van der Meer R, Abdulkadir SA. Roh M, et al. PLoS One. 2008 Jul 2;3(7):e2572. doi: 10.1371/journal.pone.0002572. PLoS One. 2008. PMID: 18596907 Free PMC article. - Anti-c-myc RNAi-Based Onconanotherapeutics.
Habib S, Ariatti M, Singh M. Habib S, et al. Biomedicines. 2020 Dec 15;8(12):612. doi: 10.3390/biomedicines8120612. Biomedicines. 2020. PMID: 33333729 Free PMC article. Review. - c-myc and N-myc promote active stem cell metabolism and cycling as architects of the developing brain.
Wey A, Knoepfler PS. Wey A, et al. Oncotarget. 2010 Jun;1(2):120-30. doi: 10.18632/oncotarget.116. Oncotarget. 2010. PMID: 20651942 Free PMC article.
References
- Amati B, Alevizopoulos K, Vlach J. Myc and the cell cycle. Front Biosci. 1998;3:250–268. - PubMed
- Barr L F, Campbell S E, Penno M B, Ball D W, Baylin S B. Cell-substratum interactions mediate oncogene-induced phenotype of lung cancer cells. Cell Growth Differ. 1996;7:1149–1156. - PubMed
- Berns K, Hijmans E M, Bernards R. Repression of c-Myc responsive genes in cycling cells causes G1 arrest through reduction of cyclin E/CDK2 kinase activity. Oncogene. 1997;15:1347–1356. - PubMed
Publication types
MeSH terms
Substances
LinkOut - more resources
Full Text Sources
Research Materials
Miscellaneous
