High frequencies of naive Melan-A/MART-1-specific CD8(+) T cells in a large proportion of human histocompatibility leukocyte antigen (HLA)-A2 individuals - PubMed (original) (raw)
High frequencies of naive Melan-A/MART-1-specific CD8(+) T cells in a large proportion of human histocompatibility leukocyte antigen (HLA)-A2 individuals
M J Pittet et al. J Exp Med. 1999.
Abstract
Using fluorescent HLA-A*0201 tetramers containing the immunodominant Melan-A/MART-1 (Melan-A) tumor-associated antigen (Ag), we previously observed that metastatic lymph nodes of melanoma patients contain high numbers of Ag-experienced Melan-A-specific cytolytic T lymphocytes (CTLs). In this paper, we enumerated and characterized ex vivo Melan-A-specific cells in peripheral blood samples from both melanoma patients and healthy individuals. High frequencies (>/=1 in 2,500 CD8(+) T cells) of Melan-A-specific cells were found in 10 out of 13 patients, and, surprisingly, in 6 out of 10 healthy individuals. Virtually all Melan-A-specific cells from 6 out of 6 healthy individuals and from 7 out of 10 patients displayed a naive CD45RA(hi)/RO(-) phenotype, whereas variable proportions of Ag-experienced CD45RA(lo)/RO(+) Melan-A-specific cells were observed in the remaining 3 patients. In contrast, ex vivo influenza matrix-specific CTLs from all individuals exhibited a CD45RA(lo)/RO(+) memory phenotype as expected. Ag specificity of tetramer-sorted A2/Melan-A(+) cells from healthy individuals was confirmed after mitogen-driven expansion. Likewise, functional limiting dilution analysis and interferon gamma ELISPOT assays independently confirmed that most of the Melan-A-specific cells were not Ag experienced. Thus, it appears that high frequencies of naive Melan-A-specific CD8(+) T cells can be found in a large proportion of HLA-A*0201(+) individuals. Furthermore, as demonstrated for one patient followed over time, dramatic phenotype changes of circulating Melan-A-specific cells can occur in vivo.
Figures
Figure 1
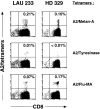
Detection of ex vivo circulating A2/Melan-A+ and A2/Flu-MA+, but not A2/Tyrosinase+CD8+ T cells by flow cytometry, in a melanoma patient (LAU 233) and a healthy donor (HD 329). Highly homogeneous CD8+ lymphocyte populations (>98%) were obtained from PBMCs of patient LAU 233 or from healthy donor HD 329, by two rounds of positive selection with magnetic cell sorting. The lymphocyte preparations were then stained with A2/Melan-A, A2/Tyrosinase, or A2/Flu-MA tetramers together with anti-CD8FITC mAb, and analyzed immediately by flow cytometry. The frequency of up to 0.01% of A2/tyrosinase+ cells was below the limit of detection (≥0.04% for A2/Melan-A; ≥0.02% for A2/Flu-MA).
Figure 2
Phenotypic analysis of ex vivo circulating A2/Melan-A+ and A2/Flu-MA+ cells in melanoma patients and healthy donors. CD8+ lymphocyte populations were highly purified (>98%) from PBMCs, as illustrated in Fig. 1. The lymphocyte preparations were then stained with A2/Melan-A, or A2/Flu-MA tetramers together with anti-CD45RACYC and either anti-CD45ROFITC or anti-CD28FITC mAbs, and immediately analyzed by flow cytometry. (A) Pattern of expression of CD45RA/RO (top) or CD45RA/CD28 (bottom) in total circulating CD8+ T cells (left) from healthy donors (shown is HD 329). They were CD28+CD45RAhi/RO− in A2/Melan-A+ gated cells (middle) but CD28+CD45RAlo/RO+ in A2/Flu-MA+ gated cells (right). (B) Circulating A2/Melan-A+CD8+ T cells detected in the majority (7 out of 10) of melanoma patients presented a CD28+CD45RAhi/RO− phenotype (left). In contrast, tetramer+ cells from 2 out of 10 patients displayed variable proportions of CD45RAhi/RO− and CD45RAlo/RO+tetramer+ cells (middle) and a CD28−CD45RAint phenotype for 1 out of 10 patients (right). (C) Summary of phenotyping data obtained for melanoma patients and healthy donors. Frequencies of CD45RAlo cells detected in gated A2/Melan-A+ and A2/Flu-MA+CD8+ T cells were calculated with CellQuest™ software.
Figure 5
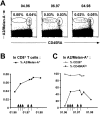
Time course analysis of PBMCs from immunized melanoma patient LAU 132 shows dramatic phenotype changes of A2/Melan-A+CD8+ T cells. CD8+ lymphocyte populations from PBMCs of patient LAU 132 collected at different time points were highly purified (>98%), as illustrated in Fig. 1. The lymphocyte preparations were then stained with A2/Melan-A tetramers together with anti-CD45RACYC and anti-CD28FITC mAbs and analyzed immediately by flow cytometry. (A) The patient received five immunization cycles, consisting of subcutaneous injections of Melan-A26–35, Tyrosinase1–9, Tyrosinase368–376, gp100280–288, and gp100457–466 tumor-associated Ags, and influenza matrix Flu-MA58–66 peptide. All cycles with the exception of the first included treatment with GM-CSF. CD45RA phenotype of A2/Melan-A+ cells was analyzed before the first immunization cycle (left), during immunizations (middle), and at the end of immunizations (right). (B) Percentage of A2/Melan-A+ cells in CD8+ T cells was followed over time. Each arrow represents an immunization cycle. (C) Proportions of CD28+ (○) and CD45RAlo (•) in gated A2/Melan-A+ cells were followed over time.
Figure 3
IFN-γ ELISPOT assay confirms the naive status of most Melan-A–specific cells. Frequency of Flu-MA– (A) and Melan-A–specific (B) CTLs in CD8+ cells from 10 healthy donors and 11 melanoma patients (LAU 240 and 267 excepted) was measured by both IFN-γ ELISPOT assay (x-axis) and tetramer staining (y-axis), as described in Materials and Methods. The phenotypes of tetramer+ cells are as follows: CD28+CD45RAhi (○), CD28+ CD45RAlo (▪), 30–50% CD28+ CD45RAlo (▴) and >60% CD28− (♦). The bars indicate the lower detection limits for both techniques. These were 0.4 × 10⁻³ for A2/Melan-A, 0.1 × 10⁻³ for A2/Flu-MA (see footnote to Table for details), and 0.09 × 10⁻³ for IFN-γ ELISPOT (see Materials and Methods for details).
Figure 4
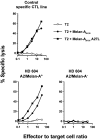
Functional activity of PBMCs sorted according to their tetramer staining phenotype correlates with Ag specificity. Ex vivo CD8+ PBMCs from a healthy donor (HD 604) were sorted into A2/Melan-A tetramer+ and tetramer− populations. After 2 wk in the presence of irradiated autologous PBMCs and PHA, each cell fraction and a specific CTL line was tested for its lytic activity against Cr-labeled T2 target cells pulsed with different peptides: T2 cells alone (○), T2 + Melan-A 26-35 (•); and T2 + Melan-A 26-35 A27L (▪).
Similar articles
- Circulating Melan-A/Mart-1 specific cytolytic T lymphocyte precursors in HLA-A2+ melanoma patients have a memory phenotype.
D'Souza S, Rimoldi D, Líenard D, Lejeune F, Cerottini JC, Romero P. D'Souza S, et al. Int J Cancer. 1998 Dec 9;78(6):699-706. doi: 10.1002/(sici)1097-0215(19981209)78:6<699::aid-ijc6>3.0.co;2-u. Int J Cancer. 1998. PMID: 9833762 - Ex vivo IFN-gamma secretion by circulating CD8 T lymphocytes: implications of a novel approach for T cell monitoring in infectious and malignant diseases.
Pittet MJ, Zippelius A, Speiser DE, Assenmacher M, Guillaume P, Valmori D, Liénard D, Lejeune F, Cerottini JC, Romero P. Pittet MJ, et al. J Immunol. 2001 Jun 15;166(12):7634-40. doi: 10.4049/jimmunol.166.12.7634. J Immunol. 2001. PMID: 11390521 - An expanded peripheral T cell population to a cytotoxic T lymphocyte (CTL)-defined, melanocyte-specific antigen in metastatic melanoma patients impacts on generation of peptide-specific CTLs but does not overcome tumor escape from immune surveillance in metastatic lesions.
Anichini A, Molla A, Mortarini R, Tragni G, Bersani I, Di Nicola M, Gianni AM, Pilotti S, Dunbar R, Cerundolo V, Parmiani G. Anichini A, et al. J Exp Med. 1999 Sep 6;190(5):651-67. doi: 10.1084/jem.190.5.651. J Exp Med. 1999. PMID: 10477550 Free PMC article. - Melan-A/MART-1-specific CD8 T cells: from thymus to tumor.
Pittet MJ, Zippelius A, Valmori D, Speiser DE, Cerottini JC, Romero P. Pittet MJ, et al. Trends Immunol. 2002 Jul;23(7):325-8. doi: 10.1016/s1471-4906(02)02244-5. Trends Immunol. 2002. PMID: 12103339 Review. No abstract available. - Melanoma antigens and their recognition by T cells.
Parmiani G. Parmiani G. Keio J Med. 2001 Jun;50(2):86-90. doi: 10.2302/kjm.50.86. Keio J Med. 2001. PMID: 11450597 Review.
Cited by
- Extended co-expression of inhibitory receptors by human CD8 T-cells depending on differentiation, antigen-specificity and anatomical localization.
Baitsch L, Legat A, Barba L, Fuertes Marraco SA, Rivals JP, Baumgaertner P, Christiansen-Jucht C, Bouzourene H, Rimoldi D, Pircher H, Rufer N, Matter M, Michielin O, Speiser DE. Baitsch L, et al. PLoS One. 2012;7(2):e30852. doi: 10.1371/journal.pone.0030852. Epub 2012 Feb 8. PLoS One. 2012. PMID: 22347406 Free PMC article. - Resident Memory and Recirculating Memory T Cells Cooperate to Maintain Disease in a Mouse Model of Vitiligo.
Richmond JM, Strassner JP, Rashighi M, Agarwal P, Garg M, Essien KI, Pell LS, Harris JE. Richmond JM, et al. J Invest Dermatol. 2019 Apr;139(4):769-778. doi: 10.1016/j.jid.2018.10.032. Epub 2018 Nov 10. J Invest Dermatol. 2019. PMID: 30423329 Free PMC article. - High frequencies of circulating memory T cells specific for calreticulin exon 9 mutations in healthy individuals.
Holmström MO, Ahmad SM, Klausen U, Bendtsen SK, Martinenaite E, Riley CH, Svane IM, Kjær L, Skov V, Ellervik C, Pallisgaard N, Hasselbalch HC, Andersen MH. Holmström MO, et al. Blood Cancer J. 2019 Jan 17;9(2):8. doi: 10.1038/s41408-018-0166-4. Blood Cancer J. 2019. PMID: 30655510 Free PMC article. - Phenotypic and functional maturation of tumor antigen-reactive CD8+ T lymphocytes in patients undergoing multiple course peptide vaccination.
Powell DJ Jr, Rosenberg SA. Powell DJ Jr, et al. J Immunother. 2004 Jan-Feb;27(1):36-47. doi: 10.1097/00002371-200401000-00004. J Immunother. 2004. PMID: 14676632 Free PMC article. - TCRs used in cancer gene therapy cross-react with MART-1/Melan-A tumor antigens via distinct mechanisms.
Borbulevych OY, Santhanagopolan SM, Hossain M, Baker BM. Borbulevych OY, et al. J Immunol. 2011 Sep 1;187(5):2453-63. doi: 10.4049/jimmunol.1101268. Epub 2011 Jul 27. J Immunol. 2011. PMID: 21795600 Free PMC article.
References
- Robbins P.F., Kawakami Y. Human tumor antigens recognized by T cells. Curr. Opin. Immunol. 1996;8:628–636. - PubMed
- Romero P. Cytolytic T lymphocyte responses of cancer patients to tumor-associated antigens. Springer Semin. Immunopathol. 1996;18:185–198. - PubMed
- Pardoll D.M. Cancer vaccines. Nat. Med. 1998;4:525–531. - PubMed
Publication types
MeSH terms
Substances
LinkOut - more resources
Full Text Sources
Other Literature Sources
Medical
Research Materials


