Suppression of epithelial apoptosis and delayed mammary gland involution in mice with a conditional knockout of Stat3 - PubMed (original) (raw)
Suppression of epithelial apoptosis and delayed mammary gland involution in mice with a conditional knockout of Stat3
R S Chapman et al. Genes Dev. 1999.
Abstract
Mammary gland involution is characterized by extensive apoptosis of the epithelial cells. At the onset of involution, Stat3 is specifically activated. To address the function of this signaling molecule in mammary epithelial apoptosis, we have generated a conditional knockout of Stat3 using the Cre-lox recombination system. Following weaning, a decrease in apoptosis and a dramatic delay of involution occurred in Stat3 null mammary tissue. Involution is normally associated with a significant increase in IGFBP-5 levels. This was observed in control glands, but not in the absence of Stat3. IGFBP-5 has been suggested to induce apoptosis by sequestering IGF-1 to casein micelles, thereby inhibiting its survival function. Our findings suggest that IGFBP-5 is a direct or indirect target for Stat3 and its upregulation is essential to normal involution. No marked differences were seen in the regulation of Stat5, Bcl-x(L), or Bax in the absence of Stat3. Precocious activation of Stat1 and increases in levels of p53 and p21 occurred and may act as compensatory mechanisms for the eventual initiation of involution observed in Stat3 null mammary glands. This is the first demonstration of the importance of a Stat factor in signaling the initiation of physiological apoptosis in vivo.
Figures
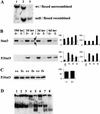
Figure 1
Deletion of Stat3 in the mammary gland of BLG–Cre/Stat3flox/− mice. (A) Southern analysis of Stat3. (Lane 1) Wild-type DNA; (lane 2) DNA from floxed/null liver (not recombined); (lane 3) DNA from floxed/null mammary gland (recombined). (B) Western blot analysis of protein extracted from mammary glands, 20 μg of protein/lane. Western blots show total Stat3 and phosphorylated Stat3 (P.Stat3) at day 10 of lactation (lac, L) and days 2, 3, and 6 of involution (inv, I). (Graph left) Densitometry analysis for 3–4 independent mice, mean ±
s.e.m.
calculated as a percentage of the highest value for each blot; (graph, right) values relative to keratin 18 calculated as a proportion of the mean (hence, no error bars are included). Solid bars (f+) BLG–Cre/Stat3flox/+ (open bars) (f−) BLG–Cre/Stat3flox/−; (arrows) full-length and ΔStat3. (C) Western blotting for phosphorylated Stat3 at day 2 of involution in BLG–Cre/Stat3flox/+ (f+) and wild-type Stat3 (++) glands, (shown for three independent mice). Graph shows densitometry analysis. (D) EMSA with a Stat-specific site at day 2 of involution. (Lanes 1–4) BLG–Cre/Stat3flox/+; (lanes 5–8) BLG–Cre/Stat3flox/−; (lanes 1,5) no supershift; (lanes 2,6) Stat1 supershift; (lanes 3,7) Stat3 supershift; (lanes 4,8) Stat5 supershift.
Figure 2
Deletion of Stat3 in mammary epithelial cells of BLG–Cre/Stat3flox/− mice. Immunohistochemistry for Stat3 protein at day 2 of involution in BLG–Cre/Stat3flox/+ mammary glands (A) and BLG–Cre/Stat3flox/− mammary glands (B). Scale bar, 25 μm. (Inset) High power magnification. Scale bar, 10 μm.
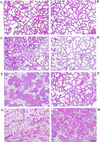
Figure 3
Delayed involution in BLG–Cre/Stat3flox/− mammary glands. (A,C,E,G) BLG–Cre/Stat3flox/+ mammary glands; (B,D,F,H) BLG–Cre/Stat3flox/− mammary glands; (A,B) day 10 of lactation; (C,D) day 2 of involution; (E,F) day 3 of involution; (G,H) day 6 of involution. Scale bar, 100 μm.
Figure 4
Delayed reappearance of adipocytes in BLG–Cre/Stat3flox/− mammary glands. Each bar represents the mean of data collected from three mice, (solid bars) BLG–Cre/Stat3flox/+; (open bars) BLG–Cre/Stat3flox/−. Error bars represent standard error of the mean. (*) p < 0.05 Mann–Whitney U test; (lac) lactation; (inv) involution.
Figure 5
Suppression of epithelial apoptosis in BLG–Cre/Stat3flox/− mammary glands. (Top) Morphological assessment of cells exhibiting condensed chromatin; (bottom) TUNEL analysis. Each panel shows a representative photograph at day 3 of involution and quantification of the results (A) BLG–Cre/Stat3flox/+; (solid bars), (B) BLG–Cre/Stat3flox/−; (open bars). Each bar represents the mean of data collected from three mice. Error bars represent standard error of the mean; (*) P < 0.05 Mann–Whitney U test; (lac) lactation; (inv) involution. Scale bar, 10 μm.
Figure 6
Analysis of molecular changes during involution by Western blot: 20 μg protein/lane keratin 18 (Ker 18) and Stat5a; 5 μg protein/lane β-casein (B-cas), WAP and SGP-2 (clusterin) at day 10 of lactation (lac, L) and days 2, 3, and 6 of involution (inv, I). (Graph left Densitometry analysis for three independent mice, mean ± sem calculated as a percentage of the highest value for each blot; (graph right) values relative to keratin 18 calculated as a proportion of the mean (hence no error bars are included). (f+) BLG–Cre/Stat3flox/+ (solid bars); (f−) BLG–Cre/Stat3flox/− (open bars).
Figure 7
Regulation of Stat1 in the absence of Stat3 measured by Western blot, 20 μg protein/lane. Westerns show total Stat1 and phosphorylated Stat1 (P.Stat1) at day 10 of lactation (lac, L) and days 2, 3, and 6 of involution (inv, I). (Graph left) densitometry analysis of three independent mice, mean ± sem calculated as a percentage of the highest value for each blot; (graph right) values relative to keratin 18 calculated as a proportion of the mean (hence, no error bars are included). (f+) BLG–Cre/Stat3flox/+ (solid bars); (f−) BLG–Cre/Stat3flox/− (open bars).
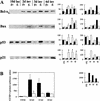
Figure 8
Regulation of apoptosis-related proteins during involution. (A) Western blot analysis of Bcl-xL, Bax, p53 and p21 at day 10 of lactation (lac, L) and days 2, 3, and 6 of involution (inv, I), 20 μg protein/lane. (Graph left) densitometry analysis for three independent mice, mean ± sem calculated as a percentage of the highest value for each blot, (graph right) values relative to keratin 18 calculated as a proportion of the mean (hence, no error bars are included). (f+) BLG–Cre/Stat3flox/+ (solid bars); (f−) BLG–Cre/Stat3flox/− (open bars). (B) IGFBP-5 Western ligand blot analysis showing mean and standard error of the mean of values from three or four independent mice. (Solid bars) BLG–Cre/Stat3flox/+; BLG–Cre/Stat3flox/− (open bars); (*) P <0.05 Mann Whitney U test; (graph right) values relative to keratin 18.
Similar articles
- The role of Stat3 in apoptosis and mammary gland involution. Conditional deletion of Stat3.
Chapman RS, Lourenco P, Tonner E, Flint D, Selbert S, Takeda K, Akira S, Clarke AR, Watson CJ. Chapman RS, et al. Adv Exp Med Biol. 2000;480:129-38. doi: 10.1007/0-306-46832-8_16. Adv Exp Med Biol. 2000. PMID: 10959419 Review. - p53 mediates a default programme of mammary gland involution in the absence of STAT3.
Matthews JR, Clarke AR. Matthews JR, et al. Oncogene. 2005 Apr 28;24(19):3083-90. doi: 10.1038/sj.onc.1208512. Oncogene. 2005. PMID: 15735683 - Conditional deletion of the bcl-x gene from mouse mammary epithelium results in accelerated apoptosis during involution but does not compromise cell function during lactation.
Walton KD, Wagner KU, Rucker EB 3rd, Shillingford JM, Miyoshi K, Hennighausen L. Walton KD, et al. Mech Dev. 2001 Dec;109(2):281-93. doi: 10.1016/s0925-4773(01)00549-4. Mech Dev. 2001. PMID: 11731240 - Regulation of apoptosis during mammary involution by the p53 tumor suppressor gene.
Jerry DJ, Dickinson ES, Roberts AL, Said TK. Jerry DJ, et al. J Dairy Sci. 2002 May;85(5):1103-10. doi: 10.3168/jds.S0022-0302(02)74171-4. J Dairy Sci. 2002. PMID: 12086044 Review.
Cited by
- Molecular crosstalk between MUC1 and STAT3 influences the anti-proliferative effect of Napabucasin in epithelial cancers.
Bose M, Sanders A, Handa A, Vora A, Cardona MR, Brouwer C, Mukherjee P. Bose M, et al. Sci Rep. 2024 Feb 7;14(1):3178. doi: 10.1038/s41598-024-53549-4. Sci Rep. 2024. PMID: 38326371 Free PMC article. - STAT3 activity is necessary and sufficient for the development of immune-mediated myocarditis in mice and promotes progression to dilated cardiomyopathy.
Camporeale A, Marino F, Papageorgiou A, Carai P, Fornero S, Fletcher S, Page BD, Gunning P, Forni M, Chiarle R, Morello M, Jensen O, Levi R, Heymans S, Poli V. Camporeale A, et al. EMBO Mol Med. 2013 Apr;5(4):572-90. doi: 10.1002/emmm.201201876. Epub 2013 Mar 5. EMBO Mol Med. 2013. PMID: 23460527 Free PMC article. - A single nucleotide polymorphism in the 3'-UTR of STAT3 regulates its expression and reduces risk of pancreatic cancer in a Chinese population.
Zhu B, Zhu Y, Lou J, Ke J, Zhang Y, Li J, Gong Y, Yang Y, Tian J, Peng X, Zou D, Zhong R, Gong J, Chang J, Li L, Miao X. Zhu B, et al. Oncotarget. 2016 Sep 20;7(38):62305-62311. doi: 10.18632/oncotarget.11607. Oncotarget. 2016. PMID: 27577070 Free PMC article. - PMCA2 regulates apoptosis during mammary gland involution and predicts outcome in breast cancer.
VanHouten J, Sullivan C, Bazinet C, Ryoo T, Camp R, Rimm DL, Chung G, Wysolmerski J. VanHouten J, et al. Proc Natl Acad Sci U S A. 2010 Jun 22;107(25):11405-10. doi: 10.1073/pnas.0911186107. Epub 2010 Jun 4. Proc Natl Acad Sci U S A. 2010. PMID: 20534448 Free PMC article. - Janus Kinase 1 Plays a Critical Role in Mammary Cancer Progression.
Wehde BL, Rädler PD, Shrestha H, Johnson SJ, Triplett AA, Wagner KU. Wehde BL, et al. Cell Rep. 2018 Nov 20;25(8):2192-2207.e5. doi: 10.1016/j.celrep.2018.10.063. Cell Rep. 2018. PMID: 30463015 Free PMC article.
References
- Adams JM, Cory S. The Bcl-2 protein family: Arbiters of cell survival. Science. 1998;281:1322–1326. - PubMed
- Bovolenta C, Testolin L, Benussi L, Lievens PJ, Liboi E. Positive selection of apoptosis resistant cells correlates with activation of dominant negative STAT5. J Biol Chem. 1998;273:20779–20784. - PubMed
- Catlett-Falcone R, Landowski TH, Oshiro MM, Turkson J, Levitzki A, Savino R, Ciliberto G, Moscinski L, Fer-nandez-Luna JL, Nunez G, Dalton WS, Jove R. Constitutive activation of Stat3 signaling confers resistance to apoptosis in human U266 myeloma cells. Immunity. 1999;10:105–115. - PubMed
- Chida D, Wakao H, Yoshimura A, Miyajima A. Transcriptional regulation of the beta-casein gene by cytokines: Cross-talk between STAT5 and other signaling molecules. Mol Endocrinol. 1998;12:1792–1806. - PubMed
Publication types
MeSH terms
Substances
LinkOut - more resources
Full Text Sources
Other Literature Sources
Molecular Biology Databases
Research Materials
Miscellaneous


