The analgesic effects of supraspinal mu and delta opioid receptor agonists are potentiated during persistent inflammation - PubMed (original) (raw)
The analgesic effects of supraspinal mu and delta opioid receptor agonists are potentiated during persistent inflammation
R W Hurley et al. J Neurosci. 2000.
Abstract
This study examined the antihyperalgesic and antinociceptive effects of opioid receptor agonists microinjected in the rostral ventromedial medulla (RVM) of rats 4 hr, 4 d, and 2 weeks after the induction of an inflammatory injury by injection of complete Freund's adjuvant (CFA) in one hindpaw. Nociceptive sensitivity of the ipsilateral, inflamed and the contralateral, uninflamed hindpaws was determined by the radiant-heat paw withdrawal test. The antihyperalgesic potency of the mu opioid receptor agonist [D-Ala(2),N-Me-Phe(4),Gly(5)-ol]enkephalin (DAMGO), determined for the inflamed hindpaw, was enhanced 4 d and 2 weeks after injury. The antinociceptive potency of DAMGO, determined for the contralateral, uninflamed hindpaw, was also progressively enhanced 4 hr, 4 d, and 2 weeks after injury. The magnitude of enhancement paralleled the chronicity of the injury. The greatest potentiation occurred 2 weeks after injury when the ED(50) value of DAMGO in CFA-treated rats was one-tenth that in saline-treated rats. The antihyperalgesic and antinociceptive effects of the delta opioid receptor agonist [D-Ala(2),Glu(4)]deltorphin were also increased 2 weeks after injury. These results indicate that peripheral inflammatory injury alters the pharmacology of excitatory and inhibitory inputs that modulate the activity of RVM neurons in such a manner as to enhance the effects of opioid agonists in this region. These changes have ramifications not only for the alleviation of hyperalgesia at the site of injury but also for opioid-induced antinociception at sites remote to the injury as revealed by increases in the potency of opioid agonists to suppress nociceptive responses of the contralateral, uninflamed hindpaw.
Figures
Fig. 1.
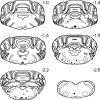
Rostrocaudal distribution of the sites in the medulla at which 0.63 μg DELT was microinjected 2 weeks after an intraplantar injection of saline. Solid and open circles represent injection sites within and outside of the RVM, respectively. Numbers to the _right_of each section refer to the distance caudal to the interaural line.4th vent; Fourth ventricle; 7, facial motor nucleus; 7g, genu of the seventh cranial nerve;7t, tract of the seventh cranial nerve;dcn, dorsal cochlear nucleus; icp, inferior cerebellar peduncle; ngc, nucleus reticularis gigantocellularis; P, pyramid; V, spinal trigeminal nuclei.
Fig. 2.
Time course of the increase in PWL produced by microinjection of either 0.003 ng (⋄), 0.03 ng (○), 0.1 ng (■), 0.3 ng (▿), 1 ng (▴), 3 ng (♦), 10 ng (●), 20 ng (▾), or 40 ng (▪) of DAMGO into the RVM of rats that received an intraplantar injection of saline (A, C) or CFA (B, D) in the left hindpaw 2 weeks earlier. The lack of effect of saline (▵, dashed line) is depicted for comparison. A and B depict the PWL of the ipsilateral hindpaw of saline- and CFA-treated rats, respectively.C and D depict the PWL of the contralateral hindpaw of saline- and CFA-treated rats, respectively.BL-1 represents the baseline PWL determined before intraplantar injection of saline or CFA. BL-2 represents the baseline PWL after the intraplantar injection of saline or CFA, and before the microinjection of DAMGO. Each symbol represents the mean ± SEM of determinations in 6–11 rats.Asterisks indicate values that are significantly different from values at the corresponding time point in rats in which saline was microinjected in the RVM: *p < 0.05, **p < 0.01.
Fig. 3.
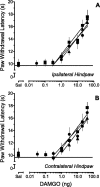
Dose–response relationships of DAMGO microinjected in the RVM of rats that received an intraplantar injection of saline in one hindpaw 4 hr (▪), 4 d (▴), or 2 weeks (●) earlier. Sal represents mean PWL determined 15 min after microinjection of saline in the RVM. Doses of DAMGO are plotted on a logarithmic scale. The potency and maximal effect of DAMGO are similar for the (A) ipsilateral and (B) contralateral hindpaw at each time point and are independent of time after intraplantar injection of saline. Doses <0.3 ng, which did not lie on the linear part of the dose–response relationship, were not included in the linear regression.Lines represent the least squares linear regression of the individual data at 15 min, the time of peak effect. Each symbol represents the mean ± SEM of determinations in six to nine rats. The horizontal line in each panel represents the average baseline PWL of rats determined after the intraplantar injection of saline and before the microinjection of DAMGO.
Fig. 4.
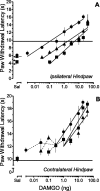
Dose–response relationships of DAMGO microinjected in the RVM of rats that received an intraplantar injection of CFA in one hindpaw 4 hr (▪), 4 d (▴), or 2 weeks (●) earlier. Doses of DAMGO are plotted on a logarithmic scale.A depicts the progressive leftward shift in the dose–response relationship for the antihyperalgesic effect of DAMGO on the ipsilateral hindpaw as a function of time after injection of CFA. The horizontal arrows indicate the mean baseline PWL for the ipsilateral hindpaw determined 4 hr, 4 d, or 2 weeks (shortest to longest arrows; also see Table 1) after the injection of CFA and before the microinjection of DAMGO. The horizontal line represents the average baseline PWL for the ipsilateral hindpaw determined before the injection of CFA. B depicts the progressive leftward shift in the dose–response relationship for the antinociceptive effect of DAMGO on the contralateral hindpaw of the same animals as a function of time. The horizontal line represents the average baseline PWL for the contralateral hindpaw determined after injection of CFA and before the microinjection of DAMGO. The_dashed lines_ that connect the lowest doses of DAMGO represent the non-dose-dependent portion of the dose–response relationship of DAMGO. In both panels, the dose-dependence was established by least squares linear regression of the individual data at 15 min, the time of peak effect. Sal represents the mean PWL determined 15 min after microinjection of saline in the RVM. Each symbol represents the mean ± SEM of determinations for 6–11 rats.
Fig. 5.
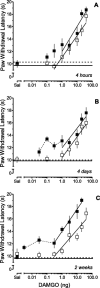
Dose–response relationships of DAMGO for the contralateral hindpaw 4 hr (A), 4 d (B), or 2 weeks (C) after intraplantar injection of saline (■) or CFA (▪). Doses of DAMGO are plotted on a logarithmic scale. Note that the dose–response relationships for the antinociceptive effects of DAMGO in the contralateral hindpaw of CFA-treated rats are shifted to the_left_ of that in the saline-treated rats. Dashed lines connect the very low doses of DAMGO and depict the non-dose-dependent portion of the dose–response relationship of DAMGO. Note that the effects of very low doses of DAMGO are greatly enhanced in the CFA-treated rats. Sal represents mean PWL determined 15 min after microinjection of saline in the RVM. The_horizontal solid_ and _dashed lines_represent the average baseline PWL of rats after the intraplantar injection of saline or CFA, respectively, and before the injection of DAMGO. Each symbol is the mean ± SEM for determinations in 6–11 rats.
Fig. 6.
Time course of the increase in PWL produced by microinjection of 0.016 μg (▴), 0.063 μg (♦), 0.16 μg (▾), 0.63 μg (●), or 1.25 μg (▪) of DELT into the RVM of rats that received an intraplantar injection of saline (A, C) or CFA (B, D) in one hindpaw 2 weeks earlier. The lack of effect of saline (▵, dashed line) is depicted for comparison. A and B depict the mean PWLs of the ipsilateral hindpaw of saline- and CFA-treated rats, respectively. C and D depict the mean PWLs of the contralateral hindpaw of saline- and CFA-treated rats, respectively. BL-1 represents the mean baseline PWL determined before intraplantar injection of saline or CFA.BL-2 represents the mean baseline PWL after the intraplantar injection of saline or CFA, and before the microinjection of DELT. Each symbol represents the mean ± SEM of determinations in 6–11 rats. Asterisks indicate values that are significantly different from values at the corresponding time point in rats in which saline was microinjected in the RVM; *p < 0.05, **p < 0.01. Note that the ordinates have been truncated at 15 sec.
Fig. 7.
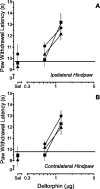
Dose–response relationships of DELT microinjected in the RVM of rats that received an intraplantar injection of saline in one hindpaw 4 hr (▪), 4 d (▴), or 2 weeks (●) earlier. The potency and maximal effect of DELT are similar for the (A) ipsilateral and (B) contralateral hindpaws at each time point and are independent of time after injection of saline. Sal represents mean PWL determined 30 min after microinjection of saline in the RVM. Each symbol represents the mean ± SEM of determinations in 6–10 rats. The horizontal line represents the average baseline PWL for that hindpaw of rats determined after the intraplantar injection of saline and before the microinjection of DELT. Note that the ordinates have been truncated at 15 sec.
Fig. 8.
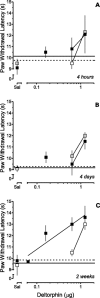
Dose–response relationships of DELT microinjected in the RVM of rats that received an intraplantar injection of CFA in one hindpaw 4 hr (▪), 4 d (▴), or 2 weeks (●) earlier.A depicts the leftward shift in the dose–response relationship for the antihyperalgesic effect of DELT on the ipsilateral hindpaw 2 weeks after the injection of CFA. The horizontal arrows indicate the mean baseline PWL for the ipsilateral hindpaw determined 4 hr, 4 d, or 2 weeks (_shortest_to longest arrows; also see Table 1) after the injection of CFA and before the microinjection of DAMGO. The horizontal line represents the average baseline PWL for the ipsilateral hindpaw determined before the injection of CFA. _B_depicts the leftward shift in the dose–response relationship for the antinociceptive effect of DELT on the contralateral hindpaw 2 weeks after the injection of CFA. The _horizontal line_represents the average baseline PWL for the contralateral hindpaw determined after injection of CFA and before the microinjection of DAMGO. In both panels, dose-dependence was established by least squares linear regression of the individual data at 30 min, the time of peak effect. Sal represents the mean PWL determined 30 min after the microinjection of saline in the RVM. Each symbol represents the mean ± SEM of determinations for 6–11 rats. Note that the ordinates have been truncated at 15 sec.
Fig. 9.
Dose–response relationships of DELT for the contralateral hindpaw 4 hr (A), 4 d (B), or 2 weeks (C) after intraplantar injection of saline (■) or CFA (▪). Note that the dose–response relationship for the antinociceptive effects of DELT in the contralateral hindpaw of CFA-treated rats is shifted to the_left_ of that in the saline-treated rats at 2 weeks. The_horizontal solid_ and _dashed lines_represent the average baseline PWL of rats after the intraplantar injection of saline or CFA, respectively, and before the injection of DELT. Note that the ordinates have been truncated at 15 sec.
Similar articles
- Mechanisms responsible for the enhanced antinociceptive effects of micro-opioid receptor agonists in the rostral ventromedial medulla of male rats with persistent inflammatory pain.
Sykes KT, White SR, Hurley RW, Mizoguchi H, Tseng LF, Hammond DL. Sykes KT, et al. J Pharmacol Exp Ther. 2007 Aug;322(2):813-21. doi: 10.1124/jpet.107.121954. Epub 2007 May 9. J Pharmacol Exp Ther. 2007. PMID: 17494863 - Contribution of endogenous enkephalins to the enhanced analgesic effects of supraspinal mu opioid receptor agonists after inflammatory injury.
Hurley RW, Hammond DL. Hurley RW, et al. J Neurosci. 2001 Apr 1;21(7):2536-45. doi: 10.1523/JNEUROSCI.21-07-02536.2001. J Neurosci. 2001. PMID: 11264327 Free PMC article. - Persistent inflammatory pain decreases the antinociceptive effects of the mu opioid receptor agonist DAMGO in the locus coeruleus of male rats.
Jongeling AC, Johns ME, Murphy AZ, Hammond DL. Jongeling AC, et al. Neuropharmacology. 2009 May-Jun;56(6-7):1017-26. doi: 10.1016/j.neuropharm.2009.02.005. Epub 2009 Mar 3. Neuropharmacology. 2009. PMID: 19265713 Free PMC article. - Inflammation-induced changes in rostral ventromedial medulla mu and kappa opioid receptor mediated antinociception.
Schepers RJ, Mahoney JL, Shippenberg TS. Schepers RJ, et al. Pain. 2008 Jun;136(3):320-330. doi: 10.1016/j.pain.2007.07.010. Epub 2007 Aug 30. Pain. 2008. PMID: 17764840
Cited by
- The delta opioid receptor tool box.
Vicente-Sanchez A, Segura L, Pradhan AA. Vicente-Sanchez A, et al. Neuroscience. 2016 Dec 3;338:145-159. doi: 10.1016/j.neuroscience.2016.06.028. Epub 2016 Jun 24. Neuroscience. 2016. PMID: 27349452 Free PMC article. Review. - Signaling cascades for δ-opioid receptor-mediated inhibition of GABA synaptic transmission and behavioral antinociception.
Zhang Z, Pan ZZ. Zhang Z, et al. Mol Pharmacol. 2012 Mar;81(3):375-83. doi: 10.1124/mol.111.076307. Epub 2011 Dec 5. Mol Pharmacol. 2012. PMID: 22144670 Free PMC article. - Peripheral inflammatory injury alters the relative abundance of Gα subunits in the dorsal horn of the spinal cord and in the rostral ventromedial medulla of male rats.
Wattiez AS, Walder RY, Sande CM, White SR, Hammond DL. Wattiez AS, et al. Mol Pain. 2017 Jan-Dec;13:1744806917715210. doi: 10.1177/1744806917715210. Mol Pain. 2017. PMID: 28604220 Free PMC article. - Pharmacological traits of delta opioid receptors: pitfalls or opportunities?
van Rijn RM, Defriel JN, Whistler JL. van Rijn RM, et al. Psychopharmacology (Berl). 2013 Jul;228(1):1-18. doi: 10.1007/s00213-013-3129-2. Epub 2013 May 7. Psychopharmacology (Berl). 2013. PMID: 23649885 Free PMC article. Review. - The NK1 receptor is essential for the full expression of noxious inhibitory controls in the mouse.
Bester H, De Felipe C, Hunt SP. Bester H, et al. J Neurosci. 2001 Feb 1;21(3):1039-46. doi: 10.1523/JNEUROSCI.21-03-01039.2001. J Neurosci. 2001. PMID: 11157089 Free PMC article.
References
- Adams JU, Tallarida RJ, Geller EB, Adler MW. Isobolographic superadditivity between delta and mu opioid agonists in the rat depends on the ratio of compounds, the mu agonist and the analgesic assay used. J Pharmacol Exp Ther. 1993;266:1261–1267. - PubMed
- Barthó L, Stein C, Herz A. Involvement of capsaicin-sensitive neurones in hyperalgesia and enhanced opioid antinociception in inflammation. Naunyn Schmiedebergs Arch Pharmacol. 1990;342:666–670. - PubMed
- Basbaum AI, Clanton CH, Fields HL. Three bulbospinal pathways from the rostral medulla of the cat: an autoradiographic study of pain modulating systems. J Comp Neurol. 1978;178:209–224. - PubMed
- Bellavance LL, Williams FG, Jacquin MF, Beitz AJ. Alteration in opioid mRNA in the parabrachial nucleus in response to peripheral noxious inflammation. Soc Neurosci Abstr. 1996;22:115.
- Berge OG, Garcia-Cabrera I, Hole K. Response latencies in the tail-flick test depend on tail skin temperature. Neurosci Lett. 1988;86:284–288. - PubMed
Publication types
MeSH terms
Substances
LinkOut - more resources
Full Text Sources
Research Materials
