Intercellular communication in spinal cord astrocytes: fine tuning between gap junctions and P2 nucleotide receptors in calcium wave propagation - PubMed (original) (raw)
Intercellular communication in spinal cord astrocytes: fine tuning between gap junctions and P2 nucleotide receptors in calcium wave propagation
E Scemes et al. J Neurosci. 2000.
Abstract
Electrophysiological properties of gap junction channels and mechanisms involved in the propagation of intercellular calcium waves were studied in cultured spinal cord astrocytes from sibling wild-type (WT) and connexin43 (Cx43) knock-out (KO) mice. Comparison of the strength of coupling between pairs of WT and Cx43 KO spinal cord astrocytes indicates that two-thirds of total coupling is attributable to channels formed by Cx43, with other connexins contributing the remaining one-third of junctional conductance. Although such a difference in junctional conductance was expected to result in the reduced diffusion of signaling molecules through the Cx43 KO spinal cord syncytium, intercellular calcium waves were found to propagate with the same velocity and amplitude and to the same number of cells as between WT astrocytes. Measurements of calcium wave propagation in the presence of purinoceptor blockers indicate that calcium waves in Cx43 KO spinal cord astrocytes are mediated primarily by extracellular diffusion of ATP; measurements of responses to purinoceptor agonists revealed that the functional P2Y receptor subtype is shifted in the Cx43 KO astrocytes, with a markedly potentiated response to ATP and UTP. Thus, the reduction in gap junctional communication in Cx43 KO astrocytes leads to an increase in autocrine communication, which is a consequence of a functional switch in the P2Y nucleotide receptor subtype. Intercellular communication via calcium waves therefore is sustained in Cx43 null mice by a finely tuned interaction between gap junction-dependent and independent mechanisms.
Figures
Fig. 1.
Strength of electrical coupling between cultured wild-type (WT) and Cx43 knock-out (KO) spinal cord astrocytes as determined by dual whole-cell recordings. Measurements of junctional conductance showed that pairs of WT spinal cord astrocytes (black bars) are weakly coupled (3.34 ± 0.94 nS;n = 43 cell pairs) and that electrical coupling is significantly lower (0.94 ± 0.42 nS; n = 50 cell pairs) in Cx43 KO astrocytes (white bars).
Fig. 2.
Voltage sensitivity of junctional conductance (_G_j) between pairs of spinal cord astrocytes from WT (A, C) and from Cx43 KO (B, D) mice. In pairs of WT spinal cord astrocytes,_G_j was insensitive to transjunctional voltages below 50 mV (V_0 = ± 60 mV), and a substantial voltage-insensitive conductance was present even at 80 mV (A, C), indicating that Cx43 is the dominant protein forming junctional channels. The steeper voltage dependence of the junctional conductance between pairs of Cx43 KO astrocytes (B) indicates that other connexins (most likely Cx40 and Cx45) contribute to junctional conductance. Different_symbols in the graphs represent data points obtained from different cell pairs.
Fig. 3.
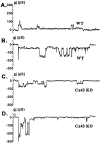
Characteristics of junctional channels between WT (A, B) and Cx43 KO (C, D) spinal cord astrocytes. The channels most frequently observed between pairs of WT astrocytes displayed unitary conductance of ∼70–90 pS (A) and showed a 30 pS substate, although 150 pS channels also were seen in 20% of the recordings (B). In pairs of Cx43 KO astrocytes the most common current fluctuations had sizes corresponding to 30–50 pS (C) without displaying measurable substates; as in WT, large conductance channels (>150 pS) also were observed in ∼20% of the cell pairs (D).
Fig. 4.
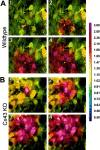
Intercellular calcium wave propagation in confluent cultures of WT (A) and Cx43 KO (B) spinal cord astrocytes. Cells were loaded with 10 μ
m
Indo-1 AM and excited at 352 nm while being imaged simultaneously at emission wavelengths of 380 and 410 nm, using a Nikon real time confocal microscope. The pseudocolor display shows a range of ratiometrically determined changes in intracellular calcium levels from resting (yellow-green) to high levels (bright red). Images_A1_–A4 and_B1_–B4 were acquired at 1 sec intervals after a single cell (marked by a white cross) was stimulated mechanically during the ratiometric confocal imaging. The pseudocolor scale for Indo-1 fluorescence ratio (from 0.5 to 3.0) is displayed at the right side of the figure.
Fig. 5.
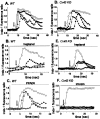
Propagation of calcium waves between cultured WT (A–C) and Cx43 KO (D–F) spinal cord astrocytes under control conditions (A, D) and in the presence of heptanol (B, E) and PPADS (C, F). Changes in the Indo-1 fluorescence ratio recorded in the mechanically stimulated cell (open squares) and in three other cells (located no further than 60 μm from the stimulated cell; closed symbols) are plotted as a function of time. Note that heptanol greatly attenuated the propagation of calcium waves between WT spinal cord astrocytes (B) and that PPADS blocked the spread of calcium signaling between Cx43 KO spinal cord astrocytes (F). Arrows indicate the time at which a cell was stimulated mechanically; the time interval between the responses of the stimulated cell and other cells was used to calculate the velocity of calcium wave propagation (see Materials and Methods).
Fig. 6.
Changes in intracellular calcium levels in fura-2 AM-loaded WT astrocytes exposed to 5 μ
m
ATP before (A) and after (B) exposure to the gap junction channel blocker heptanol and to the P2 receptor antagonist suramin (C). Note that heptanol (3 m
m
) did not attenuate the effect of ATP (compare_A_ and B), whereas suramin (100 μ
m
) greatly diminished the response (C), which was reestablished 5 min after washout (D). n = 60 cells from two independent experiments. Arrows indicate times of ATP addition.
Fig. 7.
Intracellular calcium levels measured in WT astrocytes loaded with fura-2 AM in response to increasing ATP concentrations. n = 20 cells in each panel.
Fig. 8.
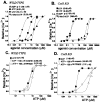
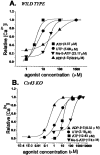
Dose–response curves obtained for P2 agonists (A, B) and for ATP in the presence of two P2 antagonists (C, D), suramin and PPADS, measured in fura-2 AM-loaded WT (A, C) and Cx43 KO (B, D) spinal cord astrocytes. The order of agonist potency (2-Me-_S_-ATP > ATP > UTP ≥ ADP-β-S) measured by the EC50 values indicates that WT spinal cord astrocytes express a P2Y1 receptor subtype (A); the order of potency ATP = UTP ≫ 2-Me-_S_-ATP ≥ ADP-β-_S_indicates that Cx43 KO spinal cord astrocytes express a P2Y2 receptor subtype (B). Note that in WT astrocytes suramin and PPADS (100 μ
m
) did not affect the EC50value obtained for ATP (C), whereas in Cx43 KO astrocytes the dose–response curve to ATP was shifted to the right (D). Each point in the graphs corresponds to the relative increment in intracellular calcium (from basal levels to maximal responses; see also Table 2) induced by increased concentrations of agonists. The results are from 60–80 cells in at least three independent experiments.
Fig. 9.
Dose–response curves obtained for P2 receptor agonists measured in fura-2 AM-loaded WT (A) and Cx43 KO (B) brain astrocytes. Based on the EC50 values obtained for ATP, UTP, 2-Me-_S_-ATP, and ADP-β-S, the order of agonist potency indicates that WT brain astrocytes express P2Y2, whereas Cx43 KO brain astrocytes express the P2Y3 receptor subtype. Each point in the graphs corresponds to the relative increment in intracellular calcium (from basal levels to maximal responses) induced by increased concentrations of agonists. The results were obtained from 60–80 cells in at least three independent experiments.
Similar articles
- Acute downregulation of Cx43 alters P2Y receptor expression levels in mouse spinal cord astrocytes.
Suadicani SO, De Pina-Benabou MH, Urban-Maldonado M, Spray DC, Scemes E. Suadicani SO, et al. Glia. 2003 Apr 15;42(2):160-71. doi: 10.1002/glia.10197. Glia. 2003. PMID: 12655600 Free PMC article. - IL-1beta differentially regulates calcium wave propagation between primary human fetal astrocytes via pathways involving P2 receptors and gap junction channels.
John GR, Scemes E, Suadicani SO, Liu JS, Charles PC, Lee SC, Spray DC, Brosnan CF. John GR, et al. Proc Natl Acad Sci U S A. 1999 Sep 28;96(20):11613-8. doi: 10.1073/pnas.96.20.11613. Proc Natl Acad Sci U S A. 1999. PMID: 10500225 Free PMC article. - ATP- and gap junction-dependent intercellular calcium signaling in osteoblastic cells.
Jorgensen NR, Geist ST, Civitelli R, Steinberg TH. Jorgensen NR, et al. J Cell Biol. 1997 Oct 20;139(2):497-506. doi: 10.1083/jcb.139.2.497. J Cell Biol. 1997. PMID: 9334351 Free PMC article. - Consequences of impaired gap junctional communication in glial cells.
Naus CC, Bani-Yaghoub M, Rushlow W, Bechberger JF. Naus CC, et al. Adv Exp Med Biol. 1999;468:373-81. doi: 10.1007/978-1-4615-4685-6_29. Adv Exp Med Biol. 1999. PMID: 10635043 Review. - [Intra- and intercellular Ca(2+)-signal transduction].
Himpens B, Vereecke J. Himpens B, et al. Verh K Acad Geneeskd Belg. 2000;62(6):501-63. Verh K Acad Geneeskd Belg. 2000. PMID: 11196579 Review. Dutch.
Cited by
- Microglial P2X4 receptors are essential for spinal neurons hyperexcitability and tactile allodynia in male and female neuropathic mice.
Gilabert D, Duveau A, Carracedo S, Linck N, Langla A, Muramatsu R, Koch-Nolte F, Rassendren F, Grutter T, Fossat P, Boué-Grabot E, Ulmann L. Gilabert D, et al. iScience. 2023 Oct 2;26(11):108110. doi: 10.1016/j.isci.2023.108110. eCollection 2023 Nov 17. iScience. 2023. PMID: 37860691 Free PMC article. - Astroglial Cell-to-Cell Interaction with Autoreactive Immune Cells in Experimental Autoimmune Encephalomyelitis Involves P2X7 Receptor, β3-Integrin, and Connexin-43.
Milicevic KD, Bataveljic DB, Bogdanovic Pristov JJ, Andjus PR, Nikolic LM. Milicevic KD, et al. Cells. 2023 Jul 5;12(13):1786. doi: 10.3390/cells12131786. Cells. 2023. PMID: 37443820 Free PMC article. - Graphene Oxide Nanosheets Reduce Astrocyte Reactivity to Inflammation and Ameliorate Experimental Autoimmune Encephalomyelitis.
Di Mauro G, Amoriello R, Lozano N, Carnasciali A, Guasti D, Becucci M, Cellot G, Kostarelos K, Ballerini C, Ballerini L. Di Mauro G, et al. ACS Nano. 2023 Feb 14;17(3):1965-1978. doi: 10.1021/acsnano.2c06609. Epub 2023 Jan 24. ACS Nano. 2023. PMID: 36692902 Free PMC article. - The Structure and Function of Glial Networks: Beyond the Neuronal Connections.
Peng HR, Zhang YK, Zhou JW. Peng HR, et al. Neurosci Bull. 2023 Mar;39(3):531-540. doi: 10.1007/s12264-022-00992-w. Epub 2022 Dec 8. Neurosci Bull. 2023. PMID: 36481974 Free PMC article. Review. - Integrating Bioelectrical Currents and Ca2+ Signaling with Biochemical Signaling in Development and Pathogenesis.
Li A, Zhou J, Widelitz RB, Chow RH, Chuong CM. Li A, et al. Bioelectricity. 2020 Sep 1;2(3):210-220. doi: 10.1089/bioe.2020.0001. Epub 2020 Sep 16. Bioelectricity. 2020. PMID: 34476353 Free PMC article. Review.
References
- Attwell D. Glia and neurons in dialogue. Nature. 1994;369:707–708. - PubMed
- Batter DK, Corpina RA, Roy C, Spray DC, Hertzberg EL, Kessler JA. Heterogeneity in gap junction expression in astrocytes cultured from different brain regions. Glia. 1992;6:213–221. - PubMed
- Beblo DA, Wang HZ, Beyer EC, Westphale EM, Veenstra RD. Unique conductance, gating, and selective permeability properties of gap junction channels formed by connexin40. Circ Res. 1995;77:813–822. - PubMed
- Blomstrand F, Aberg ND, Eriksson PS, Hansson E, Ronnback L. Extent of intercellular calcium wave propagation is related to gap junction permeability and level of connexin-43 expression in astrocytes in primary cultures from four brain regions. Neuroscience. 1999;92:255–265. - PubMed
Publication types
MeSH terms
Substances
LinkOut - more resources
Full Text Sources
Other Literature Sources
Molecular Biology Databases
Research Materials
Miscellaneous


