The Sos1 and Sos2 Ras-specific exchange factors: differences in placental expression and signaling properties - PubMed (original) (raw)
The Sos1 and Sos2 Ras-specific exchange factors: differences in placental expression and signaling properties
X Qian et al. EMBO J. 2000.
Abstract
Targeted disruption of both alleles of mouse sos1, which encodes a Ras-specific exchange factor, conferred mid-gestational embryonic lethality that was secondary to impaired placental development and was associated with very low placental ERK activity. The trophoblastic layers of sos1(-/-) embryos were poorly developed, correlating with high sos1 expression in wild-type trophoblasts. A sos1(-/-) cell line, which expressed readily detectable levels of the closely related Sos2 protein, formed complexes between Sos2, epidermal growth factor receptor (EGFR) and Shc efficiently, gave normal Ras.GTP and ERK responses when treated with EGF for < or =10 min and was transformed readily by activated Ras. However, the sos1(-/-) cells were resistant to transformation by v-Src or by overexpressed EGFR and continuous EGF treatment, unlike sos1(+/-) or wild-type cells. This correlated with Sos2 binding less efficiently than Sos1 to EGFR and Shc in cells treated with EGF for > or =90 min or to v-Src and Shc in v-Src-expressing cells, and with less ERK activity. We conclude that Sos1 participates in both short- and long-term signaling, while Sos2-dependent signals are predominantly short-term.
Figures
Fig. 1. Targeted disruption of the murine mSos1 gene in ES cells and mice. (A) Schematic representation of the mSos1 locus and targeting vector. Boxes in the wild-type allele schematics represent the exons of the mSos1 CDC25–H domain. The open boxes in the targeting vector schematics represent the pgk-neo and pgk-tk selectable markers. The position of the 3′–flanking probe used in Southern blotting is indicated. (B) Homologous recombination of the targeting vector in ES cells was verified by Southern blotting, digesting genomic DNA with _Eco_RV and hybridizing with the 3′–flanking probe. The wild-type allele produced a 14 kb band, whereas the mutant allele yielded a 6.9 kb band due to the introduction of a new _Eco_RV site in the targeting vector. (C) Genotyping of embryos arising from heterozygous crosses was performed by RT–PCR using the oligonucleotides indicated, whose sequences are given in Materials and methods. The LM87 and LM107 primers are specific for the sos1 gene and amplify a fragment of 612 bp. The LM82 primer is specific for the Neo-PGK promoter and amplifies a fragment of 410 bp with LM87.
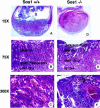
Fig. 2. Placental labyrinth defects in sos1–/– animals. The left column (A–C) displays control preparations of mouse wild-type sos1 (+/+) placental/embryo structures at DPC12 (H&E-stained) at low, medium and high magnification, respectively. The right column (D–F) shows the corresponding sos1–/– preparations at DPC12. The wild type (A) contains embryo and developed placenta, while –/– (D) shows hemorrhage (dark red areas) into the labyrinth caused by the collapse of the labyrinth structure, and a dead embryo (not visible). The wild type (B) shows the chorionic plate (pale zone at top of figure), labyrinth, prominent spongiotrophoblast layer, giant cells and decidual layers, while –/– (E) has a thinner labyrinth, and it is difficult to discern the spongiotrophoblast layer. The wild type (C) shows a normal labyrinth, with maternal erythrocytes (M), labyrinth trophoblasts (LTB) and strings of embryonic nucleated erythrocytes within embryonic blood vessels. The –/– (F) has fewer nucleated embryonic erythrocytes (arrows) within fewer embryonic blood vessels, dysplastic labyrinth trophoblasts and a multinucleated giant cell (indicated by the letter G).
Fig. 3. Sos1 and Sos2 expression in normal murine placental tissues. In situ hybridization (A) and histochemistry (B) of wild-type DPC12 placental tissues. (A) Left column: in situ hybridization with sos1 antisense (upper panel) and sense (negative control, lower panel) probes, ×50. Right column: in situ hybridization with sos2 antisense (upper panel) and sense (negative control, lower panel) probes. The results show a high sos1 mRNA signal in spongiotrophoblasts, less in labyrinth trophoblasts and none in the decidua. There was less sos2 expression. (B) Immunohistochemistry of normal placenta with Sos1- and Sos2-specific antibodies at low (a and c) and high (b and d) magnification, hematoxylin-stained. (a and b) The results show high expression of Sos1 protein within spongiotrophoblasts and less in the labyrinth. (c and d) Sos2 signal is seen in giant cell trophoblasts but not in spongiotrophoblasts and labyrinth trophoblasts. (e) Negative control of immunohistochemical staining using the same reagents except for the primary Sos1 and Sos2 antibodies (rabbit IgG).
Fig. 3. Sos1 and Sos2 expression in normal murine placental tissues. In situ hybridization (A) and histochemistry (B) of wild-type DPC12 placental tissues. (A) Left column: in situ hybridization with sos1 antisense (upper panel) and sense (negative control, lower panel) probes, ×50. Right column: in situ hybridization with sos2 antisense (upper panel) and sense (negative control, lower panel) probes. The results show a high sos1 mRNA signal in spongiotrophoblasts, less in labyrinth trophoblasts and none in the decidua. There was less sos2 expression. (B) Immunohistochemistry of normal placenta with Sos1- and Sos2-specific antibodies at low (a and c) and high (b and d) magnification, hematoxylin-stained. (a and b) The results show high expression of Sos1 protein within spongiotrophoblasts and less in the labyrinth. (c and d) Sos2 signal is seen in giant cell trophoblasts but not in spongiotrophoblasts and labyrinth trophoblasts. (e) Negative control of immunohistochemical staining using the same reagents except for the primary Sos1 and Sos2 antibodies (rabbit IgG).
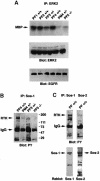
Fig. 4. Analysis of signaling events in placenta. For (A) and (B), individual E10 placentas from Sos1+/– matings were dissected and separated into fetal portion (PF) and maternal portion (PM). (A) Placental ERK activity. Anti-ERK2 immunocomplexes were assayed for kinase activity using MBP as substrate. The middle and lower panels, with the control immunoblots, indicate that the extracts contained comparable amounts of ERK2 and EGFR protein, respectively. (B) Complexes between Sos1 and phosphorylated RTKs and other tyrosine-phosphorylated proteins. Placental extracts were immunoprecipitated with Sos1-specific antibody followed by immunoblotting with anti-phosphotyrosine antibody (PY). (C) Sos1 versus Sos2 complexes with phosphorylated proteins. Extracts from the pooled fetal portions of several wild-type (+/+) E10 placentas were immunoprecipitated with anti-Sos-1 or anti-Sos2 antibodies followed by anti-PY blot. The lower part, with the reblots, shows strong Sos1 and Sos2 signals precipitated by the homologous antibody.
Fig. 5. Reconstitution of Sos1 in –/– cells restores the transforming activity of v–Src. –/– cells were transiently transfected with empty vector or a plasmid expressing mouse Sos1 followed by infection with the v–Src or v–Ras virus. The photomicrographs are from the resulting lines. (A) –/– cells transfected with Sos1, not infected with virus (negative control); (B) –/– cells transfected with empty vector and infected with v–Src virus; (C) –/– cells transfected with empty vector and infected with v–Ras virus; and (D) –/– cells transfected with Sos1 and infected with v–Src virus.
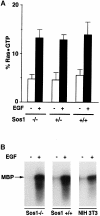
Fig. 6. Ligand-induced acute signaling in wild-type and Sos1 –/– cells. (A) EGF-dependent changes in Ras⋅GTP. Subconfluent Sos1 +/+, +/– and –/– cells were deprived of serum for 16 h, then metabolically labeled with [32P]orthophosphate for 10 h and stimulated with 10 ng/ml EGF for 5 min. Cells were then lysed and analyzed for Ras⋅GTP and Ras⋅GDP (Zhang et al., 1992). The results represent the average of three experiments. (B) Ligand-induced ERK activity. Serum-deprived cells were treated with or without ligand for 5 min as indicated. Anti-ERK2 immunocomplexes were assayed for kinase activity using MBP as substrate. Data shown are representative of two experiments.
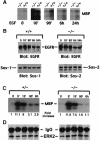
Fig. 7. Comparison of EGF-induced long-term ERK activity in Sos1 +/+ or +/– cells with Sos1-knockout cells. Sos1 +/+, +/– or –/– embryo cells were infected with virus encoding human EGFR. Cells were treated with EGF (10 ng/ml) for the time periods indicated. (A) A 100 μg aliquot of protein from Sos1 +/+ and –/– cell lysates was immunoprecipitated with anti-ERK2 antibody followed by immune complex kinase assay using MBP as a substrate. (B) Equal amounts of protein from EGF-treated Sos1 (–/–) or (+/+) embryo cells were analyzed by immunoblotting with the indicated antibody. (C) A 100 μg aliquot of protein from EGF-treated Sos1 +/– and –/– cell lysates was immunoprecipitated with anti-ERK2 antibody followed by immune complex kinase assay as in (A). The amount of radioactivity present in the phosphorylated MBP was quantitated by a phosphoimager, and the fold increase is shown underneath the figure. (D) The upper part of the gel in (C) was immunoblotted with anti-ERK2 antibody, as a loading control.
Fig. 8. EGF-induced formation of signaling complexes in Sos1 +/+, +/– and –/– cells. EGFR virus-infected cells were serum starved and treated with EGF (10 ng/ml) for the periods indicated. Equal amounts of cell lysates were immunoprecipitated with antibodies against Sos–1 or Sos–2, followed by blotting with anti-phosphotyrosine antibody (PY) or GRB2. The anti-PY blots were then reprobed with anti-Sos antibodies after stripping to serve as loading controls. Comparison of Sos–1 or Sos–2 forming a complex with activated EGFR or GRB2 in (A) Sos1 +/+ versus –/– cells, and in (B) Sos1 +/– versus –/– cells.
Fig. 9. Analysis of complex formation between Shc and Sos in Sos1 +/+, +/– and –/– cells. EGFR virus-infected cells were serum starved and treated with EGF (10 ng/ml) for the times indicated. Equal amounts of cell lysates were immunoprecipitated with polyclonal antibody against Shc followed by blotting with anti-Sos–1 or anti-Sos–2 antibodies. The lower panels used anti-Shc monoclonal antibody as loading controls. Comparison of Sos1 or Sos2 co-immunoprecipitated with Shc in (A) Sos1 +/+ versus –/– cells, and in (B) Sos1 +/– versus –/– cells.
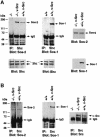
Fig. 10. Analysis of complex formation in v–Src virus-infected Sos1 +/+ and –/–cells. Sos1 +/+ and –/– cells with or without v–Src virus infection were serum starved for 16–18 h. (A) Comparison of Sos1or Sos2 co-immunoprecipitated with Shc. Equal amounts of cell lysates were immunoprecipitated with anti-Shc antibody followed by blotting with anti-Sos1 or anti-Sos2 antibodies. The lower panels used anti-Shc monoclonal antibody as loading controls. Expression of Sos2 and Sos1 in v–Src virus-infected +/+ and –/– cells was examined by immunoblotting. (B) Comparison of Sos1 or Sos2 co-immunoprecipitated with v–Src. Equal amounts of the cell extracts were immunoprecipitated with anti-Src antibody followed by blotting with anti-Sos antibodies as indicated. Lysates were immunoprecipitated and blotted with anti-Src antibody to confirm v–Src expression in the infected cells.
Similar articles
- Functional redundancy of Sos1 and Sos2 for lymphopoiesis and organismal homeostasis and survival.
Baltanás FC, Pérez-Andrés M, Ginel-Picardo A, Diaz D, Jimeno D, Liceras-Boillos P, Kortum RL, Samelson LE, Orfao A, Santos E. Baltanás FC, et al. Mol Cell Biol. 2013 Nov;33(22):4562-78. doi: 10.1128/MCB.01026-13. Epub 2013 Sep 16. Mol Cell Biol. 2013. PMID: 24043312 Free PMC article. - Differential Role of the RasGEFs Sos1 and Sos2 in Mouse Skin Homeostasis and Carcinogenesis.
Liceras-Boillos P, Jimeno D, García-Navas R, Lorenzo-Martín LF, Menacho-Marquez M, Segrelles C, Gómez C, Calzada N, Fuentes-Mateos R, Paramio JM, Bustelo XR, Baltanás FC, Santos E. Liceras-Boillos P, et al. Mol Cell Biol. 2018 Jul 30;38(16):e00049-18. doi: 10.1128/MCB.00049-18. Print 2018 Aug 15. Mol Cell Biol. 2018. PMID: 29844066 Free PMC article. - Activation of Ras-dependent signaling pathways by G(14) -coupled receptors requires the adaptor protein TPR1.
Kwan DH, Yung LY, Ye RD, Wong YH. Kwan DH, et al. J Cell Biochem. 2012 Nov;113(11):3486-97. doi: 10.1002/jcb.24225. J Cell Biochem. 2012. PMID: 22711498 - SOS GEFs in health and disease.
Baltanás FC, Zarich N, Rojas-Cabañeros JM, Santos E. Baltanás FC, et al. Biochim Biophys Acta Rev Cancer. 2020 Dec;1874(2):188445. doi: 10.1016/j.bbcan.2020.188445. Epub 2020 Oct 6. Biochim Biophys Acta Rev Cancer. 2020. PMID: 33035641 Review. - SOS2 Comes to the Fore: Differential Functionalities in Physiology and Pathology.
Baltanás FC, García-Navas R, Santos E. Baltanás FC, et al. Int J Mol Sci. 2021 Jun 21;22(12):6613. doi: 10.3390/ijms22126613. Int J Mol Sci. 2021. PMID: 34205562 Free PMC article. Review.
Cited by
- Sos1 Modulates Extracellular Matrix Synthesis, Proliferation, and Migration in Fibroblasts.
Fuentes-Calvo I, Martinez-Salgado C. Fuentes-Calvo I, et al. Front Physiol. 2021 Apr 6;12:645044. doi: 10.3389/fphys.2021.645044. eCollection 2021. Front Physiol. 2021. PMID: 33889087 Free PMC article. - Unusual interplay of two types of Ras activators, RasGRP and SOS, establishes sensitive and robust Ras activation in lymphocytes.
Roose JP, Mollenauer M, Ho M, Kurosaki T, Weiss A. Roose JP, et al. Mol Cell Biol. 2007 Apr;27(7):2732-45. doi: 10.1128/MCB.01882-06. Epub 2007 Feb 5. Mol Cell Biol. 2007. PMID: 17283063 Free PMC article. - Ras-guanine nucleotide exchange factor sos2 is dispensable for mouse growth and development.
Esteban LM, Fernández-Medarde A, López E, Yienger K, Guerrero C, Ward JM, Tessarollo L, Santos E. Esteban LM, et al. Mol Cell Biol. 2000 Sep;20(17):6410-3. doi: 10.1128/MCB.20.17.6410-6413.2000. Mol Cell Biol. 2000. PMID: 10938118 Free PMC article. - Use of transgenic mice model for understanding the placentation: towards clinical applications in human obstetrical pathologies?
Sapin V, Blanchon L, Serre AF, Lémery D, Dastugue B, Ward SJ. Sapin V, et al. Transgenic Res. 2001 Oct;10(5):377-98. doi: 10.1023/a:1012085713898. Transgenic Res. 2001. PMID: 11708649 Review. - Transcriptional repressor erf determines extraembryonic ectoderm differentiation.
Papadaki C, Alexiou M, Cecena G, Verykokakis M, Bilitou A, Cross JC, Oshima RG, Mavrothalassitis G. Papadaki C, et al. Mol Cell Biol. 2007 Jul;27(14):5201-13. doi: 10.1128/MCB.02237-06. Epub 2007 May 14. Mol Cell Biol. 2007. PMID: 17502352 Free PMC article.
References
- Basu T., Warne, P.H. and Downward, J. (1994) Role of Shc in the activation of Ras in response to epidermal growth factor and nerve growth factor. Oncogene, 9, 3483–3491. - PubMed
- Campbell S.L., Khosravi-Far, R., Rossman, K.L., Clark, G.J. and Der, C.J. (1998) Increasing complexity of Ras signaling. Oncogene, 17, 1395–1413. - PubMed
MeSH terms
Substances
LinkOut - more resources
Full Text Sources
Other Literature Sources
Molecular Biology Databases
Research Materials
Miscellaneous

