Apoptotic and growth-promoting activity of E2F modulated by MDM2 - PubMed (original) (raw)
Apoptotic and growth-promoting activity of E2F modulated by MDM2
O Loughran et al. Mol Cell Biol. 2000 Mar.
Abstract
E2F integrates and coordinates cell cycle progression with the transcription apparatus through its cyclical interactions with important regulators of cellular proliferation, such as pRb, cyclins, and cdk's. Physiological E2F is a heterodimeric transcription factor composed of an E2F and a DP family member, and while E2F proteins can stimulate proliferation, certain members of the family are known to be endowed with growth-inhibitory and tumor suppressor-like activity. We have investigated the product of the human mdm2 oncogene, hDM2, and report on its ability to regulate E2F-dependent apoptosis in a fashion that is independent of p53. hDM2 can prevent p53(-/-) cells from entering E2F-dependent apoptosis, an outcome that is dependent upon the presence of the DP subunit. Cells rescued from apoptosis possess lower levels of E2F subunits, although the rescued cells show an increase in DNA synthesis and possess enhanced viability that reflects cooperation between E2F-DP and hMD2. Furthermore, the regulation of E2F activity correlates with an hDM2-dependent effect on the intracellular distribution of DP-1, since hDM2 causes the nuclear accumulation of DP-1. The control of E2F by hDM2 therefore has certain parallels with the targeted degradation by MDM2 of p53. However, the domains in hDM2 required for the regulation of E2F activity can be distinguished from those necessary for p53 degradation, suggesting that control of E2F and p53 by hDM2 may be mechanistically distinct. These experiments define a new level of interplay between E2F and hDM2 whereby hDM2 has a profound impact on the physiological consequences of E2F activation. They suggest that the oncogenic properties of hDM2 may in part be mediated by an antiapoptotic activity that converts E2F from a negative to a positive regulator of cell cycle progression and thereby retains E2F at a level that contributes to a continual state of growth stimulation.
Figures
FIG. 1
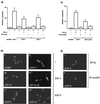
Properties of E2F responsible for apoptosis. (a) SAOS2 cells were transfected as indicated with 6 μg of E2F-1 (bar 2), 6 μg of E2F-4 (bar 3), or 6 μg of E2F-5 (bar 6) alone or with (+) 6 μg of DP3-α (bars 4 and 7) or 6 μg of DP3-αΔE (bars 5 and 8). After 6 h, the cells were washed and further grown overnight in 0.2% fetal calf serum in DMEM. Apoptosis was assayed ∼18 h after transfection, and apoptotic cells were quantitated as described in the text. The total amount of transfected DNA was made up with pcDNA3. The percentage of apoptosis is expressed relative to the total number of transfected cells, and the data shown represent the average values (+ standard deviations) from three independent experiments. (b) The intracellular distribution of the indicated E2F proteins was determined under apoptotic conditions after SAOS2 cells were transfected with 6 μg of E2F-1 (i), 6 μg of E2F-4 (ii), 6 μg of both E2F-4 and DP-3α (iii), 6 μg of both E2F-4 and DP-3αΔE (iv), 6 μg of E2F-5 (v), or 6 μg of both E2F-5 and DP-3α (vi) and treated as described. Anti-HA was used to detect E2F-1 (i), -4 (ii, iii, and iv), and -5 (v and vi). (c) SAOS2 cells were transfected with 6 μg of E2F-5 (bars 2 and 3) or 6 μg of E2F-5ΔTAD (bars 4 and 5) together with 6 μg of DP-3α (bars 2 and 4) or 6 μg of DP-3αΔDEF (bars 3 and 5) and treated as described for panel (a). (d) The intracellular distribution of the indicated proteins was determined under apoptotic conditions after SAOS2 cells were transfected with 6 μg of E2F-5 together with 6 μg of DP-3α (i) or DP-3ΔDEF (ii). The intracellular distribution of E2F-5 is shown.
FIG. 2
hDM2 overcomes E2F-dependent apoptosis in a DP subunit-dependent fashion in SAOS2 cells. (a) SAOS2 cells were transfected as indicated with 6 μg of E2F-1 (bars 3 to 6), 6 μg of DP-1 (bars 5 and 6), or 6 μg of hDM2 (bars 2, 4, and 6). After 6 h, the cells were washed and grown overnight in 0.2% fetal calf serum in DMEM. Apoptosis was assayed ∼18 h after transfection, and apoptotic cells were quantitated as described in the text. The percentage of apoptosis is expressed relative to the total number of transfected cells, and the data shown represent the average values (+ standard deviations) from three independent experiments. +, present; −, absent. (b) SAOS2 cells were transfected as indicated with 6 μg of E2F-4 (bars 3, 4, and 5) or E2F-5 (bars 6, 7, and 8) together with 6 μg of DP-3α (bars 4, 5, 7, and 8) and 6 μg of hDM2 (bars 2, 5, and 8) and treated as described for panel a. (c) The intracellular distribution of the indicated proteins was determined under apoptotic conditions after SAOS2 cells were transfected with the appropriate expression vectors encoding the indicated proteins as described in for panel a. Anti-HA was used to detect E2F-1, anti-DP-1 was used to detect DP-1, and anti-MDM2 was used to detect hDM2 (data not shown). The transfected expression vectors are indicated, and the immunostained protein is shown by white lettering. Note that iii and v, and iv and vi, show the same field stained with either anti-HA (iii and iv) or anti-DP-1 (v and vi) and that the images shown result from the same time of exposure.
FIG. 3
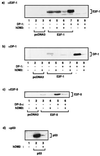
hDM2 regulates the levels of E2F and DP subunits. (a and b) SAOS2 cells were transfected as indicated with expression vectors encoding E2F-1 (12 μg; lanes 4, 5, 6, and 7) or DP-1 (12 μg; lanes 6, 7, 8, and 9) together with hDM2 (12 μg) as indicated. After 6 h, the cells were washed and further grown for ∼18 h in 0.2% fetal calf serum in DMEM. The cells were harvested and assayed for immunoblotting with anti-E2F-1 (a) or anti-HA for DP-1 (b) as described in the text. The band apparent in panel b, lane 4, results from a nonspecific reaction of the anti-HA antibody. (c) SAOS2 cells were transfected as indicated with expression vectors encoding E2F-5 (12 μg; lanes 3, 4, 5, and 6) and DP-3α (12 μg; lanes 5 and 6) together with hDM2 (12 μg; lanes 2, 4, and 6) treated as described above and were immunoblotted with anti-HA for E2F-5. (d) SAOS2 cells were transfected as indicated with expression vectors encoding p53 (12 μg; lanes 2 and 3) or hDM2 (12 μg; lane 3) treated as described above and were immunoblotted with anti-p53. For each of the experiments shown, the amount of extract loaded was determined by reference to the level of β galactosidase activity derived from pCMVβ gal (see Materials and Methods). +, present; −, absent.
FIG. 4
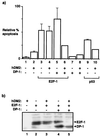
hDM2 overcomes E2F-dependent apoptosis in p53−/− MEFs. (a) p53−/− MEFs were transfected with expression vectors encoding hDM2 (6 μg; bars 3, 4, 6, 8, and 10), E2F-1 (6 μg; bars 3, 4, 5, and 6), DP-1 (6 μg; bars 7 and 8), or p53 (6 μg; bars 9 and 10) as indicated. After 6 h, the cells were washed and grown overnight in 0.2% fetal calf serum in DMEM. Apoptosis was assayed ∼18 h after transfection, and the apoptotic cells were counted. The percentage of apoptosis is expressed relative to the total number of cells counted, and the data shown (+ standard deviations) were derived from two separate experiments. (b) p53−/− MEFs were transfected as indicated with expression vectors encoding hDM2 (12 μg; lanes 1, 3, and 5), E2F-1 (12 μg; lanes 2, 3, 4, and 5), or DP-1 (12 μg; lanes 4 and 5). The cells were treated as described in the legend to Fig. 3a and immunoblotted with anti-HA for E2F-1 and DP-1; E2F-1 and DP-1 are indicated. +, present; −, absent.
FIG. 5
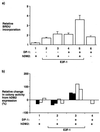
hDM2 regulation of E2F promotes DNA synthesis and confers a survival advantage. (a) SAOS2 cells were transfected as indicated with expression vectors encoding E2F-1 (6 μg; bars 2, 3, 4, and 5) or DP-1 (6 μg; bars 4, 5, and 6) together with hDM2 (6 μg; bars 1, 3, and 5). After 6 h, the cells were washed and grown for ∼18 h in 0.2% fetal calf serum in DMEM. BrdU incorporation was assayed at ∼18 h as described in the text, and immunostaining was performed in parallel to determine transfection efficiency (data not shown). The BrdU incorporation was determined relative to the transfection efficiency, and the data shown represent the average values (+ standard deviations) from three independent experiments where the BrdU incorporation is expressed relative to the control treatment of pcDNA3-transfected cells. (b) SAOS2 cells were transfected as indicated with expression vectors encoding E2F-1 (12 μg; bars 2 and 3), DP-1 (12 μg; bars 3 and 4), and hDM2 (12 μg; bars 1, 2, 3, and 4). After 6 h, the cells were washed and grown in either 0.2% (■) or 10% (□) fetal calf serum for ∼18 h, after which the cells were placed under G418 selection under normal culture conditions; each bar represents the average data from a single experiment involving duplicate treatments. The average number of colonies over three distinct experiments obtained after transfection with pcDNA3 was 588. The colonies were stained with crystal violet, and colony-forming activity is presented as the increase in colony numbers in the presence of hDM2 relative to the numbers in the absence of hDM2 in cells treated with the indicated expression vectors. +, present; −, absent.
FIG. 6
Domains in hDM2 required to regulate E2F. (a) Diagrammatic summary of wild-type hDM2 (indicating the relevant domains) and the hDM2 mutant derivatives. (b) SAOS2 cells were transfected under low-serum conditions as indicated with expression vectors encoding E2F-1 (6 μg) and DP-1 (6 μg) together with the hDM2 derivative hDM21–440, hDM2Δ222–437, or hDM2Δ59–89 (6 μg; bars 2, 3, and 4). Apoptotic cells were assayed as described in the legend to Fig. 2. The values shown indicate the percent change in apoptotic activity relative to the control treatment (cells transfected with pcDNA3) and represent the average values (+ standard deviations) from three independent experiments. The control-treated cells usually showed less than 5% apoptosis. (c) SAOS2 cells were transfected as indicated with expression vectors encoding E2F-1 (12 μg) and DP-1 (12 μg) together with the indicated hDM2 derivatives (12 μg; bars 2, 3, and 4) and treated as described (grown in 0.2% fetal calf serum) in the legend to Fig. 5b. The percent change in colony numbers was calculated as the colony activity in the presence of hDM2 relative to that in the absence of hDM2, and the data represent the average values (+ standard deviations) derived from three independent experiments. (d and e) SAOS2 cells were transfected as indicated with expression vectors encoding E2F-1 (12 μg; lanes 1 to 4) and DP-1 (12 μg; lanes 3 and 4) together with wild-type hDM2 (d) or hDM2Δ222–437 (e) (12 μg; lanes 2 and 4). The cells were harvested and assayed by immunoblotting with anti-E2F-1 or anti-HA for DP-1 as indicated. (f) SAOS2 cells were transfected as indicated with expression vectors encoding p53 (12 μg; lanes 1 and 2) together with hDM2Δ222–437 (12 μg; lane 2). The cells were harvested and assayed by immunoblotting with anti-p53 or anti-MDM2 as indicated. The amount of extract loaded was determined by reference to the level of β galactosidase activity derived from pCMVβ gal. +, present; −, absent.
FIG. 7
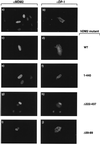
Influence of hDM2 on the intracellular distribution of DP-1. The intracellular distribution of the indicated proteins was determined under apoptotic conditions after SAOS2 cells were transfected with expression vectors encoding hDM2 (6 μg) (a), DP-1 (6 μg) (b), or both hDM2 and DP-1 (6 μg each) (c, d, e, f, g, and h). The cells were treated as described in the text with anti-DP-1 (b, d, f, g, and h) and anti-MDM2 (a, c, e, g, and i). Panels a and b show different cells, whereas panels c and d, e and f, g and h, and i and j show the same cells stained with anti-MDM2 and anti DP-1, respectively; note that the images result from different exposure times. The hDM2 mutant derivatives are indicated. Similar results were obtained with U20S cells (data not shown).
FIG. 8
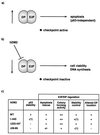
Model for regulation of E2F by hDM2. (a and b) It is envisaged that inappropriately high levels of E2F-DP activity cause the activation of a checkpoint pathway of control which thereafter leads to apoptosis (a). Since hDM2 can influence apoptosis by causing a reduction in E2F and DP subunit levels (b), it is suggested that this process may allow hDM2 to modulate checkpoint activity, limit apoptosis, and thereby facilitate cell cycle progression. The data suggest that the DP subunit is instrumental in enabling hDM2 to regulate E2F-dependent apoptosis. (c) Summary of the effects of hDM2 and mutant derivatives on E2F-DP regulation. (1), data not shown.
Similar articles
- Transcription factor E2F-1 is upregulated in response to DNA damage in a manner analogous to that of p53.
Blattner C, Sparks A, Lane D. Blattner C, et al. Mol Cell Biol. 1999 May;19(5):3704-13. doi: 10.1128/MCB.19.5.3704. Mol Cell Biol. 1999. PMID: 10207094 Free PMC article. - Functional interplay between p53 and E2F through co-activator p300.
Lee CW, Sørensen TS, Shikama N, La Thangue NB. Lee CW, et al. Oncogene. 1998 May 28;16(21):2695-710. doi: 10.1038/sj.onc.1201818. Oncogene. 1998. PMID: 9652736 - Adenovirus-mediated E2F-1 gene transfer inhibits MDM2 expression and efficiently induces apoptosis in MDM2-overexpressing tumor cells.
Yang HL, Dong YB, Elliott MJ, Liu TJ, Atienza C Jr, Stilwell A, McMasters KM. Yang HL, et al. Clin Cancer Res. 1999 Aug;5(8):2242-50. Clin Cancer Res. 1999. PMID: 10473112 - [Molecular mechanisms controlling the cell cycle: fundamental aspects and implications for oncology].
Viallard JF, Lacombe F, Belloc F, Pellegrin JL, Reiffers J. Viallard JF, et al. Cancer Radiother. 2001 Apr;5(2):109-29. doi: 10.1016/s1278-3218(01)00087-7. Cancer Radiother. 2001. PMID: 11355576 Review. French. - Balancing proliferation and apoptosis in vivo: the Goldilocks theory of E2F/DP action.
Yamasaki L. Yamasaki L. Biochim Biophys Acta. 1999 Mar 25;1423(2):M9-15. doi: 10.1016/s0304-419x(99)00003-7. Biochim Biophys Acta. 1999. PMID: 10214348 Review.
Cited by
- Activation of the Snail transcription factor induces Mdm2 gene expression.
Mabry AR, Gorman J, Delvasto JS, Lavik AR, Layer JH, Mayo LD. Mabry AR, et al. J Biol Chem. 2024 Sep 21;300(11):107811. doi: 10.1016/j.jbc.2024.107811. Online ahead of print. J Biol Chem. 2024. PMID: 39313097 Free PMC article. - MDM2 Is Essential to Maintain the Homeostasis of Epithelial Cells by Targeting p53.
Wang S, Zhong S, Huang Y, Zhu S, Chen S, Wang R, Wangmo S, Peng B, Lv H, Yang J, Ma L, Ling Z, Zhang Y, Sui P, Sun B. Wang S, et al. J Innate Immun. 2024;16(1):397-412. doi: 10.1159/000539824. Epub 2024 Aug 12. J Innate Immun. 2024. PMID: 39134014 Free PMC article. - Expanding Roles of the E2F-RB-p53 Pathway in Tumor Suppression.
Zhou Y, Nakajima R, Shirasawa M, Fikriyanti M, Zhao L, Iwanaga R, Bradford AP, Kurayoshi K, Araki K, Ohtani K. Zhou Y, et al. Biology (Basel). 2023 Dec 11;12(12):1511. doi: 10.3390/biology12121511. Biology (Basel). 2023. PMID: 38132337 Free PMC article. Review. - MDM2- an indispensable player in tumorigenesis.
Zafar A, Khan MJ, Naeem A. Zafar A, et al. Mol Biol Rep. 2023 Aug;50(8):6871-6883. doi: 10.1007/s11033-023-08512-3. Epub 2023 Jun 14. Mol Biol Rep. 2023. PMID: 37314603 Free PMC article. Review. - MDM2's dual mRNA binding domains co-ordinate its oncogenic and tumour suppressor activities.
Gnanasundram SV, Malbert-Colas L, Chen S, Fusée L, Daskalogianni C, Muller P, Salomao N, Fåhraeus R. Gnanasundram SV, et al. Nucleic Acids Res. 2020 Jul 9;48(12):6775-6787. doi: 10.1093/nar/gkaa431. Nucleic Acids Res. 2020. PMID: 32453417 Free PMC article.
References
- Allen E K, de la Luna S, Kerkhoven R M, Bernards R, La Thangue N B. Distinct mechanisms of nuclear accumulation regulate the functional consequence of E2F transcription factors. J Cell Sci. 1997;110:2819–2831. - PubMed
- Baker S J, Markowitz S, Fearson E R, Willson J K U, Vogelstein B. Suppression of human colorectal-carcinoma cell-growth by wild type p53. Science. 1990;249:912–915. - PubMed
- Bandara L R, Girling R, La Thangue N B. Apoptosis induced in mammalian cells by small peptides that functionally antagonize the Rb-regulated E2F transcription factor. Nat Biotechnol. 1997;15:896–901. - PubMed
- Beijersbergen R L, Kerkoven R M, Zhu L, Carlee L, Voorhoeve P M, Bernards R. E2F4, a new member of the E2F gene family, has oncogenic activity and associates with p107 in vivo. Genes Dev. 1994;8:2680–2690. - PubMed
Publication types
MeSH terms
Substances
LinkOut - more resources
Full Text Sources
Research Materials
Miscellaneous
