Selective interaction between leptin and insulin signaling pathways in a hepatic cell line - PubMed (original) (raw)
Selective interaction between leptin and insulin signaling pathways in a hepatic cell line
I Szanto et al. Proc Natl Acad Sci U S A. 2000.
Abstract
Leptin is a 16-kDa hormone secreted by adipocytes and plays an important role in control of feeding behavior and energy expenditure. In obesity, circulating levels of leptin and insulin are high because of the presence of increased body fat mass and insulin resistance. Recent reports have suggested that leptin can act through some of the components of the insulin signaling cascade, such as insulin receptor substrates (IRS-1 and IRS-2), phosphatidylinositol 3-kinase (PI 3-kinase), and mitogen-activated protein kinase, and can modify insulin-induced changes in gene expression in vitro and in vivo. Well differentiated hepatoma cells (Fao) possess both the long and short forms of the leptin receptor and respond to leptin with a stimulation of c-fos gene expression. In Fao cells, leptin alone had no effects on the insulin signaling pathway, but leptin pretreatment transiently enhanced insulin-induced tyrosine phosphorylation and PI 3-kinase binding to IRS-1, while producing an inhibition of tyrosine phosphorylation and PI 3-kinase binding to IRS-2. Leptin alone also induced serine phosphorylation of Akt and glycogen synthase kinase 3 but to a lesser extent than insulin, and the combination of these hormones was not additive. These results suggest complex interactions between the leptin and insulin signaling pathways that can potentially lead to differential modification of the metabolic and mitotic effects of insulin exerted through IRS-1 and IRS-2 and the downstream kinases that they activate.
Figures
Figure 1
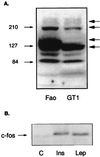
(A) Different isoforms of OB-R are present in Fao cells. Lysates from Fao hepatoma cells and the choroid plexus cell line GT1 were separated on a 7.5% polyacrylamide gel and blotted with antibody raised against amino acids 32–51 in the extracellular domain of the OB-R. Several bands representing both the long and the short isoforms were detected. The long form migrates as a major band just below the 210-kDa marker, whereas a strong band in the 100- to 120-kDa area represents the short forms. The bands migrating at the 60- to 85-kDa range were not analyzed further and represent degradation products. The specificity for antibody recognition of all of these bands was confirmed by a peptide competition assay. (B) c-fos gene induction by insulin and leptin in Fao hepatoma cells. Fao cells were serum starved overnight and then stimulated with 100 nM insulin (Ins) or 60 nM leptin (Lep) for 30 min (C, control). Total RNA was isolated from control and treated cells, and Northern blotting was performed with _c-fos_-specific probe as described in Experimental Procedures. Both leptin and insulin were able to induce c-fos expression, proving the signaling capacity of the OB-R in Fao cells.
Figure 2
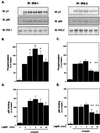
Effect of leptin on insulin-induced IRS-1 and IRS-2 phosphorylation and p85 association. Fao cells were incubated with 60 nM leptin for the times indicated and then stimulated with 100 nM insulin for 1 min. (A) Western blots of anti-IRS-1 and anti-IRS-2 immunoprecipitates (IP) with anti-phosphotyrosine antibody (pY), anti-p85 antibody, or anti-IRS-1 or IRS-2 antibodies (IB, immunoblotting). (B and C) Quantitation of the blots measuring the phosphorylation of the IRS proteins. (D and E) Quantitation of the blots for p85 binding associated with the IRS proteins. The data in B–E represent the means of three to six independent experiments. Equal loading of proteins was verified by reblotting with the respective IRS antibodies. Statistical significance was analyzed by Student's t test: *, P < 0.05; **, P < 0.01.
Figure 3
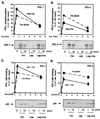
Leptin has opposite effect on the dynamics of insulin-induced tyrosine phosphorylation of IRS-1 and IRS-2. Cells were serum-starved overnight then treated with or without leptin (Lep; 60 nM) for 10 min, followed by a stimulation with 100 nM insulin (Ins) for 1 or 10 min. IRS protein phosphorylation and p85 binding were assessed as described for Fig. 2. The graphs represent the means of three to eight experiments. A representative blot is shown below each graph.
Figure 4
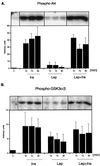
Leptin (Lep) induces Akt and GSK3 phosphorylation but does not alter insulin-induced phosphorylation of the proteins. Cells were stimulated with 100 nM insulin (Ins), 60 nM leptin, or a combination of the two for the times indicated. Cells were lysed; the proteins were separated on SDS/12% PAGE and blotted with phosphoserine-specific Akt and GSK3 antibodies. Insulin and, to a lesser extent, leptin caused an increase in the phosphorylation of both proteins; the effect of the combination of the two hormones was identical of that of insulin alone. A representative Western blot of each is shown. The bar graphs represent the means of two or three independent experiments.
Similar articles
- Effects of streptozocin diabetes and diabetes treatment by islet transplantation on in vivo insulin signaling in rat heart.
Laviola L, Belsanti G, Davalli AM, Napoli R, Perrini S, Weir GC, Giorgino R, Giorgino F. Laviola L, et al. Diabetes. 2001 Dec;50(12):2709-20. doi: 10.2337/diabetes.50.12.2709. Diabetes. 2001. PMID: 11723053 - Insulin resistance with enhanced insulin signaling in high-salt diet-fed rats.
Ogihara T, Asano T, Ando K, Chiba Y, Sekine N, Sakoda H, Anai M, Onishi Y, Fujishiro M, Ono H, Shojima N, Inukai K, Fukushima Y, Kikuchi M, Fujita T. Ogihara T, et al. Diabetes. 2001 Mar;50(3):573-83. doi: 10.2337/diabetes.50.3.573. Diabetes. 2001. PMID: 11246877 - A phosphatidylinositol 3-kinase/Akt/mTOR pathway mediates and PTEN antagonizes tumor necrosis factor inhibition of insulin signaling through insulin receptor substrate-1.
Ozes ON, Akca H, Mayo LD, Gustin JA, Maehama T, Dixon JE, Donner DB. Ozes ON, et al. Proc Natl Acad Sci U S A. 2001 Apr 10;98(8):4640-5. doi: 10.1073/pnas.051042298. Epub 2001 Apr 3. Proc Natl Acad Sci U S A. 2001. PMID: 11287630 Free PMC article. - Insulin signalling.
Bevan P. Bevan P. J Cell Sci. 2001 Apr;114(Pt 8):1429-30. doi: 10.1242/jcs.114.8.1429. J Cell Sci. 2001. PMID: 11282018 Review. No abstract available. - The Croonian Lecture 1998. Identification of a protein kinase cascade of major importance in insulin signal transduction.
Cohen P. Cohen P. Philos Trans R Soc Lond B Biol Sci. 1999 Feb 28;354(1382):485-95. doi: 10.1098/rstb.1999.0399. Philos Trans R Soc Lond B Biol Sci. 1999. PMID: 10212493 Free PMC article. Review.
Cited by
- Disruption of hepatic leptin signaling protects mice from age- and diet-related glucose intolerance.
Huynh FK, Levi J, Denroche HC, Gray SL, Voshol PJ, Neumann UH, Speck M, Chua SC, Covey SD, Kieffer TJ. Huynh FK, et al. Diabetes. 2010 Dec;59(12):3032-40. doi: 10.2337/db10-0074. Epub 2010 Sep 28. Diabetes. 2010. PMID: 20876720 Free PMC article. - Thyroid Abnormalities in Patients With Extreme Insulin Resistance Syndromes.
Kushchayeva YS, Kushchayev SV, Startzell M, Cochran E, Auh S, Dai Y, Lightbourne M, Skarulis M, Brown RJ. Kushchayeva YS, et al. J Clin Endocrinol Metab. 2019 Jun 1;104(6):2216-2228. doi: 10.1210/jc.2018-02289. J Clin Endocrinol Metab. 2019. PMID: 30657911 Free PMC article. - Central leptin gene therapy ameliorates diabetes type 1 and 2 through two independent hypothalamic relays; a benefit beyond weight and appetite regulation.
Kalra SP. Kalra SP. Peptides. 2009 Oct;30(10):1957-63. doi: 10.1016/j.peptides.2009.07.021. Epub 2009 Aug 6. Peptides. 2009. PMID: 19647774 Free PMC article. Review. - Sam68 Mediates the Activation of Insulin and Leptin Signalling in Breast Cancer Cells.
Pérez-Pérez A, Sánchez-Jiménez F, Vilariño-García T, de la Cruz L, Virizuela JA, Sánchez-Margalet V. Pérez-Pérez A, et al. PLoS One. 2016 Jul 14;11(7):e0158218. doi: 10.1371/journal.pone.0158218. eCollection 2016. PLoS One. 2016. PMID: 27415018 Free PMC article. - Metreleptin improves blood glucose in patients with insulin receptor mutations.
Brown RJ, Cochran E, Gorden P. Brown RJ, et al. J Clin Endocrinol Metab. 2013 Nov;98(11):E1749-56. doi: 10.1210/jc.2013-2317. Epub 2013 Aug 22. J Clin Endocrinol Metab. 2013. PMID: 23969187 Free PMC article. Clinical Trial.
References
- Zhang Y, Proenca R, Maffei M, Barone M, Leopold L, Friedman J M. Nature (London) 1994;372:425–432. - PubMed
- Friedman J M, Halaas J L. Nature (London) 1998;395:763–770. - PubMed
- Jequier E, Tappy L. Physiol Rev. 1999;79:451–480. - PubMed
- Lee G H, Proenca R, Montez J M, Carroll K M, Darvishzadeh J G, Lee J I, Friedman J M. Nature (London) 1996;379:632–635. - PubMed
Publication types
MeSH terms
Substances
LinkOut - more resources
Full Text Sources
Other Literature Sources
Medical
Molecular Biology Databases
Research Materials
Miscellaneous


