Familial dyserythropoietic anaemia and thrombocytopenia due to an inherited mutation in GATA1 - PubMed (original) (raw)
Case Reports
Familial dyserythropoietic anaemia and thrombocytopenia due to an inherited mutation in GATA1
K E Nichols et al. Nat Genet. 2000 Mar.
Abstract
Haematopoietic development is regulated by nuclear protein complexes that coordinate lineage-specific patterns of gene expression. Targeted mutagenesis in embryonic stem cells and mice has revealed roles for the X-linked gene Gata1 in erythrocyte and megakaryocyte differentiation. GATA-1 is the founding member of a family of DNA-binding proteins that recognize the motif WGATAR through a conserved multifunctional domain consisting of two C4-type zinc fingers. Here we describe a family with X-linked dyserythropoietic anaemia and thrombocytopenia due to a substitution of methionine for valine at amino acid 205 of GATA-1. This highly conserved valine is necessary for interaction of the amino-terminal zinc finger of GATA-1 with its essential cofactor, FOG-1 (for friend of GATA-1; refs 9-12). We show that the V205M mutation abrogates the interaction between Gata-1 and Fog-1, inhibiting the ability of Gata-1 to rescue erythroid differentiation in an erythroid cell line deficient for Gata-1 (G1E). Our findings underscore the importance of FOG-1:Gata-1 associations in both megakaryocyte and erythroid development, and suggest that other X-linked anaemias or thrombocytopenias may be caused by defects in GATA1.
Figures
Fig. 1
Peripheral blood and bone marrow abnormalities in patients II-1 and II-2. a, Peripheral blood smear. Note the severe deficiency of platelets and heterogeneity in red blood cell size (poikilocytosis) and shape (anisocytosis). An abnormal red blood cell with a bilobed nucleus is indicated (arrow). Original magnification ×50. b, Bone marrow core biopsy. Megakaryocytes, distinguished by their pale pink cytoplasm, are abundant and abnormally small. Representative megakaryocytes are indicated (arrows). Original magnification ×10. c, Bone marrow aspirate showing a cluster of developing erythroid precursors. Dyserythropoiesis is illustrated by the large, multinuclear erythroblast (centre). Original magnification ×100. d, Bone marrow core biopsy. Megakaryocytes (m) are dysplastic with small ecentric nuclei. Original magnification ×50.
Fig. 2
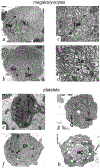
Ultrastructural abnormalities in megakaryocytes and platelets revealed by electron microscopy. a, Low-power micrograph of a normal megakaryocyte. Note the centrally located nucleus (Nu) and the well-developed demarcation membrane system (DM). Original magnification ×2,880. b, Megakaryocyte from affected patient showing showing abnormal features that include an abundance of smooth endoplasmic reticulum (Ser), ecentric nucleus and a relative paucity of granules. Original magnification ×2,880. c, High-power micrograph of a normal megakaryocyte showing well-organized membrane demarcation system. Original magnification ×20,000. d, High-power micrograph of mutant megakaryocyte showing abnormal abundance of smooth endoplasmic reticulum (Ser). The membrane demarcation system is poorly developed. Original magnification ×20,000. e, Platelet from normal individual. Note the abundance of a-granules (G). Original magnification ×20,000. f,g,h, Circulating platelets from affected patients. Note the paucity of granules (G), abundance of smooth endoplasmic reticulum (Ser) and abnormal membranous complexes (MC). Original magnification ×20,000.
Fig. 3
Mutational analysis of GATA1 in the affected pedigree. a, Partial pedigree of the affected kindred and DNA sequence analysis of GATA1. Patients with severe manifestations are represented by filled symbols, and patients with milder symptoms by half-filled symbols. Genotypes are shown below the pedigree members (other family members were not tested). b, Amino acid alignment of the N-terminal zinc finger of GATA-1 protein from various species and the Drosophila GATA-A protein. Amino acids known to interact with FOG-1 are labelled with black dots. The V205M mutation is indicated. c, Three-dimensional structure of the N-terminal zinc finger. Amino acids presumed to interact with DNA are shown in red. Valine 205 is indicated in yellow. Other FOG-1–interacting residues are shown in green.
Fig. 4
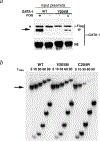
Biochemical characterization of mutant V205M Gata-1. a, The V205M mutation impairs binding of Gata-1 to Fog-1. Wild-type or V205M Gata-1 cDNAs were transfected into COS cells along with a FLAG-tagged version of Fog-1 consisting of zinc fingers 5 and 6. Gata-1 bound to Fog-1 was detected by immunoprecipitation with anti-FLAG antibody (α-FLAG IP) followed by western-blot analysis with anti-Gata-1 antibody (top). Gata-1 is indicated (arrow). The upper band (asterisk) corresponds to the IgG heavy chain of the anti-FLAG antibody. Total Gata-1 was determined by western-blot analysis of nuclear extracts from the transfected cells (NE, bottom). Equivalent amounts of FLAG-tagged Fog-1 were immunoprecipitated in Zfpm1 cDNA-transfected samples as determined by western blot with anti-FLAG antibody (data not shown). b, V205M Gata-1 binds DNA normally. The stability of Gata-1–DNA interactions was measured by a dissociation gel shift assay. Labelled probe bound to Gata-1 (arrow) migrates more slowly than free probe seen in the lower portion of the panel. V205M and wild-type (WT) Gata-1 dissociate from the labelled probe at similar rates. In contrast, the C204R mutation, which disrupts the N-terminal zinc finger, increases the dissociation rate between Gata-1 and bound DNA probe.
Fig. 5
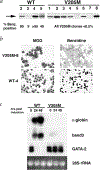
Impaired function of V205M mutant Gata-1 in erythroid cells. a, Plasmids encoding oestrogen-inducible forms of wild-type (WT) or V205M Gata-1 were introduced into the Gata-1–null erythroid line G1E. Nuclear extracts from stably expressing clones were analysed by western blot for Gata-1 expression (arrow). Cells were treated with β-oestradiol for 72 h and erythroid maturation was determined by benzidine staining, which detects haemoglobin. Note that V205M/Gata-1 fails to induce differentiation in eight independent clones. b, Representative data from clones V205M-8 and WT-4. May Grunwald-Giemsa (MGG) and benzidine staining after 72 h of β-oestradiol treatment. c, Northern-blot analysis of clones V205M-8 and WT-4 after treatment with β-oestradiol for the indicated times. WT-4 exhibits mRNA changes that are characteristic of erythroid maturation, including induction of α-globin and band 3, and concommitant downregulation of Gata-2. No changes in gene expression are seen in V205M-8 cells after β-oestradiol treatment. Each lane represents 15 μg of total RNA.
Similar articles
- Dyserythropoietic anemia and thrombocytopenia due to a novel mutation in GATA-1.
Del Vecchio GC, Giordani L, De Santis A, De Mattia D. Del Vecchio GC, et al. Acta Haematol. 2005;114(2):113-6. doi: 10.1159/000086586. Acta Haematol. 2005. PMID: 16103636 - X-linked thrombocytopenia caused by a novel mutation of GATA-1.
Mehaffey MG, Newton AL, Gandhi MJ, Crossley M, Drachman JG. Mehaffey MG, et al. Blood. 2001 Nov 1;98(9):2681-8. doi: 10.1182/blood.v98.9.2681. Blood. 2001. PMID: 11675338 - GATA-1: friends, brothers, and coworkers.
Morceau F, Schnekenburger M, Dicato M, Diederich M. Morceau F, et al. Ann N Y Acad Sci. 2004 Dec;1030:537-54. doi: 10.1196/annals.1329.064. Ann N Y Acad Sci. 2004. PMID: 15659837 Review. - Transcription factor GATA-1 and erythroid development.
Simon MC. Simon MC. Proc Soc Exp Biol Med. 1993 Feb;202(2):115-21. doi: 10.3181/00379727-202-43519a. Proc Soc Exp Biol Med. 1993. PMID: 8424101 Review.
Cited by
- Mechanism of ASF1 Inhibition by CDAN1.
Sedor SF, Shao S. Sedor SF, et al. bioRxiv [Preprint]. 2024 Aug 8:2024.08.08.607204. doi: 10.1101/2024.08.08.607204. bioRxiv. 2024. PMID: 39149339 Free PMC article. Preprint. - GATA1 in Normal and Pathologic Megakaryopoiesis and Platelet Development.
Takasaki K, Chou ST. Takasaki K, et al. Adv Exp Med Biol. 2024;1459:261-287. doi: 10.1007/978-3-031-62731-6_12. Adv Exp Med Biol. 2024. PMID: 39017848 Review. - Endogenous small molecule effectors in GATA transcription factor mechanisms governing biological and pathological processes.
Liao R, Bresnick EH. Liao R, et al. Exp Hematol. 2024 Sep;137:104252. doi: 10.1016/j.exphem.2024.104252. Epub 2024 Jun 12. Exp Hematol. 2024. PMID: 38876253 Review. - Unfriendly protein of GATA1 and mechanisms of bone marrow failure.
Dror Y. Dror Y. Haematologica. 2024 Sep 1;109(9):2761-2763. doi: 10.3324/haematol.2024.285041. Haematologica. 2024. PMID: 38618686 Free PMC article. No abstract available. - Enhancement of PRMT6 binding to a novel germline GATA1 mutation associated with congenital anemia.
Lu Y, Zhu Q, Wang Y, Luo M, Huang J, Liang Q, Huang L, Ouyang J, Li C, Tang N, Li Y, Kang T, Song Y, Xu X, Ye L, Zheng G, Chen C, Zhu C. Lu Y, et al. Haematologica. 2024 Sep 1;109(9):2955-2968. doi: 10.3324/haematol.2023.284183. Haematologica. 2024. PMID: 38385251 Free PMC article.
References
- Pevny L et al. Erythroid differentiation in chimaeric mice blocked by a targeted mutation in the gene for transcription factor GATA-1. Nature 349, 257–260 (1991). - PubMed
- Weiss MJ, Keller G & Orkin SH Novel insights into erythroid development revealed through in vitro differentiation of GATA-1− embryonic stem cells. Genes Dev. 8, 1184–1197 (1994). - PubMed
- Tsai SF et al. Cloning of cDNA for the major DNA-binding protein of the erythroid lineage through expression in mammalian cells. Nature 339, 446–451 (1989). - PubMed
Publication types
MeSH terms
Substances
Grants and funding
- R21 HL078941/HL/NHLBI NIH HHS/United States
- R01 CA78545/CA/NCI NIH HHS/United States
- R01 CA078545/CA/NCI NIH HHS/United States
- HL40387/HL/NHLBI NIH HHS/United States
- AI K11AI01331-05/AI/NIAID NIH HHS/United States
- P01 HL040387/HL/NHLBI NIH HHS/United States
LinkOut - more resources
Full Text Sources
Molecular Biology Databases
Miscellaneous


