Signal transduction by CXC chemokine receptor 4. Stromal cell-derived factor 1 stimulates prolonged protein kinase B and extracellular signal-regulated kinase 2 activation in T lymphocytes - PubMed (original) (raw)
Signal transduction by CXC chemokine receptor 4. Stromal cell-derived factor 1 stimulates prolonged protein kinase B and extracellular signal-regulated kinase 2 activation in T lymphocytes
B Tilton et al. J Exp Med. 2000.
Abstract
We report that stromal cell-derived factor (SDF)-1 has the remarkable capacity to induce sustained signaling through CXC chemokine receptor 4 (CXCR4). In contrast to other chemokines, such as monocyte chemotactic protein 1 (CC chemokine receptor 2 [CCR2]), macrophage inflammatory protein 1beta (CCR5), liver and activation-regulated chemokine (LARC [CCR6]), Epstein-Barr virus-induced molecule 1 ligand chemokine (ELC [CCR7]), and IP10 (CXCR3), SDF-1 stimulates the prolonged activation of protein kinase B and extracellular signal-regulated kinase (ERK)-2. Activation of protein kinase B is reversed by displacement of SDF-1 from CXCR4 or inhibition of phosphatidylinositol 3-kinase. Although increasing concentrations of SDF-1 enhance CXCR4 internalization, kinase activation is prolonged. In addition, restimulation yields >60% of initial protein kinase B activity, indicating that the remaining receptors are not desensitized. Furthermore, activation is prolonged by inhibiting SDF-1 degradation. The sustained activation of cell survival and mitogenic pathways may account for the unique role of SDF-1 and CXCR4 in embryogenesis and lymphopoiesis.
Figures
Figure 1
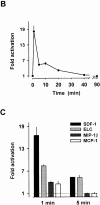
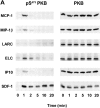
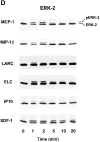
Chemokine-stimulated activation of protein kinase B and ERK-2 in T cells. (A) Activation of protein kinase B determined by Western blot analysis. T cells were stimulated with 200 nM MCP-1, MIP-1β, LARC, ELC, IP10, or SDF-1 for the indicated times. Whole cell lysates were separated on SDS-PAGE and activated protein kinase B was detected with an antibody reacting with phosphorylated Ser473 (pS47 3PKB, left). To confirm equal loading of protein kinase B, blots reprobed with an antibody reacting with both activated and nonactivated protein kinase B (PKB, right). (B) Time course of protein kinase B activation. Enzyme activity was determined in immunoprecipitates from lysates of cells stimulated with 100 nM SDF-1. Kinase assays were performed in duplicate, and the results are presented as fold activation (mean values). (C) Comparison of protein kinase B activity in immunoprecipitates from cells stimulated for 1 or 5 min with 100 nM SDF-1, ELC, MCP-1, or MIP-1β. (D) Western blot analysis of ERK-2 activation. Cells were stimulated with 200 nM MCP-1, MIP-1β, LARC, ELC, IP10, or SDF-1 for the indicated times and whole cells lysates were separated by SDS-PAGE. Activated ERK-2 (pERK-2) migrates with a slower electrophoretic mobility than nonactivated ERK-2 (ERK-2). Representative results obtained with cells from single donors are shown. Independent experiments with at least four more batches of cells from different donors gave similar results.
Figure 4
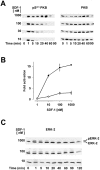
SDF-1 concentration dependence of prolonged protein kinase B and ERK-2 activation. (A) Western blot analysis of protein kinase B. T cells were stimulated with 10, 30, 100 nM or 1 μM SDF-1 for the indicated times. Activated (pSer473 PKB) and total protein kinase B (PKB) were determined as in the legend to Fig. 1 A. (B) Protein kinase B activity in immunoprecipitates from lysates of cells stimulated with the indicated concentrations of SDF-1 for either 1 min (•) or 20 min (○). Results are expressed as fold activation. (C) Western blot analysis of ERK-2. T cells were stimulated with 10, 100 nM and 1 μM SDF-1 for the indicated times. Activated ERK-2 (pERK-2) corresponds to the band with retarded electrophoretic mobility. Results are representative for at least three independent determinations.
Figure 2
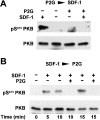
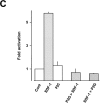
Effect of the CXCR4 antagonist, SDF-1P2G, on SDF-1–induced protein kinase B activation. (A) T cells were pretreated with 10 μM SDF-1P2G (P2G) or medium for 5 min and stimulated with 100 nM SDF-1 for 10 min. (B) The cells were stimulated with 100 nM SDF-1 for 5, 10, or 15 min. Where indicated, 10 μM SDF-1P2G (P2G) was added 5 min before termination of the stimulation. Activated (pSer47 3PKB) and total protein kinase B(PKB) were determined as in the legend to Fig. 1 A. (C) Protein kinase B activity in immunoprecipitates. The cells were either treated with medium (Cont), 100 nM SDF-1 (SDF-1), or 10 μM SDF-1P2G (P2G) for 10 min, or treated with 10 μM SDF-1P2G for 5 min before stimulation with 100 nM SDF-1 for 10 min (P2G > SDF-1), or were stimulated with 100 nM SDF-1 and 5 min later treated with 10 μM SDF-1P2G for an additional 5 min (SDF-1 > P2G). Results are expressed as in Fig. 1 C. Similar results were obtained with cells from three different donors.
Figure 3
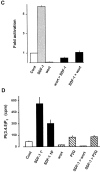
Effect of wortmannin on SDF-1–induced protein kinase B activation and PIP3 production. (A) T cells were pretreated with 100 nM wortmannin for 10 min and stimulated with 100 nM SDF-1 for 10 min. (B) The cells were stimulated with 100 nM SDF-1 for 1, 5, 10, and 15 min. Where indicated, 100 nM wortmannin was added 5 min before termination of the stimulation. Activated (pSer473PKB) and total protein kinase B (PKB) were determined as in the legend to Fig. 1 A. (C) Protein kinase B activity in immunoprecipitates. The cells were either treated with medium (Cont), 100 nM SDF-1 (SDF-1), or 100 nM wortmannin (wort) for 10 min, or were treated with 100 nM wortmannin for 10 min before stimulation with 100 nM SDF-1 for 10 min (wort > SDF-1), or were stimulated with 100 nM SDF-1 and 5 min later treated with 100 nM wortmannin for an additional 5 min (SDF-1 > wort). Results are expressed as in Fig. 1 C. D. PIP3 formation in [32P]orthophosphate-loaded T cells. The cells were either treated with medium (Cont), 100 nM SDF-1 (SDF-1 10′), 100 nM wortmannin (wort), 10 µM SDF-1P2G (P2G) for 10 min or with 100 nM SDF-1 for 1 min (SDF-1 1′), or were stimulated with 100 nM SDF-1 and 5 min later treated with 100 nM wortmannin (SDF-1 > wort) or 10 μM SDF-1P2G (SDF-1 > P2G) for an additional 5 min. Lipids were extracted, deacylated, and glycerophosphoinositides were separated by HPLC (duplicate determinations). Results are representative for at least three independent experiments.
Figure 5
Downregulation of CXCR4 by SDF-1. PBMCs were incubated in RPMI supplemented with 10% FCS without (control, 100% expression) or with increasing concentrations of SDF-1 for the times indicated. Surface-expressed CXCR4 was detected with mAb 6H8 stained with PE-conjugated goat anti–mouse IgG using a FACScan™ flow cytometer. The percentage of CXCR4 surface expression was calculated from the relative fluorescence intensity (see Materials and Methods). The results shown are representative for four experiments obtained with cells from different donors.
Figure 6
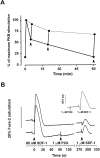
Restimulation of CXCR4 with SDF-1. (A) Protein kinase B activation. T cells were stimulated with 100 nM SDF-1 for the indicated times (points connected by solid line). In parallel samples, a second addition of 100 nM SDF-1 was made at 5, 20, or 60 min of stimulation (arrowheads), and the incubation continued for 1 min (points connected by thin line). The cells were lysed, and protein kinase B activity was measured in immunoprecipitates. Maximum protein kinase B activity obtained at 1 min of stimulation was set as 100%. (B) Changes in intracellular free calcium. Fluorescence of Fura-2–loaded T cells was recorded for 6 min in parallel samples. At time 0 the cells were stimulated with 80 nM SDF-1. Where indicated, 1 μM SDF-1P2G (P2G) was added 90 s later to one sample (bottom trace), and at ∼280 s a second addition of 1 μM SDF-1 (SDF-1) was made to both samples. (Inset) 1 μM SDF-1P2G (P2G) does not desensitize the response to 1 μM SDF-1 (SDF-1). Results are representative for at least three independent experiments performed in duplicate with cells from different donors.
Figure 7
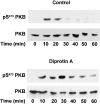
Inhibition of CD26/DPPIV (dipeptidyl dipeptidase IV) prolongs SDF-1 stimulated protein kinase B activation. T cells were incubated with 30 nM SDF-1 in the absence (Control) or presence of 4 mM of the CD26/DPPIV inhibitor diprotin A for the indicated times. Activated (pSer473PKB) and total protein kinase B (PKB) were determined by Western blot analysis as in the legend to Fig. 1 A.
Similar articles
- The CXC chemokine stromal cell-derived factor activates a Gi-coupled phosphoinositide 3-kinase in T lymphocytes.
Sotsios Y, Whittaker GC, Westwick J, Ward SG. Sotsios Y, et al. J Immunol. 1999 Dec 1;163(11):5954-63. J Immunol. 1999. PMID: 10570282 - Akt activation, but not extracellular signal-regulated kinase activation, is required for SDF-1alpha/CXCR4-mediated migration of epitheloid carcinoma cells.
Peng SB, Peek V, Zhai Y, Paul DC, Lou Q, Xia X, Eessalu T, Kohn W, Tang S. Peng SB, et al. Mol Cancer Res. 2005 Apr;3(4):227-36. doi: 10.1158/1541-7786.MCR-04-0193. Mol Cancer Res. 2005. PMID: 15831676 - Stromal cell-derived factor 1alpha stimulates human glioblastoma cell growth through the activation of both extracellular signal-regulated kinases 1/2 and Akt.
Barbero S, Bonavia R, Bajetto A, Porcile C, Pirani P, Ravetti JL, Zona GL, Spaziante R, Florio T, Schettini G. Barbero S, et al. Cancer Res. 2003 Apr 15;63(8):1969-74. Cancer Res. 2003. PMID: 12702590 - Context-Dependent Signaling of CXC Chemokine Receptor 4 and Atypical Chemokine Receptor 3.
Heuninck J, Perpiñá Viciano C, Işbilir A, Caspar B, Capoferri D, Briddon SJ, Durroux T, Hill SJ, Lohse MJ, Milligan G, Pin JP, Hoffmann C. Heuninck J, et al. Mol Pharmacol. 2019 Dec;96(6):778-793. doi: 10.1124/mol.118.115477. Epub 2019 May 15. Mol Pharmacol. 2019. PMID: 31092552 Review.
Cited by
- Sarcoplasmic reticulum Ca(2+) ATPase 2 (SERCA2) reduces the migratory capacity of CCL21-treated monocyte-derived dendritic cells.
Hong CY, Lee HJ, Choi NR, Jung SH, Vo MC, Hoang MD, Kim HJ, Lee JJ. Hong CY, et al. Exp Mol Med. 2016 Aug 19;48(8):e253. doi: 10.1038/emm.2016.69. Exp Mol Med. 2016. PMID: 27538371 Free PMC article. - VASP is a CXCR2-interacting protein that regulates CXCR2-mediated polarization and chemotaxis.
Neel NF, Barzik M, Raman D, Sobolik-Delmaire T, Sai J, Ham AJ, Mernaugh RL, Gertler FB, Richmond A. Neel NF, et al. J Cell Sci. 2009 Jun 1;122(Pt 11):1882-94. doi: 10.1242/jcs.039057. Epub 2009 May 12. J Cell Sci. 2009. PMID: 19435808 Free PMC article. - CXCL12 protects pancreatic β-cells from oxidative stress by a Nrf2-induced increase in catalase expression and activity.
Dinić S, Grdović N, Uskoković A, Đorđević M, Mihailović M, Jovanović JA, Poznanović G, Vidaković M. Dinić S, et al. Proc Jpn Acad Ser B Phys Biol Sci. 2016;92(9):436-454. doi: 10.2183/pjab.92.436. Proc Jpn Acad Ser B Phys Biol Sci. 2016. PMID: 27840391 Free PMC article. - CXCR4 Inhibition Enhances Efficacy of FLT3 Inhibitors in FLT3-Mutated AML Augmented by Suppressed TGF-b Signaling.
Kim BR, Jung SH, Han AR, Park G, Kim HJ, Yuan B, Battula VL, Andreeff M, Konopleva M, Chung YJ, Cho BS. Kim BR, et al. Cancers (Basel). 2020 Jun 30;12(7):1737. doi: 10.3390/cancers12071737. Cancers (Basel). 2020. PMID: 32629802 Free PMC article. - Does Neutrophil Phenotype Predict the Survival of Trauma Patients?
Mortaz E, Zadian SS, Shahir M, Folkerts G, Garssen J, Mumby S, Adcock IM. Mortaz E, et al. Front Immunol. 2019 Sep 6;10:2122. doi: 10.3389/fimmu.2019.02122. eCollection 2019. Front Immunol. 2019. PMID: 31552051 Free PMC article. Review.
References
- Baggiolini M. Chemokines and leukocyte traffic. Nature. 1998;392:565–568. - PubMed
- Baggiolini M., Dewald B., Moser B. Human chemokinesan update. Annu. Rev. Immunol. 1997;15:675–705. - PubMed
- Baird A.M., Gerstein R.M., Berg L.J. The role of cytokine receptor signaling in lymphocyte development. Curr. Opin. Immunol. 1999;11:157–166. - PubMed
- Hesselgesser J., Horuk R. Chemokine and chemokine receptor expression in the central nervous system. J. Neurovirol. 1999;5:13–26. - PubMed
- Sallusto F., Lanzavecchia A., Mackay C.R. Chemokines and chemokine receptors in T-cell priming and Th1/Th2-mediated responses. Immunol. Today. 1998;19:568–574. - PubMed
Publication types
MeSH terms
Substances
LinkOut - more resources
Full Text Sources
Research Materials
Miscellaneous
