Induction of the chemokines interleukin-8 and IP-10 by human immunodeficiency virus type 1 tat in astrocytes - PubMed (original) (raw)
Induction of the chemokines interleukin-8 and IP-10 by human immunodeficiency virus type 1 tat in astrocytes
O Kutsch et al. J Virol. 2000 Oct.
Abstract
A finding commonly observed in human immunodeficiency virus type 1 (HIV-1)-infected patients is invasion of the brain by activated T cells and infected macrophages, eventually leading to the development of neurological disorders and HIV-1-associated dementia. The recruitment of T cells and macrophages into the brain is likely the result of chemokine expression. Indeed, earlier studies revealed that levels of different chemokines were increased in the cerebrospinal fluid of HIV-1-infected patients whereas possible triggers and cellular sources for chemokine expression in the brain remain widely undefined. As previous studies indicated that HIV-1 Tat, the retroviral transactivator, is capable of inducing a variety of cellular genes, we investigated its capacity to induce production of chemokines in astrocytes. Herein, we demonstrate that HIV-1 Tat(72aa) is a potent inducer of MCP-1, interleukin-8 (IL-8), and IP-10 expression in astrocytes. Levels of induced IP-10 protein were sufficiently high to induce chemotaxis of peripheral blood lymphocytes. In addition, Tat(72aa) induced IL-8 expression in astrocytes. IL-8 mRNA induction was seen less then 1 h after Tat(72aa) stimulation, and levels remained elevated for up to 24 h, leading to IL-8 protein production. Tat(72aa)-mediated MCP-1 and IL-8 mRNA induction was susceptible to inhibition by the MEK1/2 inhibitor UO126 but was only modestly decreased by the inclusion of the p38 mitogen-activated protein kinase (MAPK) inhibitor SB202190. In contrast, Tat-mediated IP-10 mRNA induction was suppressed by SB202190 but not by the MEK1/2 inhibitor UO126. These findings indicate that MAPKs play a major role in Tat(72aa)-mediated chemokine induction in astrocytes.
Figures
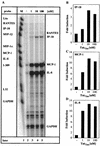
FIG. 1
Induction of IP-10, MCP-1, and IL-8 mRNAs in primary human astrocytes by HIV-1 Tat72aa. (A) Human primary astrocytes were incubated with medium or Tat72aa (1 to 100 nM) for 6 h, and total RNA was isolated and analyzed for induction of chemokine mRNA using RPA. Probe alone is shown in lane 1. Quantitative analysis of chemokine mRNA induction for IP-10 (B), for MCP-1 (C), and for IL-8 (D) is shown. Expression of different chemokine mRNAs was normalized to the respective expression of GAPDH mRNA, and fold induction was calculated in comparison to cells cultured in medium alone. These results are representative of three independent experiments.
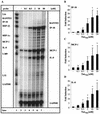
FIG. 2
Induction of IP-10, MCP-1, and IL-8 mRNAs in the human astroglioma cell line CRT-MG by HIV-1 Tat72aa. (A) CRT-MG human astroglioma cells were incubated with medium or HIV-1 Tat72aa (0.1 to 50 nM) for 6 h, and total RNA was isolated and analyzed for induction of chemokine mRNA using RPA. Probe alone is shown in lane 1. Quantitative analysis of chemokine mRNA induction for IP-10 (B), for MCP-1 (C), and for IL-8 (D) is shown. Expression of different chemokine mRNAs was normalized to the respective expression of GAPDH mRNA, and fold induction was calculated in comparison to cells cultured in medium alone. Bars represent the mean ± the standard deviation of the experiment shown in panel A and two additional experiments. Statistical analysis was performed comparing chemokine mRNA induction between Tat72aa-stimulated CRT-MG cells and untreated controls (∗, P < 0.05).
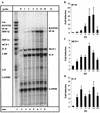
FIG. 3
Kinetic analysis of chemokine mRNA expression in the human astroglioma cell line CRT-MG after stimulation with HIV-1 Tat72aa. (A) CRT-MG cells were incubated with medium (lane 2) or with 50 nM Tat for the times indicated (1 to 24 h; lanes 3 to 8). Free probe is shown in lane 1. Total RNA was isolated and analyzed for chemokine expression by RPA. Quantitative analysis of chemokine mRNA expression is shown for IP-10 (B), MCP-1 (C), and IL-8 (D). Expression of different chemokine mRNAs was normalized to the respective expression of GAPDH mRNA, and fold induction was calculated in comparison to cells cultured in medium alone. Bars represent the mean ± the standard deviation of five independent experiments.
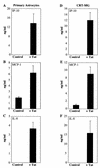
FIG. 4
Expression of chemokine protein by HIV-1 Tat72aa-stimulated astrocytes. Primary human astrocytes (A, B, and C) and CRT-MG cells (D, E, and F) were stimulated with 50 nM Tat72aa for 24 h. Supernatants were collected and analyzed for the expression of IP-10 (A and D), MCP-1 (B and E), and IL-8 (C and F) by ELISA. Bars represent the mean ± the standard deviation of three independent experiments.
FIG. 5
Migration of IL-2-activated PBL toward supernatants from HIV-1 Tat72aa-stimulated astrocytes. PBL were stimulated with phytohemagglutinin and cultivated in the presence of IL-2 (100 U/ml) for 5 days. Migration assays to measure the capacity of supernatants from Tat72aa-stimulated CRT-MG cells to induce chemotaxis were performed in 24-well Transwell chambers. Supernatants from unstimulated control cultures (CS) and from Tat-stimulated cultures (TS) were added to the lower chamber of Transwell plates, and 106 PBL were placed in the upper chamber. After 4 h, migration was quantitated by flow cytometry using Calibrite beads as a standard. (A) Histogram analysis of PBL migration induced by supernatants from unstimulated CRT-MG cells (CS; black), supernatants from Tat-stimulated CRT-MG cells (TS; green), supernatants from Tat-stimulated astrocytes in the presence of neutralizing anti-IP-10 antibody (10 μg/ml; TS + α-IP10; red), supernatants derived from CRT-MG cells stimulated with heat-inactivated Tat72aa (hTS; blue), and Tat72aa (50 nM), used as a chemoattractant (Tat; yellow). (B) Quantitative analysis of migrated cells under different conditions. In addition to the culture conditions shown in panel A, the migratory responses of PBL to supernatants from Tat72aa-stimulated CRT-MG cells treated with isotype control antibody (TS + IgG) and to recombinant IP-10 (10 ng/ml), used as a chemoattractant (IP10), are shown. Bars represent the mean ± the standard deviation of three independent experiments.
FIG. 6
Inhibition of HIV-1 Tat72aa-mediated induction of chemokine mRNA by the MEK1/2 inhibitor UO126 and the p38 inhibitor SB202190. CRT-MG cells were incubated with medium (−) or stimulated with 50 nM Tat (T) for 6 h. Cells were preincubated with the MEK1/2 inhibitor UO126 (A to C) or the p38 inhibitor SB202190 (D to F) for 1 h at the concentrations indicated (0.1 to 10 μM) before stimulation of the cells with 50 nM Tat. As a negative control for UO126, the compound UO124, at a concentration of 10 μM, was used (C; A to C). For inhibition experiments using SB202190, the control compound SB202474, at a concentration of 10 μM, was used (C; D to F). The histograms show the quantitative analysis of chemokine mRNA expression for IP-10 (A and D), MCP-1 (B and E), and IL-8 (C and F). Expression of different chemokine mRNAs was normalized to the respective expression of GAPDH mRNA and corrected for the background, and relative induction was calculated in comparison to the expression of mRNA in cells stimulated with Tat alone (100%). Bars represent the mean ± the standard deviation of four independent experiments.
Similar articles
- Upregulated expression of interleukin-8, RANTES and chemokine receptors in human astrocytic cells infected with HIV-1.
Cota M, Kleinschmidt A, Ceccherini-Silberstein F, Aloisi F, Mengozzi M, Mantovani A, Brack-Werner R, Poli G. Cota M, et al. J Neurovirol. 2000 Feb;6(1):75-83. doi: 10.3109/13550280009006384. J Neurovirol. 2000. PMID: 10786999 - Induction of monocyte chemoattractant protein-1 (MCP-1/CCL2) gene expression by human immunodeficiency virus-1 Tat in human astrocytes is CDK9 dependent.
Khiati A, Chaloin O, Muller S, Tardieu M, Horellou P. Khiati A, et al. J Neurovirol. 2010 Mar;16(2):150-67. doi: 10.3109/13550281003735691. J Neurovirol. 2010. PMID: 20370601 - Synergistic increases in intracellular Ca2+, and the release of MCP-1, RANTES, and IL-6 by astrocytes treated with opiates and HIV-1 Tat.
El-Hage N, Gurwell JA, Singh IN, Knapp PE, Nath A, Hauser KF. El-Hage N, et al. Glia. 2005 Apr 15;50(2):91-106. doi: 10.1002/glia.20148. Glia. 2005. PMID: 15630704 Free PMC article. - Human immunodeficiency virus type-1 and chemokines: beyond competition for common cellular receptors.
Stantchev TS, Broder CC. Stantchev TS, et al. Cytokine Growth Factor Rev. 2001 Jun-Sep;12(2-3):219-43. doi: 10.1016/s1359-6101(00)00033-2. Cytokine Growth Factor Rev. 2001. PMID: 11325604 Review. - HIV tat and neurotoxicity.
King JE, Eugenin EA, Buckner CM, Berman JW. King JE, et al. Microbes Infect. 2006 Apr;8(5):1347-57. doi: 10.1016/j.micinf.2005.11.014. Epub 2006 Jan 26. Microbes Infect. 2006. PMID: 16697675 Review.
Cited by
- Palm Fruit Bioactives modulate human astrocyte activity in vitro altering the cytokine secretome reducing levels of TNFα, RANTES and IP-10.
Weinberg RP, Koledova VV, Schneider K, Sambandan TG, Grayson A, Zeidman G, Artamonova A, Sambanthamurthi R, Fairus S, Sinskey AJ, Rha C. Weinberg RP, et al. Sci Rep. 2018 Nov 6;8(1):16423. doi: 10.1038/s41598-018-34763-3. Sci Rep. 2018. PMID: 30401897 Free PMC article. - Interleukin-8 and growth-regulated oncogene alpha mediate angiogenesis in Kaposi's sarcoma.
Lane BR, Liu J, Bock PJ, Schols D, Coffey MJ, Strieter RM, Polverini PJ, Markovitz DM. Lane BR, et al. J Virol. 2002 Nov;76(22):11570-83. doi: 10.1128/jvi.76.22.11570-11583.2002. J Virol. 2002. PMID: 12388718 Free PMC article. - Chemokines in cerebrospinal fluid correlate with cerebral metabolite patterns in HIV-infected individuals.
Letendre SL, Zheng JC, Kaul M, Yiannoutsos CT, Ellis RJ, Taylor MJ, Marquie-Beck J, Navia B; HIV Neuroimaging Consortium. Letendre SL, et al. J Neurovirol. 2011 Feb;17(1):63-9. doi: 10.1007/s13365-010-0013-2. Epub 2011 Jan 19. J Neurovirol. 2011. PMID: 21246320 Free PMC article. - Chronic CXCL10 alters the level of activated ERK1/2 and transcriptional factors CREB and NF-kappaB in hippocampal neuronal cell culture.
Bajova H, Nelson TE, Gruol DL. Bajova H, et al. J Neuroimmunol. 2008 Mar;195(1-2):36-46. doi: 10.1016/j.jneuroim.2008.01.003. Epub 2008 Mar 10. J Neuroimmunol. 2008. PMID: 18329727 Free PMC article. - Interactions of HIV and drugs of abuse: the importance of glia, neural progenitors, and host genetic factors.
Hauser KF, Knapp PE. Hauser KF, et al. Int Rev Neurobiol. 2014;118:231-313. doi: 10.1016/B978-0-12-801284-0.00009-9. Int Rev Neurobiol. 2014. PMID: 25175867 Free PMC article. Review.
References
- Baggiolini M. Chemokines and leukocyte traffic. Nature. 1998;392:565–568. - PubMed
- Baggiolini M, Clark-Lewis I. Interleukin-8, a chemotactic and inflammatory cytokine. FEBS Lett. 1992;307:97–101. - PubMed
- Baggiolini M, Dewald B, Moser B. Human chemokines: an update. Annu Rev Immunol. 1997;15:675–705. - PubMed
- Barnum S R, Jones J L, Benveniste E N. Interferon-gamma regulation of C3 gene expression in human astroglioma cells. J Neuroimmunol. 1992;38:275–282. - PubMed
- Bazan J F, Bacon K B, Hardiman G, Wang W, Soo K, Rossi D, Greaves D R, Zlotnik A, Schall T J. A new class of membrane-bound chemokine with a CX3C motif. Nature. 1997;385:640–644. - PubMed
Publication types
MeSH terms
Substances
LinkOut - more resources
Full Text Sources
Other Literature Sources
Medical
Research Materials
Miscellaneous


