Gadd153 sensitizes cells to endoplasmic reticulum stress by down-regulating Bcl2 and perturbing the cellular redox state - PubMed (original) (raw)
Gadd153 sensitizes cells to endoplasmic reticulum stress by down-regulating Bcl2 and perturbing the cellular redox state
K D McCullough et al. Mol Cell Biol. 2001 Feb.
Abstract
gadd153, also known as chop, is a highly stress-inducible gene that is robustly expressed following disruption of homeostasis in the endoplasmic reticulum (ER) (so-called ER stress). Although all reported types of ER stress induce expression of Gadd153, its role in the stress response has remained largely undefined. Several studies have correlated Gadd153 expression with cell death, but a mechanistic link between Gadd153 and apoptosis has never been demonstrated. To address this issue we employed a cell model system in which Gadd153 is constitutively overexpressed, as well as two cell lines in which Gadd153 expression is conditional. In all cell lines, overexpression of Gadd153 sensitized cells to ER stress. Investigation of the mechanisms contributing to this effect revealed that elevated Gadd153 expression results in the down-regulation of Bcl2 expression, depletion of cellular glutathione, and exaggerated production of reactive oxygen species. Restoration of Bcl2 expression in Gadd153-overexpressing cells led to replenishment of glutathione and a reduction in levels of reactive oxygen species, and it protected cells from ER stress-induced cell death. We conclude that Gadd153 sensitizes cells to ER stress through mechanisms that involve down-regulation of Bcl2 and enhanced oxidant injury.
Figures
FIG. 1
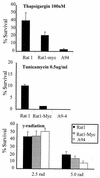
Constitutive expression of Gadd153 sensitizes cells to ER stress as demonstrated in colony formation assays. Rat1, Rat-Myc, and A94 (Rat1-Myc-Gadd153) cell lines were treated with the indicated doses of thapsigargin or tunicamycin for 24 h or were exposed to ionizing radiation and allowed to recover for 24 h. Following treatments, cells were split into 100-mm tissue culture plates and colonies were counted 8 to 12 days later. Data are reported as percent survival relative to control (untreated) cells and are an average of at least three independent experiments. Error bars represent standard errors of the means.
FIG. 2
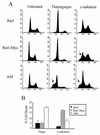
Constitutive expression of Gadd153 sensitizes cells to ER stress-induced apoptosis. Cell lines were treated with thapsigargin (1 μM, 24 h) or γ-irradiation (5.0 rad, 48 h recovery). Following staining with PI, DNA content was measured using flow cytometry. (A) Histograms from a representative experiment. Arrows denote the appearance of a sub-G1 peak, which is indicative of apoptosis. (B) The sub-G1 content of each cell population was quantified. Data shown are the means ± standard errors of at least three independent experiments.
FIG. 3
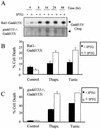
Inducible expression of Gadd153 sensitizes cells to ER stress-induced death. (A) gadd153, under control of an IPTG-inducible promoter, was introduced into Rat1 fibroblasts and MEFs derived from _gadd153/chop_−/− mice. Accumulation of Gadd153 is evident in Western blots following introduction of 5 mM IPTG to the culture medium. (B and C) Rat1-Gadd153i (B) and _gadd153_−/− Gadd153i (C) cells were treated with thapsigargin (1 μM, 24 h) or tunicamycin (1 μg/ml, 24 h) in the presence or absence of 5 mM IPTG, and apoptosis was quantified using flow cytometry. Data are averages of at least three independent experiments. Error bars represent standard errors of the means.
FIG. 4
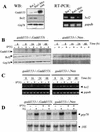
Gadd153 down-regulates Bcl2. (A) Western blot demonstrating that Bcl2 protein levels are diminished in cells constitutively overexpressing Gadd153, while Grp78 expression is unaffected by constitutively elevated Gadd153 levels. The RT-PCR shows that the bcl2 mRNA level is also decreased basally in A94 cells. The gapdh RT-PCR was performed as a control for RNA integrity and loading. (B) Western blot demonstrating down-regulation of Bcl2 in _gadd153_−/− Gadd153i cells but not in _gadd153_−/− Neo cells. Concomitant with induction of Gadd153 expression by inclusion of 5 mM IPTG in the culture medium, Bcl2 expression decreases, while expression of Grp78 remains constant. In contrast, IPTG had no effect on Bcl2 protein levels in the vector control cells. There was no Gadd153 expression in the _gadd153_−/− Neo cells, so no blot is shown for this protein. (C) RT-PCR demonstrating that inclusion of IPTG in the culture medium of _gadd153_−/− Neo cells has no effect on bcl2 mRNA levels. In contrast, IPTG-mediated induction of Gadd153 in _gadd153_−/−, Gadd153i cells results in diminished abundance of bcl2 mRNA. (D) Northern blot analysis showing that 5 mM IPTG pretreatment for 18 h, which induces Gadd153 expression in _gadd153_−/− Gadd153i cells, does not influence the induction of grp78 RNA levels in response to ER stress incurred by 1 μM thapsigargin (TG) for 6 h.
FIG. 5
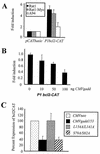
(A) Plasmid constructs containing the bcl2 promoter region P1 linked to the cat reporter gene were transfected into Rat1, Rat1-Myc, and A94 cell lines. Acetylation of 14C-chloramphenicol, which reflects activity of the bcl2 promoter, was quantified. Data are expressed as fold induction of the promoter activity relative to that of the vector control, which harbored the cat gene but lacked the bcl2 promoter. (B) bcl2-cat promoter-reporter plasmids were introduced into HeLa cells along with increasing concentrations of a gadd153 expression vector, and bcl2 promoter activity was determined. Data are reported as fold induction relative to the activity of the bcl2 promoter in HeLa cells transfected with a vector lacking the gadd153 gene (CMVneo). (C) bcl2-cat promoter-reporter plasmids were introduced in HeLa cells along with 1 μg of expression vector for CMVneo, wild-type Gadd153, Gadd153 harboring mutations in the leucine zipper domain (L134A/L141A), or Gadd153 harboring mutations in the transactivation domain (S79A/S82A). bcl2 promoter activity was determined 48 h later. Data are expressed relative to the activity of the bcl2 promoter-transfected empty CMVneo vector. All data are averages of at least three independent experiments and bars represent standard errors of the means.
FIG. 6
Restoration of Bcl2 expression in A94 cells protects against ER stress-induced death. A94 cells transfected with bcl2 expression constructs show greatly enhanced Bcl2 levels (Western blot, insert). Following treatment with either thapsigargin (1 μM, 24 h) or tunicamycin (1 μg/ml, 24 h), cells were harvested, stained with PI, and analyzed using flow cytometry. The sub-G1 content of each cell population was quantified. Data are averages of at least three independent experiments and error bars represent standard errors of the means.
FIG. 7
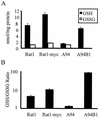
GSH is depleted from Gadd153-overexpressing cells in a Bcl2-dependent manner. (A) HPLC was used to measure cellular GSH and GSSG levels. (B) The ratio of GSH to GSSG, which gives an estimate of the overall redox state of the cell, is reported. All data are reported as averages of three or more independent experiments and bars represent standard errors of the means.
FIG. 8
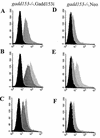
Gadd153 increases cellular ROS production. Control (untreated) cells and cells treated with thapsigargin (1 μM, 24 h) or tunicamycin (1 μg/ml, 24 h) were incubated with H2DCF diacetate, which freely crosses cell membranes and is cleaved intracellularly to form the less membrane-permeative H2DCF. In the presence of ROS this dye is oxidized, producing a fluorescent product, DCF. Flow cytometry was used to analyze fluorescence in each cell population. ROS production, indicated as a rightward shift in peak fluorescence, was maximal in A94 cells, regardless of treatment. This experiment was repeated three times, and representative histograms are shown.
FIG. 9
Conditional expression of Gadd153 increases oxidative stress. ROS production was examined in _gadd153_−/− Gadd153i cells, which conditionally express Gadd153 (A, B, and C), and in _gadd153_−/− Neo cells, which are vector control cells (D, E, and F), using H2DCF dye and flow cytometry. (A and D) Cells were treated with IPTG (dark gray peak) or with a vehicle control (black peak). Significant ROS production was observed in response to Gadd153 induction (A) but not in IPTG-treated control cells (D). (B and E) Following pretreatment with IPTG or vehicle control, cells were exposed to tunicamycin (TN; 1 μg/ml, 12 h). The black peak represents fluorescence in untreated control cells (−IPTG, −TN). The dark gray peak corresponds to tunicamycin-treated cells lacking Gadd153 (−IPTG, +TN), while the light gray peak corresponds to ROS production in IPTG-pretreated cells exposed to tunicamycin (+IPTG, +TN). Tunicamycin treatment increased ROS production in both cell lines, but ROS production was maximal in Gadd153-expressing cells treated with tunicamycin. (C and F) Following pretreatment with IPTG or vehicle control, cells were exposed to thapsigargin (TG; 1 μM, 12 h). The black peak represents fluorescence in untreated cells (−IPTG, −TG). The dark gray peak corresponds to thapsigargin-treated cells that were not pretreated with IPTG (−IPTG, +TG), while the light gray peak corresponds to cells receiving IPTG followed by thapsigargin (+IPTG, +TG). Maximal ROS production was again detected in Gadd153-expressing cells treated with thapsigargin. All experiments were repeated three times and representative histograms are shown.
FIG. 10
GSH depletion sensitizes cells to ER stress. Rat1 and Rat1-Myc cells were pretreated with BSO (100 μM, 24 h) followed by treatment with thapsigargin (TG; 1 μM, 24 h). Cell death was quantified using flow cytometry. Data represent averages from at least three independent experiments. Error bars denote standard errors of the means.
Similar articles
- Involvement of Gadd153 in the pathogenic action of presenilin-1 mutations.
Milhavet O, Martindale JL, Camandola S, Chan SL, Gary DS, Cheng A, Holbrook NJ, Mattson MP. Milhavet O, et al. J Neurochem. 2002 Nov;83(3):673-81. doi: 10.1046/j.1471-4159.2002.01165.x. J Neurochem. 2002. PMID: 12390529 - Cadmium induces neuronal cell death through reactive oxygen species activated by GADD153.
Kim S, Cheon HS, Kim SY, Juhnn YS, Kim YY. Kim S, et al. BMC Cell Biol. 2013 Jan 22;14:4. doi: 10.1186/1471-2121-14-4. BMC Cell Biol. 2013. PMID: 23339468 Free PMC article. - Roles of CHOP/GADD153 in endoplasmic reticulum stress.
Oyadomari S, Mori M. Oyadomari S, et al. Cell Death Differ. 2004 Apr;11(4):381-9. doi: 10.1038/sj.cdd.4401373. Cell Death Differ. 2004. PMID: 14685163 Review. - Inhibition of phosphatidylcholine synthesis induces expression of the endoplasmic reticulum stress and apoptosis-related protein CCAAT/enhancer-binding protein-homologous protein (CHOP/GADD153).
van der Sanden MH, Houweling M, van Golde LM, Vaandrager AB. van der Sanden MH, et al. Biochem J. 2003 Feb 1;369(Pt 3):643-50. doi: 10.1042/BJ20020285. Biochem J. 2003. PMID: 12370080 Free PMC article. - Induction of GADD153 and Bak: novel molecular targets of fenretinide-induced apoptosis of neuroblastoma.
Lovat PE, Oliverio S, Corazzari M, Ranalli M, Pearson AD, Melino G, Piacentini M, Redfern CP. Lovat PE, et al. Cancer Lett. 2003 Jul 18;197(1-2):157-63. doi: 10.1016/s0304-3835(03)00098-3. Cancer Lett. 2003. PMID: 12880976 Review.
Cited by
- Activation of Wnt/β-catenin pathway by exogenous Wnt1 protects SH-SY5Y cells against 6-hydroxydopamine toxicity.
Wei L, Sun C, Lei M, Li G, Yi L, Luo F, Li Y, Ding L, Liu Z, Li S, Xu P. Wei L, et al. J Mol Neurosci. 2013 Jan;49(1):105-15. doi: 10.1007/s12031-012-9900-8. Epub 2012 Oct 11. J Mol Neurosci. 2013. PMID: 23065334 - Insulin resistance, ceramide accumulation, and endoplasmic reticulum stress in human chronic alcohol-related liver disease.
Longato L, Ripp K, Setshedi M, Dostalek M, Akhlaghi F, Branda M, Wands JR, de la Monte SM. Longato L, et al. Oxid Med Cell Longev. 2012;2012:479348. doi: 10.1155/2012/479348. Epub 2012 Apr 22. Oxid Med Cell Longev. 2012. PMID: 22577490 Free PMC article. - Dual role for the unfolded protein response in the ovary: adaption and apoptosis.
Huang N, Yu Y, Qiao J. Huang N, et al. Protein Cell. 2017 Jan;8(1):14-24. doi: 10.1007/s13238-016-0312-3. Epub 2016 Sep 8. Protein Cell. 2017. PMID: 27638465 Free PMC article. Review. - The PPP1R15 Family of eIF2-alpha Phosphatase Targeting Subunits (GADD34 and CReP).
Hicks D, Giresh K, Wrischnik LA, Weiser DC. Hicks D, et al. Int J Mol Sci. 2023 Dec 10;24(24):17321. doi: 10.3390/ijms242417321. Int J Mol Sci. 2023. PMID: 38139150 Free PMC article. Review. - DWN12088, A Prolyl-tRNA Synthetase Inhibitor, Alleviates Hepatic Injury in Nonalcoholic Steatohepatitis.
Lee DK, Jo SH, Lee ES, Ha KB, Park NW, Kong DH, Park SI, Park JS, Chung CH. Lee DK, et al. Diabetes Metab J. 2024 Jan;48(1):97-111. doi: 10.4093/dmj.2022.0367. Epub 2024 Jan 3. Diabetes Metab J. 2024. PMID: 38173372 Free PMC article.
References
- Alarcon R M, Rupnow B A, Graeber T G, Knox S J, Giaccia A J. Modulation of c-Myc activity and apoptosis in vivo. Cancer Res. 1996;56:4315–4319. - PubMed
- Anderson M E. Determination of glutathione and glutathione disulfide in biological samples. Methods Enzymol. 1985;113:548–555. - PubMed
- Anderson M E, Luo J L. Glutathione therapy: from prodrugs to genes. Semin Liver Dis. 1998;18:415–424. - PubMed
- Aridor M, Balch W E. Integration of endoplasmic reticulum signaling in health and disease. Nat Med. 1999;5:745–751. - PubMed
Publication types
MeSH terms
Substances
LinkOut - more resources
Full Text Sources
Molecular Biology Databases
Research Materials
