Autonomous maturation of alpha/beta T lineage cells in the absence of COOH-terminal Src kinase (Csk) - PubMed (original) (raw)
Autonomous maturation of alpha/beta T lineage cells in the absence of COOH-terminal Src kinase (Csk)
C Schmedt et al. J Exp Med. 2001.
Abstract
The deletion of COOH-terminal Src kinase (Csk), a negative regulator of Src family protein tyrosine kinases (PTKs), in immature thymocytes results in the development of alpha/beta T lineage cells in T cell receptor (TCR) beta-deficient or recombination activating gene (rag)-1-deficient mice. The function of Csk as a repressor of Lck and Fyn activity suggests activation of these PTKs is solely responsible for the phenotype observed in csk-deficient T lineage cells. We provide genetic evidence for this notion as alpha/beta T cell development is blocked in lck(-/)-fyn(-/)- csk-deficient mice. It remains unclear whether activation of Lck and Fyn in the absence of Csk uncouples alpha/beta T cell development entirely from engagement of surface-expressed receptors. We show that in mice expressing the alpha/beta TCR on csk-deficient thymocytes, positive selection is biased towards the CD4 lineage and does not require the presence of major histocompatibility complex (MHC) class I and II. Furthermore, the introduction of an MHC class I-restricted transgenic TCR into a csk-deficient background results in the development of mainly CD4 T cells carrying the transgenic TCR both in selecting and nonselecting MHC background. Thus, TCR-MHC interactions have no impact on positive selection and commitment to the CD4 lineage in the absence of Csk. However, TCR-mediated negative selection of csk-deficient, TCR transgenic cells is normal. These data suggest a differential involvement of the Csk-mediated regulation of Src family PTKs in positive and negative selection of developing thymocytes.
Figures
Figure 1
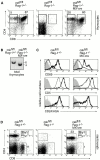
Positive selection and a peripheral pool of TCR-deficient T lineage cells in the absence of Csk. (A) FACS® analysis of surface expression of CD4, CD8, on thymocytes isolated from control and csk fl/fl rag-1 −/−MX-cre mice, as indicated. Numbers show percentages of live-gated cells. Total thymocyte numbers were 17 × 107 for csk fl/fl rag-1 +/−, 0.06 × 10⁷ for rag-1 −/−, and 6.3 × 10⁷ for csk fl/fl rag-1 −/−MX-cre mice. Representative data of three independent experiments are shown. (B) Southern blot analysis of genomic DNA isolated from total thymocytes of control and csk fl/fl rag-1 −/−MX-cre mice, as indicated. For Southern blotting, DNA was digested with Eco_RI and hybridized with a probe, which allows to distinguish wild-type, loxP-flanked (fl), and deleted (Δ) csk alleles. (C) Histograms show the surface expression of thymocyte maturation markers based on three-color FACS® analysis, as indicated. DP (thin line) and CD4-SP (thick line) cells were gated as shown in A. Staining controls are shown as shaded area in all histograms. (D) FACS® analysis of surface expression of CD4, CD8, and CD90/Thy-1 on splenocytes isolated from control and csk fl/fl rag-1 −/−_MX-cre mice, as indicated. Numbers show percentages of live-gated cells. The total number of CD4 T cells were 11.3 × 10⁷ and 2.8 × 10⁷ for csk fl/fl rag-1 +/− and csk fl/fl rag-1 −/−MX-cre mice, respectively.
Figure 2
Development of TCR-bearing T cells in the absence of Csk. (A) Surface expression pattern of CD4 and CD8 on thymocytes and lymph node cells isolated from control and csk fl/fl lck-cre mice, as indicated. Similar data were obtained in more than five independent experiments. (B) Histograms show surface expression of TCR β on thymocyte and lymph node cell populations as gated in A. Percentage numbers indicate the fraction of TCR β− cells within the gated population. Plain numbers indicate the mean fluorescence intensity of the gated peak. Staining controls are shown as shaded area in all histograms. (C) Southern blot analysis of genomic DNA isolated from total thymocytes, non–T cells, CD4hi, or CD4lo T cells of control and csk fl/fl lck-cre mice, as indicated. Southern blotting was performed as described in the legend to Fig. 1. fl, _loxP_-flanked; Δ, deleted csk alleles.
Figure 3
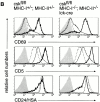
MHC-independent positive selection of _csk_-deficient CD4 T cells. (A) FACS® analysis of CD4 and CD8 surface expression of thymocytes and lymph node cells isolated from control and csk fl/fl MHC − lck-cre mice, as indicated. Numbers show percentages of live-gated cells. Total thymocyte numbers were 271 ± 93 × 106 (n = 3), 353 ± 95 × 106 (n = 2), and 251 ± 81 × 106 (n = 2) for csk fl/fl MHC +, csk fl/fl MHC −, and csk fl/fl MHC −lck-cre mice, respectively. The number of splenic CD4 cells were 24.3 ± 10.1 × 10⁶ (n = 2), 4.5 ± 2.6 × 10⁶ (n = 2), and 15.3 ± 6.6 × 10⁶ (n = 2) for csk fl/fl MHC +, csk fl/fl MHC −, and csk fl/fl MHC − lck-cre mice, respectively. (B) Histograms show surface expression of thymocyte maturation markers based on three-color FACS® analysis, as indicated. DP (thin line) and CD4-SP (thick line) cells were gated as shown in A. CD69 and CD5 expression levels on DP thymocytes of csk fl/fl MHC − mice are shown as dotted line for reference. Staining controls are shown as shaded area in all histograms.
Figure 4
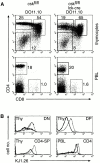
Development of _csk_-deficient thymocytes expressing an MHC class II–restricted transgenic TCR. (A) FACS® analysis of CD4 and CD8 surface expression on thymocytes and PBLs isolated from control csk fl/fl DO11.10-TCRtg (left) and csk fl/fl lck-cre DO11.10-TCRtg mice (right) expressing I-Ad. Numbers show percentages of live-gated cells. Total cell numbers of thymi are depicted at the top. (B) Overlay histograms show surface expression of the transgenic TCR chain, as detected with the KJ1.26 antibody on thymocyte and PBL populations as indicated. DN, DP, CD4-SP, and CD4 cells were gated as shown in A on csk fl/fl DO11.10-TCRtg (thin line) or csk fl/fl lck-cre DO11.10-TCRtg mice (thick line). Similar results were obtained in two independent experiments.
Figure 5
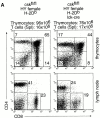
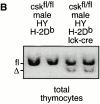
Aberrant positive selection of _csk_-deficient thymocytes expressing an MHC class I–restricted transgenic TCR. (A) FACS® analysis of CD4 and CD8 surface expression on thymocytes and lymph node cells isolated from female control csk fl/fl HY-TCRtg (left) and csk fl/fl lck-cre HY-TCRtg mice (right) expressing H-2Db. Numbers show percentages of live-gated cells. Total thymocyte and splenic (Spl) T cell numbers are depicted at the top. (B) Overlay histograms show surface expression of the transgenic TCR α chain, as detected with the T3.70 antibody on thymocyte and lymph node cell populations of csk fl/fl HY-TCRtg mice (shaded area) or csk fl/fl lck-cre HY-TCRtg mice (thick line) on H-2Db background, as indicated. CD8-SP, CD4-SP, CD8, and CD4 cells were gated as shown in A. The numbers of T3.70+ CD4 T cells were 0.14 × 10⁶ and 2.51 × 10⁶ for csk fl/fl HY-TCRtg and csk fl/fl lck-cre HY-TCRtg mice, respectively. Data are representative of five experiments. (C) Southern blot analysis of genomic DNA isolated from total thymocytes of control and csk fl/fl lck-cre HY-TCRtg mice on H-2Db background, as indicated. Southern blotting was performed as described in the legend to Fig. 1. fl, loxP-flanked; Δ, deleted csk alleles. (D) Overlay histograms showing TCR α chain expression on thymocytes (CD4-SP) and T cells (CD4) of csk fl/fl HY-TCRtg mice (shaded area) or csk fl/fl lck-cre HY-TCRtg mice (thick line) on H-2Dd background. Thymocyte numbers were 68 × 106 and 73 × 106 for csk fl/fl HY-TCRtg and csk fl/fl lck-cre HY-TCRtg mice, respectively. The numbers of T3.70+ CD4 T cells were 0.07 × 10⁶ and 0.56 × 10⁶ for csk fl/fl HY-TCRtg and csk fl/fl lck-cre HY-TCRtg mice, respectively. Similar results were obtained in two independent experiments.
Figure 6
Normal negative selection of _csk_-deficient thymocytes expressing an MHC class I–restricted transgenic TCR. (A) FACS® analysis of CD4, CD8, and T3.70 surface expression on thymocytes isolated from male csk fl/fl HY-TCRtg and csk fl/fl lck-cre HY-TCRtg mice on H-2Db background. Dot plots show T3.70+ thymocytes, gated as indicated in the histogram insert. Total cell numbers of thymi (Thy) are shown at the top. Data are representative of three independent experiments. (B) Southern blot analysis of genomic DNA isolated from total thymocytes of two male control and two male csk fl/fl HY-TCRlck-cre mice on H-2Db background, as indicated. Southern blotting was performed as described in the legend to Fig. 1. fl, _loxP_-flanked; Δ, deleted csk alleles.
Figure 7
Development of csk_-deficient T lineage cells is dependent on the presence of Lck and Fyn. (A) FACS® analysis of surface expression of CD4 and CD8 on thymocytes and lymph node cells isolated from various control and csk fl/fl lck −/−_lck-cre mice, as indicated. Numbers show percentages of live-gated cells. The total thymocyte (Thy) and splenic T cell numbers are indicated at the top. (B) FACS® analysis of surface expression of CD4, CD8, CD25, and CD44 on thymocytes isolated from control and csk fl/fl lck −/−fyn −/−lck-cre mice, as indicated. The bottom panel shows CD25 vs. CD44 surface expression on DN cells gated as shown in the top panels. Numbers show percentages of live-gated cells. Similar numbers of dots are shown in the bottom panel. Total thymocyte numbers are depicted at the top. Similar results were obtained in three independent experiments.
Similar articles
- Csk controls antigen receptor-mediated development and selection of T-lineage cells.
Schmedt C, Saijo K, Niidome T, Kühn R, Aizawa S, Tarakhovsky A. Schmedt C, et al. Nature. 1998 Aug 27;394(6696):901-4. doi: 10.1038/29802. Nature. 1998. PMID: 9732874 - Differential contribution of Lck and Fyn protein tyrosine kinases to intraepithelial lymphocyte development.
Page ST, van Oers NS, Perlmutter RM, Weiss A, Pullen AM. Page ST, et al. Eur J Immunol. 1997 Feb;27(2):554-62. doi: 10.1002/eji.1830270229. Eur J Immunol. 1997. PMID: 9045930 - Enhanced T cell maturation and altered lineage commitment in T cell receptor/CD4-transgenic mice.
Lieberman SA, Spain LM, Wang L, Berg LJ. Lieberman SA, et al. Cell Immunol. 1995 Apr 15;162(1):56-67. doi: 10.1006/cimm.1995.1051. Cell Immunol. 1995. PMID: 7704911 - Function of the Src-family kinases, Lck and Fyn, in T-cell development and activation.
Palacios EH, Weiss A. Palacios EH, et al. Oncogene. 2004 Oct 18;23(48):7990-8000. doi: 10.1038/sj.onc.1208074. Oncogene. 2004. PMID: 15489916 Review. - [Function of the Lck and Fyn in T cell development].
Dai P, Liu X, Li QW. Dai P, et al. Yi Chuan. 2012 Mar;34(3):289-95. doi: 10.3724/sp.j.1005.2012.00289. Yi Chuan. 2012. PMID: 22425947 Review. Chinese.
Cited by
- Lineage fate and intense debate: myths, models and mechanisms of CD4- versus CD8-lineage choice.
Singer A, Adoro S, Park JH. Singer A, et al. Nat Rev Immunol. 2008 Oct;8(10):788-801. doi: 10.1038/nri2416. Nat Rev Immunol. 2008. PMID: 18802443 Free PMC article. Review. - Feedback circuits monitor and adjust basal Lck-dependent events in T cell receptor signaling.
Schoenborn JR, Tan YX, Zhang C, Shokat KM, Weiss A. Schoenborn JR, et al. Sci Signal. 2011 Sep 13;4(190):ra59. doi: 10.1126/scisignal.2001893. Sci Signal. 2011. PMID: 21917715 Free PMC article. - Novel tools to dissect the dynamic regulation of TCR signaling by the kinase Csk and the phosphatase CD45.
Tan YX, Zikherman J, Weiss A. Tan YX, et al. Cold Spring Harb Symp Quant Biol. 2013;78:131-139. doi: 10.1101/sqb.2013.78.020347. Epub 2013 Oct 7. Cold Spring Harb Symp Quant Biol. 2013. PMID: 24100586 Free PMC article. - Cbp deficiency alters Csk localization in lipid rafts but does not affect T-cell development.
Xu S, Huo J, Tan JE, Lam KP. Xu S, et al. Mol Cell Biol. 2005 Oct;25(19):8486-95. doi: 10.1128/MCB.25.19.8486-8495.2005. Mol Cell Biol. 2005. PMID: 16166631 Free PMC article. - Reciprocal regulation of lymphocyte activation by tyrosine kinases and phosphatases.
Hermiston ML, Xu Z, Majeti R, Weiss A. Hermiston ML, et al. J Clin Invest. 2002 Jan;109(1):9-14. doi: 10.1172/JCI14794. J Clin Invest. 2002. PMID: 11781344 Free PMC article. Review. No abstract available.
References
- von Boehmer H., Fehling H.J. Structure and function of the pre-T cell receptor. Annu. Rev. Immunol. 1997;15:433–452. - PubMed
- Kisielow P., von Boehmer H. Development and selection of T cellsfacts and puzzles. Adv. Immunol. 1995;58:87–209. - PubMed
- Fink P.J., Bevan M.J. Positive selection of thymocytes. Adv. Immunol. 1995;59:99–133. - PubMed
- Zijlstra M., Bix M., Simister N.E., Loring J.M., Raulet D.H., Jaenisch R. β2-microglobulin deficient mice lack CD4−8+ cytolytic T cells. Nature. 1990;344:742–746. - PubMed
- Koller B.H., Marrack P., Kappler J.W., Smithies O. Normal development of mice deficient in β2M, MHC class I proteins, and CD8+ T cells. Science. 1990;248:1227–1230. - PubMed
Publication types
MeSH terms
Substances
LinkOut - more resources
Full Text Sources
Molecular Biology Databases
Research Materials
Miscellaneous
