Glucose toxicity and the development of diabetes in mice with muscle-specific inactivation of GLUT4 - PubMed (original) (raw)
Glucose toxicity and the development of diabetes in mice with muscle-specific inactivation of GLUT4
J K Kim et al. J Clin Invest. 2001 Jul.
Abstract
Using cre/loxP gene targeting, transgenic mice with muscle-specific inactivation of the GLUT4 gene (muscle GLUT4 KO) were generated and shown to develop a diabetes phenotype. To determine the mechanism, we examined insulin-stimulated glucose uptake and metabolism during hyperinsulinemic-euglycemic clamp in control and muscle GLUT4 KO mice before and after development of diabetes. Insulin-stimulated whole body glucose uptake was decreased by 55% in muscle GLUT4 KO mice, an effect that could be attributed to a 92% decrease in insulin-stimulated muscle glucose uptake. Surprisingly, insulin's ability to stimulate adipose tissue glucose uptake and suppress hepatic glucose production was significantly impaired in muscle GLUT4 KO mice. To address whether these latter changes were caused by glucose toxicity, we treated muscle GLUT4 KO mice with phloridzin to prevent hyperglycemia and found that insulin-stimulated whole body and skeletal muscle glucose uptake were decreased substantially, whereas insulin-stimulated glucose uptake in adipose tissue and suppression of hepatic glucose production were normal after phloridzin treatment. In conclusion, these findings demonstrate that a primary defect in muscle glucose transport can lead to secondary defects in insulin action in adipose tissue and liver due to glucose toxicity. These secondary defects contribute to insulin resistance and to the development of diabetes.
Figures
Figure 1
Whole body and skeletal muscle metabolic parameters during hyperinsulinemic-euglycemic clamps in awake mice at 20–21 weeks of age. (a) Basal plasma glucose concentration in the control (wild-type, lox/lox, and cre; open circles), muscle GLUT4 KO (MG4KO; filled circles), and PHZ-treated muscle GLUT4 KO (MG4KO + PHZ; open squares) mice. (b) Basal plasma insulin concentration in the control (open circles), muscle GLUT4 KO (filled circles), and PHZ-treated muscle GLUT4 KO (open squares) mice. (c) Insulin-stimulated whole body glucose uptake in vivo in control (open bar), heterozygous KO (Het KO; dark gray bar), muscle GLUT4 KO (black bar), and PHZ-treated muscle GLUT4 KO (MG4KO + PHZ; light gray bar) mice. (d) Insulin-stimulated glucose uptake in skeletal muscle (gastrocnemius) in vivo in control (open bar), heterozygous KO (dark gray bar), muscle GLUT4 KO (black bar), and PHZ-treated muscle GLUT4 KO (light gray bar) mice. Values are means plus or minus SE for 5–10 experiments. *P < 0.05 vs. control mice; #P < 0.05 for the PHZ-treated muscle GLUT4 KO mice vs. nontreated muscle GLUT4 KO mice.
Figure 2
Insulin-stimulated glucose metabolic flux in whole body and skeletal muscle (gastrocnemius) during hyperinsulinemic-euglycemic clamps in awake control (wild-type, lox/lox, and cre; open bar), heterozygous KO (dark gray bar), muscle GLUT4 KO (black bar), and PHZ-treated muscle GLUT4 KO (light gray bar) mice at 20–21 weeks of age. (a) Insulin-stimulated whole body glycolysis in vivo. (b) Insulin-stimulated whole body glycogen/lipid synthesis in vivo. (c) Insulin-stimulated skeletal muscle glycolysis in vivo. (d) Insulin-stimulated skeletal muscle glycogen synthesis in vivo. Values are means plus or minus SE for 5–10 experiments. *P < 0.05 vs. control mice; #P < 0.05 for the PHZ-treated muscle GLUT4 KO mice vs. nontreated muscle GLUT4 KO mice.
Figure 3
Insulin action in liver and adipose tissues during hyperinsulinemic-euglycemic clamps in awake control (wild-type, lox/lox, and cre; open bar), heterozygous KO (dark gray bar), muscle GLUT4 KO (black bar), and PHZ-treated muscle GLUT4 KO (light gray bar) mice at 20–21 weeks of age. (a) Percentage of suppression of basal hepatic glucose production. (b) Insulin-stimulated glucose uptake in epididymal white adipose tissue in vivo. (c) Insulin-stimulated glucose uptake in intrascapular brown adipose tissue in vivo. Values are means plus or minus SE for 5–10 experiments. *P < 0.05 vs. control mice. #P < 0.05 for the PHZ-treated muscle GLUT4 KO mice vs. nontreated muscle GLUT4 KO mice.
Figure 4
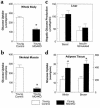
Insulin action in whole body and individual tissues during hyperinsulinemic-euglycemic clamps in awake young control (wild-type, lox/lox, and cre; open bar) and young muscle GLUT4 KO (MG4KO; filled bar) mice at approximately 10 weeks of age. (a) Insulin-stimulated whole body glucose uptake in vivo. (b) Insulin-stimulated glucose uptake in skeletal muscle (gastrocnemius) in vivo. (c) Basal and insulin-stimulated rates of hepatic glucose production. (d) Insulin-stimulated glucose uptake in epididymal white adipose tissue and intrascapular brown adipose tissue in vivo. Values are means plus or minus SE for 9–11 experiments. *P < 0.05 vs. young control mice.
Figure 5
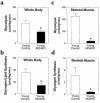
Insulin-stimulated glucose metabolic flux in whole body and skeletal muscle (gastrocnemius) during hyperinsulinemic-euglycemic clamps in awake young control (wild-type, lox/lox, and cre; open bar) and young muscle GLUT4 KO (filled bar) mice at approximately 10 weeks of age. (a) Insulin-stimulated whole body glycolysis in vivo. (b) Insulin-stimulated whole body glycogen/lipid synthesis in vivo. (c) Insulin-stimulated skeletal muscle glycolysis in vivo. (d) Insulin-stimulated skeletal muscle glycogen synthesis in vivo. Values are means plus or minus SE for 9–11 experiments. *P < 0.05 vs. young control mice.
Similar articles
- Adipose-specific overexpression of GLUT4 reverses insulin resistance and diabetes in mice lacking GLUT4 selectively in muscle.
Carvalho E, Kotani K, Peroni OD, Kahn BB. Carvalho E, et al. Am J Physiol Endocrinol Metab. 2005 Oct;289(4):E551-61. doi: 10.1152/ajpendo.00116.2005. Epub 2005 May 31. Am J Physiol Endocrinol Metab. 2005. PMID: 15928024 - Peripheral but not hepatic insulin resistance in mice with one disrupted allele of the glucose transporter type 4 (GLUT4) gene.
Rossetti L, Stenbit AE, Chen W, Hu M, Barzilai N, Katz EB, Charron MJ. Rossetti L, et al. J Clin Invest. 1997 Oct 1;100(7):1831-9. doi: 10.1172/JCI119711. J Clin Invest. 1997. PMID: 9312184 Free PMC article. - Nonobese, insulin-deficient Ins2Akita mice develop type 2 diabetes phenotypes including insulin resistance and cardiac remodeling.
Hong EG, Jung DY, Ko HJ, Zhang Z, Ma Z, Jun JY, Kim JH, Sumner AD, Vary TC, Gardner TW, Bronson SK, Kim JK. Hong EG, et al. Am J Physiol Endocrinol Metab. 2007 Dec;293(6):E1687-96. doi: 10.1152/ajpendo.00256.2007. Epub 2007 Oct 2. Am J Physiol Endocrinol Metab. 2007. PMID: 17911348 - Effects of hyperglycemia on glucose transporters of the muscle: use of the renal glucose reabsorption inhibitor phlorizin to control glycemia.
Dimitrakoudis D, Vranic M, Klip A. Dimitrakoudis D, et al. J Am Soc Nephrol. 1992 Nov;3(5):1078-91. doi: 10.1681/ASN.V351078. J Am Soc Nephrol. 1992. PMID: 1482748 Review. - GLUT4: a key player regulating glucose homeostasis? Insights from transgenic and knockout mice (review).
Wallberg-Henriksson H, Zierath JR. Wallberg-Henriksson H, et al. Mol Membr Biol. 2001 Jul-Sep;18(3):205-11. doi: 10.1080/09687680110072131. Mol Membr Biol. 2001. PMID: 11681787 Review.
Cited by
- Dissociation of inositol-requiring enzyme (IRE1α)-mediated c-Jun N-terminal kinase activation from hepatic insulin resistance in conditional X-box-binding protein-1 (XBP1) knock-out mice.
Jurczak MJ, Lee AH, Jornayvaz FR, Lee HY, Birkenfeld AL, Guigni BA, Kahn M, Samuel VT, Glimcher LH, Shulman GI. Jurczak MJ, et al. J Biol Chem. 2012 Jan 20;287(4):2558-67. doi: 10.1074/jbc.M111.316760. Epub 2011 Nov 28. J Biol Chem. 2012. PMID: 22128176 Free PMC article. - Diacylglycerol activation of protein kinase Cε and hepatic insulin resistance.
Jornayvaz FR, Shulman GI. Jornayvaz FR, et al. Cell Metab. 2012 May 2;15(5):574-84. doi: 10.1016/j.cmet.2012.03.005. Cell Metab. 2012. PMID: 22560210 Free PMC article. Review. - Liver-specific deletion of negative regulator Pten results in fatty liver and insulin hypersensitivity [corrected].
Stiles B, Wang Y, Stahl A, Bassilian S, Lee WP, Kim YJ, Sherwin R, Devaskar S, Lesche R, Magnuson MA, Wu H. Stiles B, et al. Proc Natl Acad Sci U S A. 2004 Feb 17;101(7):2082-7. doi: 10.1073/pnas.0308617100. Epub 2004 Feb 9. Proc Natl Acad Sci U S A. 2004. PMID: 14769918 Free PMC article. - Glucose transport and sensing in the maintenance of glucose homeostasis and metabolic harmony.
Herman MA, Kahn BB. Herman MA, et al. J Clin Invest. 2006 Jul;116(7):1767-75. doi: 10.1172/JCI29027. J Clin Invest. 2006. PMID: 16823474 Free PMC article. Review. - Skeletal muscle insulin resistance: is it important for the pathogenesis of type 2 diabetes after all?
Koistinen HA, Zierath JR. Koistinen HA, et al. J Endocrinol Invest. 2003 Jul;26(7):690-2. doi: 10.1007/BF03347032. J Endocrinol Invest. 2003. PMID: 14594125 No abstract available.
References
- Warram JH, Martin BC, Krolewski AS, Soeldner JS, Kahn CR. Slow glucose removal rate and hyperinsulinemia precede the development of type II diabetes in the offspring of diabetic patients. Ann Intern Med. 1990;113:909–915. - PubMed
- Reaven GM, Bernstein R, Davis B, Olefsky JM. Nonketotic diabetes mellitus: insulin deficiency or insulin resistance? Am J Med. 1976;60:80–88. - PubMed
- DeFronzo RA. The triumvirate: beta-cell, muscle, liver. A collusion responsible for NIDDM. Diabetes. 1988;37:667–687. - PubMed
- Shulman GI, et al. Quantitation of muscle glycogen synthesis in normal subjects and subjects with non-insulin-dependent diabetes by 13C nuclear magnetic resonance spectroscopy. N Engl J Med. 1990;322:223–228. - PubMed
- DeFronzo RA, et al. The effect of insulin on the disposal of intravenous glucose. Results from indirect calorimetry and hepatic and femoral venous catheterization. Diabetes. 1981;30:1000–1007. - PubMed
Publication types
MeSH terms
Substances
Grants and funding
- R01 DK-40936/DK/NIDDK NIH HHS/United States
- U24 DK-59635/DK/NIDDK NIH HHS/United States
- U24 DK059635/DK/NIDDK NIH HHS/United States
- P30 DK-45735/DK/NIDDK NIH HHS/United States
- R01 DK040936/DK/NIDDK NIH HHS/United States
- P30 DK045735/DK/NIDDK NIH HHS/United States
- R01 DK033201/DK/NIDDK NIH HHS/United States
- R01 DK043051/DK/NIDDK NIH HHS/United States
- R01 DK-33201/DK/NIDDK NIH HHS/United States
- R01 DK080756/DK/NIDDK NIH HHS/United States
- R01 DK-43051/DK/NIDDK NIH HHS/United States
LinkOut - more resources
Full Text Sources
Medical
Molecular Biology Databases
Research Materials


