In vivo requirements for GATA-1 functional domains during primitive and definitive erythropoiesis - PubMed (original) (raw)
In vivo requirements for GATA-1 functional domains during primitive and definitive erythropoiesis
R Shimizu et al. EMBO J. 2001.
Abstract
GATA-1 is a transcription factor essential for erythroid/megakaryocytic cell differentiation. To investigate the contribution of individual domains of GATA-1 to its activity, transgenic mice expressing either an N-terminus, or an N- or C-terminal zinc finger deletion of GATA-1 (Delta NT, Delta NF or Delta CF, respectively) were generated and crossed to GATA-1 germline mutant (GATA-1.05) mice. Since the GATA-1 gene is located on the X-chromosome, male GATA-1 mutants die by embryonic day 12.5. Both Delta NF and Delta CF transgenes failed to rescue the GATA-1.05/Y pups. However, transgenic mice expressing Delta NT, but not the Delta NF protein, were able to rescue definitive hematopoiesis. In embryos, while neither the Delta CF protein nor a mutant missing both N-terminal domains (Delta NTNF) was able to support primitive erythropoiesis, the two independent Delta NT and Delta NF mutants could support primitive erythropoiesis. Thus, lineage-specific transgenic rescue of the GATA-1 mutant mouse revealed novel properties that are conferred by specific domains of GATA-1 during primitive and definitive erythropoiesis, and demonstrate that the NT and NF moieties lend complementary, but distinguishable properties to the function of GATA-1.
Figures
Fig. 1. Expression and transactivation activity of GATA-1 mutants. (A) Deletion constructs are illustrated schematically. Numbers indicate the amino acid residues. (B) Immunoblotting analyses of GATA-1 mutant proteins. 293T cells were mock transfected (lane 6) or transfected with expression plasmids driving the wild-type GATA-1 (lane 1), ΔNF (lane 2), ΔCF (lane 3), ΔNT (lane 4) or ΔNTNF (lane 5) mutant GATA-1. Lysates were then immunoreacted with the N6 monoclonal antibody (top panel), rat anti-mouse GATA-1 antiserum (middle panel) or anti-lamin B antibody (bottom panel). The positions of the size markers are shown on the left of the panels. An arrow indicates the position of the lamin B protein. (C) EMSA using nuclear extracts prepared from QT6 cells transfected with either wild-type or mutant GATA-1 expression plasmids. Lane 1, pEF-BOS vector; lanes 2, 7 and 8, wild-type GATA-1; lane 3, ΔNF; lane 4, ΔCF; lane 5, ΔNT; lane 6, ΔNTNF. Unlabeled oligonucleotide (100-fold molar excess) was added to the sample depicted in lane 8. (D) Immunocytochemical analysis of QT6 cells transfected with either wild-type or mutant GATA-1 expression plasmids. The top panels demonstrate immunofluorescence staining with the N6 antibody (WT, ΔNF and ΔCF) or the anti-GATA-1 polyclonal antibody (ΔNT and ΔNTNF). Simultaneous staining with the nuclear dye DAPI and corresponding bright-field photomicrographs are shown in the middle and bottom panels, respectively. Arrowheads indicate the cells immunoreactive with anti-GATA-1 antibodies. (E) Transactivation activity of the GATA-1 mutant proteins. GATA-1 mutant expression vectors were cotransfected into QT6 cells with a LUC reporter plasmid. LUC activity of mock transfection was set to one and relative LUC activities of other constructs are shown.
Fig. 2. GATA-1 mutant mRNA and protein in transgenic mice. (A) The positions of the primers used for RT–PCR detection of GATA-1 mRNA expression are indicated. The S1 (open triangle) and AS1 primer (gray triangle) pair was used to detect the expression of wild-type, ΔNF and ΔCF mRNAs, while the S1 and AS2 (black triangle) primer pair was used to detect the expression of the ΔNT and ΔNTNF transcripts. The circled UTR depicts the 110 bp sequence added to permit discrimination of transgene-derived mRNAs from endogenous GATA-1 mRNA. (B) The transgene-derived mRNA level was determined for each established transgenic line by semiquantitative RT–PCR. The lines without transgene (panels 1 and 8), with wild-type GATA-1 (panels 2 and 3), ΔNF (panels 4 and 5), ΔCF (panels 6 and 7), ΔNT (panels 9–11) or ΔNTNF (panels 12–14) mutant transgene were used for the analysis. Reverse transcribed cDNAs were rendered for 28, 30 and 32 cycles of amplification. Arrows indicate the migration position expected for transgene-derived GATA-1 amplicons, while asterisks indicate the position of the endogenous GATA-1 amplicon. The relative position of the transgene-derived GATA-1 bands changes in the left and right panels due to the insertion of the UTR fragment and NT deletion. (C–J) Transgenic expression of mutant GATA-1 proteins in E9.5 yolk sac erythroid cells. Immunohistochemical analysis was performed using the N6 monoclonal antibody (C, E, G and H) or anti-GATA-1 antiserum (D, F, I and J). E9.5 embryos of GATA-1.05/Y (C and D), wild type (E and F), GATA-1.05/Y::ΔNF (G), GATA-1.05/Y::ΔCF (H), GATA-1.05/Y::ΔNT (I) or GATA-1.05/Y::ΔNTNF (J) genotype are shown. The nucleus was counterstained by methyl green, and the positive GATA-1 staining (brown color) is localized in the nucleus.
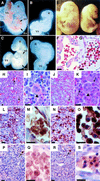
Fig. 3. Phenotypes of GATA-1.05/Y germline mutant embryos expressing wild-type or mutant GATA-1 transgenes. (A–D) Analysis of E9.5 embryos and yolk sacs. While wild-type yolk sacs and embryos contain abundant red blood cells (A), the GATA-1.05/Y embryos at E9.5 are pale and small, and red blood cells are not detected (B). GATA-1.05/Y embryo bearing the ΔNF transgene is normal in size at the E9.5 stage and red blood cells are clearly seen in the embryos (C). GATA-1.05/Y embryos bearing the ΔNTNF transgene do not grow well and are severely anemic (D). YS, yolk sac; H, embryo head; AS, aortic sac; DA, dorsal aorta. (E) An E15.5 embryo with GATA-1.05/Y::ΔNF (G1ΔNFR; right) is small and pale in comparison with its wild-type sibling (left). (F–K) Histological examination of the E15.5 G1ΔNFR and wild-type embryos with hematoxylin–eosin staining. Whereas enucleated red blood cells exist abundantly in the wild-type blood vessels (F), many nucleated erythroid cells are circulating in G1ΔNFR embryos (G). The liver of E15.5 wild-type embryo is filled with enucleated mature definitive erythroid cells (arrows in H and I) and megakaryocytes (arrowhead in I). In the liver of the E15.5 G1ΔNFR embryo, megakaryocytes (arrowhead in K) similarly are found, but such enucleated erythrocytes are not found (J and K). The arrows in (J) and (K) indicate nucleated erythroid cells. (L–S) Expression of β-major and εy-globins in the liver of E15.5 wild-type and G1ΔNFR mutant embryos. Immunohistochemical analysis was performed with either anti-β-major (L–O) or anti-εy-globin (P–S) antibody. (M) and (O) are higher magnifications of (L) and (N), respectively. A large number of erythroid cells positive for β-major globin (brown color) are seen both in the liver of wild-type (L and M) and G1ΔNFR (N and O) embryos. In contrast, only a small number of εy-globin-positive erythroid cells are found in both the wild-type (P and Q) and G1ΔNFR (R and S) embryos (arrows). (Q) and (S) are higher magnifications of (P) and (R), respectively, both of which show εy-globin-negative cell clusters. As sections were counterstained by hematoxylin, nuclei were stained dark in the G1ΔNFR embryo sections. Scale bars correspond to 10 µm.
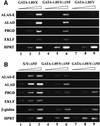
Fig. 4. Impaired expression of heme biosynthetic enzymes and EKLF in G1ΔNFR embryos. Expression of three heme biosynthetic enzymes and EKLF was analyzed by semiquantitative RT–PCR by changing amplification cycles, as indicated by a triangle on the top of each panel. (A) mRNA abundance of ALAS-E, ALAD, PBGD and EKLF was determined in E9.5 yolk sacs from GATA-1.05/X (lanes 1–3), GATA-1.05/Y::ΔNF (lanes 4–6) and GATA-1.05/Y embryos (lanes 7–9). The products were analyzed after 27, 30 and 33 cycles of amplification for ALAS-E, ALAD and PBGD; after 32, 35 and 38 cycles for EKLF; and after 24, 27 and 30 cycles for HPRT. (B) Expression of the same set of mRNAs was also examined in the E15.5 embryonic livers from X/Y::ΔNF (lanes 1–3) and two independent GATA-1.05/Y::ΔNF mice (lanes 4–6 and 7–9). The products were analyzed after 27, 30 and 33 cycles of amplification for PBGD and HPRT; after 30, 33 and 36 cycles for ALAS-E, ALAD and β-globin; and after 36, 39 and 42 cycles for EKLF.
Similar articles
- Transgenic over-expression of GATA-1 mutant lacking N-finger domain causes hemolytic syndrome in mouse erythroid cells.
Nakano M, Ohneda K, Yamamoto-Mukai H, Shimizu R, Ohneda O, Ohmura S, Suzuki M, Tsukamoto S, Yanagawa T, Yoshida H, Takakuwa Y, Yamamoto M. Nakano M, et al. Genes Cells. 2005 Jan;10(1):47-62. doi: 10.1111/j.1365-2443.2005.00814.x. Genes Cells. 2005. PMID: 15670213 - Knock-in mutation of transcription factor GATA-3 into the GATA-1 locus: partial rescue of GATA-1 loss of function in erythroid cells.
Tsai FY, Browne CP, Orkin SH. Tsai FY, et al. Dev Biol. 1998 Apr 15;196(2):218-27. doi: 10.1006/dbio.1997.8842. Dev Biol. 1998. PMID: 9576834 - Erythroid differentiation in chimaeric mice blocked by a targeted mutation in the gene for transcription factor GATA-1.
Pevny L, Simon MC, Robertson E, Klein WH, Tsai SF, D'Agati V, Orkin SH, Costantini F. Pevny L, et al. Nature. 1991 Jan 17;349(6306):257-60. doi: 10.1038/349257a0. Nature. 1991. PMID: 1987478 - Rescue of erythroid development in gene targeted GATA-1- mouse embryonic stem cells.
Simon MC, Pevny L, Wiles MV, Keller G, Costantini F, Orkin SH. Simon MC, et al. Nat Genet. 1992 May;1(2):92-8. doi: 10.1038/ng0592-92. Nat Genet. 1992. PMID: 1302015 Review. - GATA-1: friends, brothers, and coworkers.
Morceau F, Schnekenburger M, Dicato M, Diederich M. Morceau F, et al. Ann N Y Acad Sci. 2004 Dec;1030:537-54. doi: 10.1196/annals.1329.064. Ann N Y Acad Sci. 2004. PMID: 15659837 Review.
Cited by
- Regulation of GATA factor expression is distinct between erythroid and mast cell lineages.
Ohmori S, Takai J, Ishijima Y, Suzuki M, Moriguchi T, Philipsen S, Yamamoto M, Ohneda K. Ohmori S, et al. Mol Cell Biol. 2012 Dec;32(23):4742-55. doi: 10.1128/MCB.00718-12. Epub 2012 Sep 17. Mol Cell Biol. 2012. PMID: 22988301 Free PMC article. - Erythro-megakaryocytic transcription factors associated with hereditary anemia.
Crispino JD, Weiss MJ. Crispino JD, et al. Blood. 2014 May 15;123(20):3080-8. doi: 10.1182/blood-2014-01-453167. Epub 2014 Mar 20. Blood. 2014. PMID: 24652993 Free PMC article. Review. - Contribution of GATA1 dysfunction to multi-step leukemogenesis.
Shimizu R, Yamamoto M. Shimizu R, et al. Cancer Sci. 2012 Dec;103(12):2039-44. doi: 10.1111/cas.12007. Epub 2012 Oct 10. Cancer Sci. 2012. PMID: 22937757 Free PMC article. Review. - Phosphatidylinositol 3-kinase/Akt induced by erythropoietin renders the erythroid differentiation factor GATA-1 competent for TIMP-1 gene transactivation.
Kadri Z, Maouche-Chretien L, Rooke HM, Orkin SH, Romeo PH, Mayeux P, Leboulch P, Chretien S. Kadri Z, et al. Mol Cell Biol. 2005 Sep;25(17):7412-22. doi: 10.1128/MCB.25.17.7412-7422.2005. Mol Cell Biol. 2005. PMID: 16107690 Free PMC article. - Essential and instructive roles of GATA factors in eosinophil development.
Hirasawa R, Shimizu R, Takahashi S, Osawa M, Takayanagi S, Kato Y, Onodera M, Minegishi N, Yamamoto M, Fukao K, Taniguchi H, Nakauchi H, Iwama A. Hirasawa R, et al. J Exp Med. 2002 Jun 3;195(11):1379-86. doi: 10.1084/jem.20020170. J Exp Med. 2002. PMID: 12045236 Free PMC article.
References
- Bungert J. and Engel,J.D. (1996) The role of transcription factors in erythroid development. Ann. Med., 28, 47–55. - PubMed
- Enver T. and Greaves,M. (1998) Loops, lineage and leukemia. Cell, 94, 9–12. - PubMed
- Igarashi K., Kataoka,K., Itoh,K., Hayashi,N., Nishizawa,M. and Yamamoto,M. (1994) Regulation of transcription by dimerization of erythroid factor NF-E2 p45 with small Maf proteins. Nature, 367, 568–572. - PubMed
Publication types
MeSH terms
Substances
LinkOut - more resources
Full Text Sources
Molecular Biology Databases
Research Materials


