Expression of the endoplasmic reticulum molecular chaperone (ORP150) rescues hippocampal neurons from glutamate toxicity - PubMed (original) (raw)
. 2001 Nov;108(10):1439-50.
doi: 10.1172/JCI12978.
K Ozawa, M Miyazaki, M Tamatani, T Kobayashi, H Yanagi, M Okabe, M Ikawa, T Yamashima, D M Stern, O Hori, S Ogawa
Affiliations
- PMID: 11714735
- PMCID: PMC209417
- DOI: 10.1172/JCI12978
Expression of the endoplasmic reticulum molecular chaperone (ORP150) rescues hippocampal neurons from glutamate toxicity
Y Kitao et al. J Clin Invest. 2001 Nov.
Abstract
A series of events initiated by glutamate-receptor interaction perturbs cellular homeostasis resulting in elevation of intracellular free calcium and cell death. Cells subject to such environmental change express stress proteins, which contribute importantly to maintenance of metabolic homeostasis and viability. We show that an inducible chaperone present in endoplasmic reticulum (ER), the 150-kDa oxygen-regulated protein (ORP150), is expressed both in the human brain after seizure attack and in mouse hippocampus after kainate administration. Using mice heterozygous for ORP150 deficiency, exposure to excitatory stimuli caused hippocampal neurons to display exaggerated elevation of cytosolic calcium accompanied by activation of mu-calpain and cathepsin B, as well as increased vulnerability to glutamate-induced cell death in vitro and decreased survival to kainate in vivo. In contrast, targeted neuronal overexpression of ORP150 suppressed each of these events and enhanced neuronal and animal survival in parallel with diminished seizure intensity. Studies using cultured hippocampal neurons showed that ORP150 regulates cytosolic free calcium and activation of proteolytic pathways causing cell death in neurons subject to excitatory stress. Our data underscore a possible role for ER stress in glutamate toxicity and pinpoint a key ER chaperone, ORP150, which contributes to the stress response critical for neuronal survival.
Figures
Figure 1
Generation of heterozygous ORP150-deficient mice. Structure of ORP150 genomic DNA depicting the long and short arms of the targeting vector is shown at the top, and the targeting vector itself is shown in the middle. After homologous recombination, the resulting mutant (functionally “null”) allele, in which a 1.2-kb deletion was made (including all exons except 2, 3, 11, 14, 25, and 26), is shown at the bottom.
Figure 2
Expression of ORP150 in human brain: effect of excitatory and nutritional stress. The hippocampal area was prepared from autopsy samples of patients who died with uncontrolled status epilepticus, (a–d) 46-year-old female, and hemorrhagic shock, (e–h) 45-year-old female. In each case, the hippocampal area was stained with cresyl violet (a and e) (×400). Sections adjacent to a and e were stained with either anti-human ORP150 (b and f) (×400) or GFAP Ab (c and g) (×400). Images of ORP150 (b and f) and GFAP (c and g) are digitally overlapped in d and h.
Figure 3
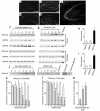
Expression of ORP150 in mouse hippocampus and cultured neurons in response to excitatory stress. (a–e) After the intrahippocampal administration of vehicle alone for 12 hours (a) or kainate (b–e), corresponding to 0.3 μg in 0.5 μl of PBS, the hippocampus was stained with anti–human ORP150 Ab; (a–d) ×40, (e) ×80. (f–j) Cultured neurons or astrocytes were exposed to either (f) glutamate (10 μM) for 0–24 hours, (g) glutamate (0–50 μM) for 8 hours, or exposed to hypoxia (12 hours for neuron and 24 hours for astrocytes; lane “Hypoxia”). Protein extracts (≈10 μg in neurons and 2 μg for astrocytes) were subjected to Western blot analysis with either anti-human ORP150 Ab or anti-KDEL Ab. Induction was quantified by densitometric analysis of the gel and expressed as fold increase of peak density against nonstimulated level. (h) Time course corresponding to f. (i) Dose response corresponding to g. (n = 4, mean ± SD is shown). *P < 0.01 by multiple comparison analysis, followed by one-way ANOVA. (j) Neurons were treated with NMDA (50 μM) for 0–24 hours or for 8 hours with NMDA (0–50 μM). Cultures were also treated with glutamate (10 μM) for 8 hours either in the absence or presence of MK-801, followed by Western blot analysis. (k–m) Viability of astrocytes (open bars) or neurons (filled bars) 24 hours after the addition of either glutamate (k) or NMDA (l) is shown (n = 8, mean ± SD). Viability were also assessed in neurons cultured with glutamate (50 μM) in the presence of MK-801 (0–1 μM) for 24 hours (m). **P < 0.01 by multiple contrast analysis, followed by two-way ANOVA, and *P < 0.01 by multiple comparison analysis, followed by one-way ANOVA, respectively.
Figure 4
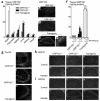
Characterization of heterozygous ORP150-deficient mice and transgenic mice. (a and f) ELISA analysis of ORP150 was performed in protein extracts prepared from systemic organs (a) or hippocampus 12 hours after the administration of kainate (f) (0–0.4 μg) of either heterozygous ORP150-deficient mice (ORP150–/+), wild-type littermates (ORP150+/+), or Tg PD-ORP150 mice (Transgenic). The mean ± SD is shown (n = 6). (b–e) Baseline expression of ORP150 was assessed by immunohistochemical analysis using anti-ORP150 Ab; (b–d) ×80, and (e) ×400. (g) Expression of Glu-R6 assessed immunohistochemically in each type of mice (×200). Expression of GRP78 (h) and GRP94 (i) was assessed by immunohistochemical analysis using specific Ab’s 12 hours after the intrahippocampal administration of kainate (0.1 μg; ×40).
Figure 5
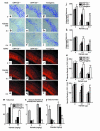
Role of ORP150 in the neuronal response to kainate. Either Nissl (a–k) or immunostaining (l–t) of MAP2 was performed in each mouse type 12 hours after the intraventricular administration of kainate (0–0.4 μg). (a–i) and (l–t) ×400. Quantitative analysis of neuronal viability from CA-1 and CA-3 are added (j and k and u and v) in each case. Mean ± SD is shown (n = 8). *, ** P < 0.01 by multiple contrast analysis compared with wild-type mice. (w–y) Survival 24 hours after intraperitoneal administration of kainate (w). Occurrence of seizures (x) and seizure index (y) 4 hours after kainate were assessed as described. Mean ± SD is shown (n = 6). #, ## symbols indicate P < 0.01 by χ2 analysis compared with wild type mice. *, ** P < 0.01 by multiple contrast analysis following Kruskal-Wallis analysis compared with wild-type mice.
Figure 6
Role of ORP150 in stress response to glutamate in vitro. (a–d) Cultured hippocampal neurons from ORP150–/+, nontransgenic littermates (ORP150+/+), or Tg PD-ORP150 mice (Transgenic) were exposed to the indicated concentration of either glutamate (a) or NMDA (c) for 24 hours or exposed to (b) glutamate (20 μM) or (d) NMDA (50 μM) for the indicated time. Percentage of viable neurons was determined as described in text. The mean ± SD is shown (n = 8). Asterisks indicate P < 0.01 compared with ORP150+/+ mice by multiple contrast analysis. (e–h) Hippocampal neurons were prepared from genetically manipulated mice, as above, and exposed to either (e)glutamate (10 μM) or (f–h) NMDA (50 μM). Cytosolic-free Ca++ was measured by fluorescent technique in ten representative neuron bodies, which were morphologically identified as described in the text. (e and f) Time course, mean of ten replicate experiments. (g) Peak and plateau (mean ± SD and n = 6) are shown. Ca++ was measured at the peak of NMDA-induced Ca++ (peak) and 5 minutes after the peak (plateau). *P < 0.05 and **P < 0.01 compared with ORP150–/+ neurons by multiple comparison analysis followed by one-way ANOVA. (h) Typical Ca++ image obtained at the peak by each culture is shown (Ca++ image, left panels; phase image, right panels; ×200 in each case).
Figure 7
Activation of Ca++-dependent proteinase in hippocampus. (a–b) Cultured neurons were treated with glutamate (20 μM) for 6 hours in the absence or presence of ZLLLal (10 μM). Protein extracts were then subjected to SDS-PAGE/immunoblotting using anti–μ-calpain Ab (a). Cathepsin B activity was measured by hydrolysis of peptide substrate in the medium. Mean ± SD is shown (n = 4). **P < 0.01 by multiple contrast analysis compared with ORP150–/+ mice (b). (c–d) Activation of μ-calpain, monitored by immunoblotting, was assessed in tissue extract of the hippocampal region 8 hours after the administration of kainate (c). Upper and lower arrowheads indicate the preactivated and activated forms of μ-calpain, respectively. Migration of molecular weight markers (in kilodaltons) is indicated on the far right side of the gel. Cathepsin B activity was measured by the hydrolysis of synthetic peptide substrate in the hippocampal region 8 hours after the administration of kainate (d). Mean ± SD is shown (n = 4). *P < 0.05 and **P < 0.01 by multiple contrast analysis compared with wild-type (ORP150+/+) mice. (e–f) Cultured neurons from C57BL6/J mice were exposed to the indicated concentration of BSO for up to 36 hours. Protein extracts (10 μg) were subjected to Western blot analysis with anti-human ORP150 (e). Neuron cultures were also exposed to hypoxia (12 hours), followed by Western blot analysis (lane, “Hypoxia”). Cultured hippocampal neurons from ORP150–/+, ORP150+/+, or Tg PD-ORP150 mice were exposed to the indicated concentration of BSO, and percentage of neuron viability was determined 24 and 36 hours after the exposure to BSO (f). The mean ± SD is shown (n = 8).
Similar articles
- [ORP150 (150 kDa oxygen regulated protein) suppressed neuronal cell death].
Ogawa S. Ogawa S. Nihon Yakurigaku Zasshi. 2003 Jan;121(1):43-8. doi: 10.1254/fpj.121.43. Nihon Yakurigaku Zasshi. 2003. PMID: 12617037 Review. Japanese. - Expression of 150-kd oxygen-regulated protein in the hippocampus suppresses delayed neuronal cell death.
Miyazaki M, Ozawa K, Hori O, Kitao Y, Matsushita K, Ogawa S, Matsuyama T. Miyazaki M, et al. J Cereb Blood Flow Metab. 2002 Aug;22(8):979-87. doi: 10.1097/00004647-200208000-00009. J Cereb Blood Flow Metab. 2002. PMID: 12172383 - Neuregulin beta1 enhances peak glutamate-induced intracellular calcium levels through endoplasmic reticulum calcium release in cultured hippocampal neurons.
Schapansky J, Morissette M, Odero G, Albensi B, Glazner G. Schapansky J, et al. Can J Physiol Pharmacol. 2009 Oct;87(10):883-91. doi: 10.1139/Y09-082. Can J Physiol Pharmacol. 2009. PMID: 20052014 - Molecular chaperone ORP150 in ER stress-related diseases.
Kusaczuk M, Cechowska-Pasko M. Kusaczuk M, et al. Curr Pharm Des. 2013;19(15):2807-18. doi: 10.2174/1381612811319150016. Curr Pharm Des. 2013. PMID: 23363441 Review.
Cited by
- Novel roles of ER stress in repressing neural activity and seizures through Mdm2- and p53-dependent protein translation.
Liu DC, Eagleman DE, Tsai NP. Liu DC, et al. PLoS Genet. 2019 Sep 26;15(9):e1008364. doi: 10.1371/journal.pgen.1008364. eCollection 2019 Sep. PLoS Genet. 2019. PMID: 31557161 Free PMC article. - Preconditioning with endoplasmic reticulum stress ameliorates mesangioproliferative glomerulonephritis.
Inagi R, Kumagai T, Nishi H, Kawakami T, Miyata T, Fujita T, Nangaku M. Inagi R, et al. J Am Soc Nephrol. 2008 May;19(5):915-22. doi: 10.1681/ASN.2007070745. Epub 2008 Feb 6. J Am Soc Nephrol. 2008. PMID: 18256359 Free PMC article. - Transgenic overexpression of 14-3-3 zeta protects hippocampus against endoplasmic reticulum stress and status epilepticus in vivo.
Brennan GP, Jimenez-Mateos EM, McKiernan RC, Engel T, Tzivion G, Henshall DC. Brennan GP, et al. PLoS One. 2013;8(1):e54491. doi: 10.1371/journal.pone.0054491. Epub 2013 Jan 24. PLoS One. 2013. PMID: 23359526 Free PMC article. - Region-specific vulnerability to endoplasmic reticulum stress-induced neuronal death in rat brain after status epilepticus.
Chen J, Guo H, Zheng G, Shi ZN. Chen J, et al. J Biosci. 2013 Dec;38(5):877-86. doi: 10.1007/s12038-013-9391-y. J Biosci. 2013. PMID: 24296890 - Expression of oxygen-regulated protein 150 (ORP150) in skin wound healing and its application for wound age determination.
Ishida Y, Kimura A, Takayasu T, Eisenmenger W, Kondo T. Ishida Y, et al. Int J Legal Med. 2008 Sep;122(5):409-14. doi: 10.1007/s00414-008-0255-1. Epub 2008 Jun 18. Int J Legal Med. 2008. PMID: 18563428
References
- Hori O, et al. Metabolic and biosynthetic alterations in cultured astrocytes exposed to hypoxia/reoxygenation. J Neurochem. 1994;62:1489–1495. - PubMed
- Kuwabara K, et al. Purufucation and characterization of a novel stress protein, the 150 kDa oxygen regulated protein (ORP150), from cultured rat astrocytes, and its expression in ischemic mouse brain. J Biol Chem. 1996;279:5025–5032. - PubMed
- Ikeda J, et al. Cloning and expression of cDNA encoding the human 150 kDa oxygen regulated protein, ORP150. Biochem Biophys Res Commun. 1997;230:94–99. - PubMed
- Ozawa K, et al. ORP150 (150 kDa oxygen-regulated protein) suppresses hypoxia-induced apoptotic cell death. J Biol Chem. 1999;274:6397–6404. - PubMed
MeSH terms
Substances
LinkOut - more resources
Full Text Sources
Molecular Biology Databases
Research Materials
Miscellaneous


