CENP-A is phosphorylated by Aurora B kinase and plays an unexpected role in completion of cytokinesis - PubMed (original) (raw)
CENP-A is phosphorylated by Aurora B kinase and plays an unexpected role in completion of cytokinesis
S G Zeitlin et al. J Cell Biol. 2001.
Abstract
Aurora B is a mitotic protein kinase that phosphorylates histone H3, behaves as a chromosomal passenger protein, and functions in cytokinesis. We investigated a role for Aurora B with respect to human centromere protein A (CENP-A), a centromeric histone H3 homologue. Aurora B concentrates at centromeres in early G2, associates with histone H3 and centromeres at the times when histone H3 and CENP-A are phosphorylated, and phosphorylates histone H3 and CENP-A in vitro at a similar target serine residue. Dominant negative phosphorylation site mutants of CENP-A result in a delay at the terminal stage of cytokinesis (cell separation). The only molecular defects detected in analysis of 22 chromosomal, spindle, and regulatory proteins were disruptions in localization of inner centromere protein (INCENP), Aurora B, and a putative partner phosphatase, PP1gamma1. Our data support a model where CENP-A phosphorylation is involved in regulating Aurora B, INCENP, and PP1gamma1 targeting within the cell. These experiments identify an unexpected role for the kinetochore in regulation of cytokinesis.
Figures
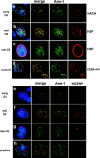
Figure 1.
Aurora B and INCENP distribution in G2 and prophase. Aurora B kinase associates with centromeres during G2 and M. Immunofluorescence with anti–Aim-1 (Aim-1/Aurora B, green) and DAPI (DNA, blue). (a) Early G2 cells with hACA to detect centromeres (red), demonstrating that Aurora B associates with centromeres well before mitosis. (b) Mid G2 cells show clear colocalization of Aurora B and H3P-positive pericentric heterochromatin (red). (c) Late G2 cells with general distribution of Aurora B throughout the nuclei, at a time when H3P signal is present throughout the chromatin (red). (d) Prophase cells (with visible chromosome condensation judged by DAPI staining) with anti–CENP-A-Ser7P (red), showing that Aurora B associates with centromeres when CENP-A phosphorylation begins. Insets show that anti–CENP-A-Ser7P stains kinetochores, whereas Aurora B is detected in the inner centromere domain. (e) Early G2 cells show more Aurora B signals (green) than INCENP signals (red), with partial colocalization. (f) Mid G2 cells show more Aurora B signals, with an increase in INCENP signals and partial colocalization. (g) Late G2 cells with general distribution of Aurora B, and less INCENP signal in very few, larger foci. (h) Prophase cells with Aurora B distributed as in panel d, but INCENP does not colocalize with Aurora B concentrations at centromeres (yellow color would indicate overlap). Bar, 10 μm.
Figure 2.
Aurora B phosphorylates the NH 2 termini of histone H3 and CENP-A in vitro. Arrows indicate the migration of CENP-A–GST. (a) Immunoprecipitated Aurora B phosphorylates both H3 and CENP-A NH2 termini expressed as GST fusions. Top, representative Coomassie stain of SDS-PAGE. Lower bands are GST alone or fused to the NH2 terminus of either H3 or CENP-A; upper bands are antibody light chain, either anti–Aim-1 or control isotype-matched mouse IgG1. Also shown are mock reactions where GST fusions were mixed with the protein G sepharose beads used in immunoprecipitation. Bottom, autoradiogram of the same gel. Aurora B clearly phosphorylates the H3 and CENP-A NH2 termini. No signal is seen in either of the negative controls when the Aurora B antibody is not present. (b) Aurora B immunoprecipitation significantly concentrates the Aurora B kinase activity. Whole extract mixed with GST fusions does not result in phosphorylation of CENP-A or H3 NH2 termini (extract), and the Aurora B antibody alone contains no kinase activity (antibody). Whole extract alone allowed to autophosphorylate does not reveal CENP-A or H3 bands (auto). (c) Ser7 is a target Aurora B phosphorylation site in the CENP-A NH2 terminus. Aurora B immunoprecipitations were mixed with the CENP-A NH2-terminal GST fusion (WT), or site-directed mutants of this construct (S7A and S7E). CENP-A phosphorylation is reduced 50% by mutation of Ser7; however, it is not abolished. Immunoprecipitation with an irrelevant antibody (mouse IgG1) is negative. (d) Mutation of CENP-A Ser7 abolishes reactivity with the anti–CENP-A-Ser7P antibody. GST fusion proteins were incubated with immunoprecipitated Aurora B in the presence of cold ATP before Western blotting. Top, ponceau stain; bottom, Western blot. Only wild-type CENP-A reacts positively with the Ser7P antibody. There is no cross-reaction with GST or the NH2 terminus of H3, and mutation of Ser7 to alanine (S7A) or glutamate (S7E; unpublished data) abolishes reactivity.
Figure 3.
Expression of CENP-A Ser7 mutants in HeLa cells. (a) Western blot with sequential detection using two antibodies: 12CA5 to detect the epitope tag (HA), followed by hACA to detect endogenous CENP-A. C4 cells are epitope-tagged wild-type; S7A-8 and S7E-4 are representative mutant cell lines. Cells were collected either uninduced (”un”) or induced for 24 h by removal of tetracycline (”in”). (b) CENP-A mutant cell lines have normal kinetochore and spindle structure. Interphase (top) and mitotic cells (second row) with DNA (DAPI, blue), epitope tag (anti-HA, green), and centromeres (hACA, red). Bottom two rows, anti–CENP-C (red) and anti–CENP-E (red), respectively, with DAPI (DNA, blue) and antitubulin (green). (c) CENP-A mutant cell lines have normal cell-cycle profiles. DNA was detected with propidium iodide and analyzed by flow cytometry (representative profile shown as inset). TTA is the parental cell line with no epitope tag, C4 is wild-type epitope–tagged CENP-A, and S7A and S7E are each averaged values for two independent cell lines (S7A-8, S7A-18, S7E-4, and S7E-12). All cell lines appear to be similar within the standard deviation of five independent experiments (error bars). Bar, 10 μm.
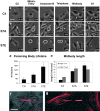
Figure 4.
Live cell analysis: Flemming body lifetime and midbody length. (a–c) Cell division was visualized by live cell phase contrast microscopy at a magnification of 20×. Representative cells are shown for each stage of cell division (TTA cells closely resembled C4; unpublished data). For videos, see online supplemental material available at
http://www.jcb.org/cgi/content/full/jcb.200108125/DC1
. Cells were followed from interphase through initial rounding up, cell division, and reflattening until they ultimately separated. Midbodies were easily detectable in S7A and S7E cells but were smaller, and sometimes not visible, in C4. Arrows indicate cells of interest, midbodies, and newly separated cells. Times shown are hours:minutes, with the time of Flemming body appearance set to zero. (d) CENP-A mutant cell lines exhibit significantly longer midbody lifetimes than wild-type cells filmed under identical conditions of substrate attachment and cell seeding density. Images were taken once every 2 min. Midbody lifetimes were measured beginning when a visible Flemming body became visible between the two daughter cells, and ending when the midbody split, at which time the Flemming body was engulfed by one of the daughter cells and cell separation was considered complete. Standard error is shown for each cell line (bars). (e) Midbody lengths are shown in μm (± standard error) from videos of live cells (black) compared with lengths from fixed cells stained with antitubulin (gray). For live analysis, the length of the intercellular bridge was measured at each time point of 2 min, from when it first became visible to when the two cells completed separation and the Flemming body was engulfed by one of the daughter cells. These values were then averaged for each cell over time, and averaged again across the total number of cells filmed in this way (n = 7, 12, and 7 for C4, S7A, and S7E, respectively). Midbodies were observed to oscillate in a stretching motion before breaking at their maximum length. For fixed analysis, asynchronous cells were stained with antitubulin and a minimum of 150 cells were counted for each cell line. Midbody lengths for both mutants are significantly different from wild-type (P = 0) based on Chi-squared analysis. (f and g) Midbody morphology. The brightly labeled tubulin bundle (red) does not exactly match the length of the intercellular bridge (DIC). (f) In early cytokinesis, the tubulin bundle is longer than the intercellular bridge, defined as the distance between the two cell bodies. (g) In late cytokinesis, the tubulin bundle is shorter than the intercellular bridge, thus leaving an unstained gap between the end of the tubulin bundle and the edge of the cell body. Bars, 10 μm.
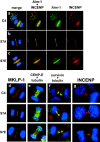
Figure 5.
Passenger and motor protein localization in CENP-A mutant cell lines. (a–c) Immunofluorescence to detect DNA (blue), Aurora B (green), and INCENP (red). In both wild-type (C4) and S7A cells, Aurora B and INCENP are localized only at the midzone during anaphase, while in S7E cells Aurora B and INCENP are also detected on chromosomes (bottom row, third panel). (d–i) DNA is shown in blue (DAPI) in all panels. d, MKLP-1 (red); e, CENP-E (red, with tubulin in green) at the midzone. f, survivin (red, with tubulin in green); g, INCENP (red) at the midbody.
Figure 6.
PP1γ1 is mislocalized in CENP-A mutant cell lines. (a–c) Protein phosphatase 1γ1 localizes to midbodies in wild-type but is delocalized in S7A and S7E cells. Midbodies are shown with Aurora B in red and PP1γ1 in green. (a) PP1γ1 is detectable in the midbodies of wild-type S7A (b) cells (colocalization appears yellow in “merge”), but is not detected in midbodies of S7E cells (arrow) (c). PP1γ1 is delocalized throughout S7A cells, but is undetectable in telophase nuclei of wild-type cells. Insets show detail of the midbody. Bar, 10 μm.
Similar articles
- Centromere localization of INCENP-Aurora B is sufficient to support spindle checkpoint function.
Becker M, Stolz A, Ertych N, Bastians H. Becker M, et al. Cell Cycle. 2010 Apr 1;9(7):1360-72. doi: 10.4161/cc.9.7.11177. Epub 2010 Apr 1. Cell Cycle. 2010. PMID: 20372054 - Analysis of mitotic phosphorylation of borealin.
Kaur H, Stiff AC, Date DA, Taylor WR. Kaur H, et al. BMC Cell Biol. 2007 Jan 22;8:5. doi: 10.1186/1471-2121-8-5. BMC Cell Biol. 2007. PMID: 17241471 Free PMC article. - Aurora-C and Aurora-B share phosphorylation and regulation of CENP-A and Borealin during mitosis.
Slattery SD, Moore RV, Brinkley BR, Hall RM. Slattery SD, et al. Cell Cycle. 2008 Mar 15;7(6):787-95. doi: 10.4161/cc.7.6.5563. Epub 2008 Mar 4. Cell Cycle. 2008. PMID: 18239465 - Phosphorylation of histone and histone-like proteins by aurora kinases during mitosis.
Pascreau G, Arlot-Bonnemains Y, Prigent C. Pascreau G, et al. Prog Cell Cycle Res. 2003;5:369-74. Prog Cell Cycle Res. 2003. PMID: 14593731 Review. - Role of chromosomal passenger complex in chromosome segregation and cytokinesis.
Terada Y. Terada Y. Cell Struct Funct. 2001 Dec;26(6):653-7. doi: 10.1247/csf.26.653. Cell Struct Funct. 2001. PMID: 11942622 Review.
Cited by
- Mitotic failures in cancer: Aurora B kinase and its potential role in the development of aneuploidy.
Hegyi K, Méhes G. Hegyi K, et al. Pathol Oncol Res. 2012 Oct;18(4):761-9. doi: 10.1007/s12253-012-9534-8. Epub 2012 Jul 29. Pathol Oncol Res. 2012. PMID: 22843098 Review. - Cyc17, a meiosis-specific cyclin, is essential for anaphase initiation and chromosome segregation in Tetrahymena thermophila.
Yan GX, Dang H, Tian M, Zhang J, Shodhan A, Ning YZ, Xiong J, Miao W. Yan GX, et al. Cell Cycle. 2016 Jul 17;15(14):1855-64. doi: 10.1080/15384101.2016.1188238. Epub 2016 May 18. Cell Cycle. 2016. PMID: 27192402 Free PMC article. - Centromere identity: a challenge to be faced.
Mehta GD, Agarwal MP, Ghosh SK. Mehta GD, et al. Mol Genet Genomics. 2010 Aug;284(2):75-94. doi: 10.1007/s00438-010-0553-4. Epub 2010 Jun 29. Mol Genet Genomics. 2010. PMID: 20585957 Review. - Epigenetic centromere specification directs aurora B accumulation but is insufficient to efficiently correct mitotic errors.
Bassett EA, Wood S, Salimian KJ, Ajith S, Foltz DR, Black BE. Bassett EA, et al. J Cell Biol. 2010 Jul 26;190(2):177-85. doi: 10.1083/jcb.201001035. Epub 2010 Jul 19. J Cell Biol. 2010. PMID: 20643881 Free PMC article. - Breast tumor subgroups reveal diverse clinical prognostic power.
Liu Z, Zhang XS, Zhang S. Liu Z, et al. Sci Rep. 2014 Feb 6;4:4002. doi: 10.1038/srep04002. Sci Rep. 2014. PMID: 24499868 Free PMC article.
References
- Adams, R.R., M. Carmena, and W.C. Earnshaw. 2001. a. Chromosomal passengers and the (aurora) ABCs of mitosis. Trends Cell Biol. 11:49–54. - PubMed
- Adams, R.R., S.P. Wheatleya, A.M. Gouldsworthy, S.E. Kandels-Lewis, M. Carmena, C. Smythe, D.L. Gerloff, and W.C. Earnshaw. 2000. INCENP binds the Aurora-related kinase AIRK2 and is required to target it to chromosomes, the central spindle and cleavage furrow. Curr. Biol. 10:1075–1078. - PubMed
- Allshire, R.C. 1997. Centromeres, checkpoints and chromatid cohesion. Curr. Opin. Genet. Dev. 7:264–273. - PubMed
Publication types
MeSH terms
Substances
LinkOut - more resources
Full Text Sources
Other Literature Sources
Molecular Biology Databases
Miscellaneous


