Synaptic connections between layer 4 spiny neurone-layer 2/3 pyramidal cell pairs in juvenile rat barrel cortex: physiology and anatomy of interlaminar signalling within a cortical column - PubMed (original) (raw)
Synaptic connections between layer 4 spiny neurone-layer 2/3 pyramidal cell pairs in juvenile rat barrel cortex: physiology and anatomy of interlaminar signalling within a cortical column
Dirk Feldmeyer et al. J Physiol. 2002.
Abstract
Whole-cell voltage recordings were obtained from 64 synaptically coupled excitatory layer 4 (L4) spiny neurones and L2/3 pyramidal cells in acute slices of the somatosensory cortex ('barrel' cortex) of 17- to 23-days-old rats. Single action potentials (APs) in the L4 spiny neurone evoked single unitary EPSPs in the L2/3 pyramidal cell with a peak amplitude of 0.7 +/- 0.6 mV. The average latency was 2.1 +/- 0.6 ms, the rise time was 0.8 +/- 0.3 ms and the decay time constant was 12.7 +/- 3.5 ms. The percentage of failures of an AP in a L4 spiny neurone to evoke a unitary EPSP in the L2/3 pyramidal cell was 4.9 +/- 8.8 % and the coefficient of variation (c.v.) of the unitary EPSP amplitude was 0.27 +/- 0.13. Both c.v. and percentage of failures decreased with increased average EPSP amplitude. Postsynaptic glutamate receptors (GluRs) in L2/3 pyramidal cells were of the N-methyl-D-aspartate (NMDA) receptor (NMDAR) and the non-NMDAR type. At -60 mV in the presence of extracellular Mg2+ (1 mM), 29 +/- 15 % of the EPSP voltage-time integral was blocked by NMDAR antagonists. In 0 Mg2+, the NMDAR/AMPAR ratio of the EPSC was 0.50 +/- 0.29, about half the value obtained for L4 spiny neurone connections. Burst stimulation of L4 spiny neurones showed that EPSPs in L2/3 pyramidal cells depressed over a wide range of frequencies (1-100 s(-1) ). However, at higher frequencies (30 s(-1)) EPSP summation overcame synaptic depression so that the summed EPSP was larger than the first EPSP amplitude in the train. The number of putative synaptic contacts established by the axonal collaterals of the L4 projection neurone with the target neurone in layer 2/3 varied between 4 and 5, with an average of 4.5 +/- 0.5 (n = 13 pairs). Synapses were established on basal dendrites of the pyramidal cell. Their mean geometric distance from the pyramidal cell soma was 67 +/- 34 microm (range, 16-196 microm). The results suggest that each connected L4 spiny neurone produces a weak but reliable EPSP in the pyramidal cell. Therefore transmission of signals to layer 2/3 is likely to have a high threshold requiring simultaneous activation of many L4 neurons, implying that L4 spiny neurone to L2/3 pyramidal cell synapses act as a gate for the lateral spread of excitation in layer 2/3.
Figures
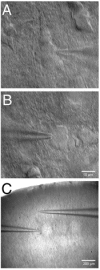
Figure 1. Pair of spiny stellate and L2/3 pyramidal cells
A and B, infrared gradient contrast images of a postsynaptic pyramidal cell in layer 2/3 (A) and a presynaptic spiny stellate cell in layer 4 (B). C, layers 4 and 2/3, including pia and pipette locations. The barrel structure at the level of layer 4 is clearly visible. The distances of the somata of pre- and postsynaptic neurones were between 70 and 510 μm.
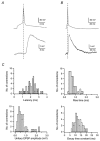
Figure 2. Latency of unitary EPSPs in a L4 spiny neurone-L2/3 pyramidal cell connection
A, presynaptic AP (top trace) and unitary EPSPs (bottom traces) recorded from a synaptic connection between a L4 spiny neurone and L2/3 pyramidal cell. Note that there is only very little variation in latencies. B, latency distribution of unitary EPSPs, determined between the peak of the presynaptic AP and the onset of the EPSP. Note that the distribution of latencies for a single connection is very narrow. C, plot of mean latencies against the mean unitary EPSP amplitudes. There was a tendency towards longer latencies with decreasing EPSP amplitude. This relationship was, however, not significant. The correlation coefficient is −0.42.
Figure 11. Reconstruction of a synaptically connected pair of a L4 spiny stellate cell and a L2/3 pyramidal cell
Camera lucida reconstruction of a spiny stellate cell and a L2/3 pyramidal cell. The dendritic configuration of the presynaptic spiny stellate cell is drawn in red, the axon in blue; Note that the axon of the spiny stellate cell is confined to the ‘home’ column in which the somata of the neurones are located. The axonal projection of the pyramidal neurones were seen to project across several columns. The postsynaptic L2/3 pyramidal cell is drawn in black with its axon in green. The grey shaded area represents the L4 barrel in which the spiny stellate neurone was located. Inset, four putative synaptic contacts by the axonal arborisation of the spiny stellate cell with the dendrites of the L2/3 pyramidal cell are marked by blue dots.
Figure 3. Time course and amplitude of EPSPs in L2/3 pyramidal cells of the barrel cortex
A and B, time course of EPSP rise and decay, respectively, on two different time scales (same recording). Traces represent averages of 20 unitary EPSPs evoked by single APs in a spiny stellate cell. C, histograms of EPSP latencies, 20–80 % rise times, unitary EPSP amplitudes and decay time constants in an L2/3 pyramidal cell. Decay times were obtained by fitting a single exponential to the decay phase of unitary EPSPs recorded in the presence of either
d
-AP5 or 7-chlorokynurenate to block the NMDAR component of the EPSP. The mean latency of unitary EPSPs was 2.1 ± 0.6 ms, the mean rise time 0.8 ± 0.3 ms, the mean decay time 12.7 ± 3.5 ms and the mean EPSP amplitude 0.7 ± 0.6 mV.
Figure 4. Relationship between EPSP amplitude and soma distance
A, distribution of EPSP latency vs. distance between pre- and postsynaptic somata. There was a tendency towards longer EPSP latencies with increased soma distance (correlation coefficient 0.51). B, mean EPSP latency for connections with a L4-L2/3 soma distance of 70–250 and 250–510 μm. * the difference between these two groups was significant (Student's unpaired t test, P > 0.001). C, distribution of EPSP amplitude vs. distance of the layer 2/3 pyramidal cell from the layer 4 border. There was a tendency towards smaller EPSP amplitudes with increased distance of the L2/3 pyramidal cell from the L4 border (correlation coefficient −0.38). D, mean EPSP amplitude for L4-L2/3 connections, for which the L2/3 pyramidal cell was either 50–200 or 200–400 μm away from the L4 border. * the difference between these two groups was statistically significant (Student's unpaired t test, P = 0.02).
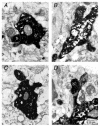
Figure 12. Electron microscopic identification of synaptic contacts between neurones in layer 4 and layer 2/3
Electron micrographs of the synaptic contacts of the cell pair shown in Fig. 11. All four light microscopically identified synaptic contacts were identified at the electron microscopic level. The synaptic boutons (b) of the spiny stellate axon collaterals are clearly identifiable by their content of transmitter vesicles. Contacts A-C are on dendritic shafts (d) while contact D is on a dendritic spine (s) of the L2/3 pyramidal cell. Scale bar applies to all four panels.
Figure 5. Time course of EPSCs in L2/3 pyramidal cells of the barrel cortex
A, time course of an averaged unitary EPSC and unitary EPSP in normal extracellular solution recorded from the same L2/3 pyramidal cell in response to a single AP in the spiny stellate cell. Note that the EPSC is rising and decaying much more rapidly than the EPSP. B-D, histograms of EPSC 20–80 % rise times, latencies and decay time constants in L2/3 pyramidal cells recorded in the presence of
d
-AP5. The mean 20–80 % rise time of unitary EPSPs was 0.33 ± 0.11 ms, the mean latency 1.86 ± 0.51 ms and the mean decay time constant 1.97 ± 0.70 ms.
Figure 6. NMDAR component of unitary EPSPs and EPSCs in L2/3 pyramidal cells
A, unitary EPSP measured in a pyramidal cell before (control) and after the addition of 10 μ
m
NBQX to the bath solution (containing 1 m
m
Mg2+)to isolate the NMDAR mediated component. Traces are averages of 50 sweeps. The membrane potential was set to −60 mV during the recording. The line labelled ‘subtraction’ represents the EPSP component mediated by NMDARs obtained by subtraction of the EPSP in AP5-containing saline from that in control saline. B, histogram of the functional NMDAR mediated EPSP integral expressed as a fraction of the total integral of the unitary EPSP. The mean integral of the NMDAR mediated EPSP was 28.8 ± 15.1 % of that in the absence of the AMPAR antagonist. C, unitary EPSCs measured in a pyramidal cell before (control) and after addition of 50 μ
m d
-AP5 to a ‘0 Mg2+’ bath solution to isolate the NMDAR mediated component. The postsynaptic neurone was held at a membrane potential of −60 mV. The line labelled ‘subtraction’ represents the NMDAR component of the EPSC and was obtained by subtracting the peak current in the presence and absence of
d
-AP5. D, ratio of peak AMPAR current vs. peak NMDAR current plotted for 12 cell pairs held at −60 mV. The mean NMDAR/AMPAR ratio was 0.50 ± 0.29. The dashed line represents unity, i.e. when the peak AMPAR current is equal to the peak NMDAR current.
Figure 7. Reliability of synaptic connections between L4 spiny stellate cells and L2/3 pyramidal cells
A, examples of ten successive EPSPs (middle traces) in response to a presynaptic AP (top trace); the bottom trace represents the average EPSP waveform. B, fluctuation of EPSP amplitudes in a single experiment. Each • represents the peak amplitude of a unitary EPSP. C, distribution of the c.v.s of unitary EPSPs in 64 L4-L2/3 connections. D, histogram showing the failure rate (in %) in morphologically identified pairs between L4 spiny neurones and L2/3 pyramidal cells. For each connection, the failure rate was determined from 50–300 single AP stimulations (frequency 0.05−0.033 s−1).
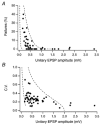
Figure 8. Decrease of failure rate and coefficient of variation with increasing EPSP amplitude
A, percentage of failures plotted as a function of the unitary EPSP peak amplitude in connections between L4 spiny neurones and L2/3 pyramidal cells. B, c.v. plotted as a function of the EPSP peak amplitude in L2/3 pyramidal cell neurones (n = 64). The two dashed lines in A and B represent the predictions of binomial release statistics for the percentage of failures as a function of EPSP amplitude with n = 5 contacts (close to the average number of contacts, Table 3) and quantal amplitudes of 0.04 mV (right) and) 0.4 mV (left).The release probability increases from 0.08 to 0.6 (right) and from 0.05 to 1.0 (left). The _p_r values refer to the two end-points of each curve.
Figure 9. Short-term plasticity and EPSP summation
A, train of five EPSPs at different interstimulus intervals (10, 30, 100, 300 and 1000 ms as indicated to the left) with the EPSP rising phase superimposed. EPSP amplitude depression was apparent at all frequencies tested while summation of EPSPs is only apparent at interstimulus intervals of 10 and 30 ms. The horizontal scale bar corresponds to the interstimulus time of each train. B, amplitude ratios plotted as a function of the interstimulus interval. For short interstimulus intervals (10 and 30 ms), the baseline to determine the EPSP amplitudes in the train was obtained by linear extrapolation of the decay phase of the preceding EPSP. C, postsynaptic peak response as a fraction of the amplitude of the first EPSP in a train plotted as a function of the interstimulus interval. Only at interstimulus intervals of 10 and 30 ms was EPSP summation observed.
Figure 13. Geometric dendrogram of a pair of synaptically connected neurones
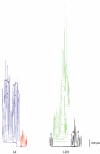
Geometric dendrogram of a L4-L2/3 synaptic connection. Right, dendritic (black) and axonal (green) arborisation of the postsynaptic L2/3 pyramidal cell. The blue circles indicate synaptic contacts. Left, dendritic (red) and axonal (blue) arborisation of the presynaptic L4 spiny stellate cell. Synaptic contacts are indicated by blue dots on both the presynaptic (blue) axon and the postsynaptic (black) dendrites. Numbers identify the axonal collaterals and dendritic branches between which synaptic contacts were established. Note that contacts are made preferentially on the thin basal dendrites.
Figure 10. Photomicrograph of a synaptically coupled L4 spiny stallate cell and a L2/3 pyramidal cell
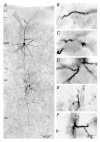
A, low magnification light microscopic image of a synaptically coupled L4 spiny stellate-L2/3 pyramidal cell pair filled with biocytin showing the dendritic configuration of the two neurones. Note the typical asymmetric dendritic configuration of the spiny stellate neurone that is confined to layer 4 whereas the pyramidal cell shows a symmetric basal dendritic field and an apical dendrite with an extensive terminal tuft. B-E, putative synaptic and F, autaptic contacts made by axon collaterals of L4 cells on dendrites of L2/3 pyramidal cells. Contacts were made preferentially on basal dendrites of pyramidal cells.
Figure 14. Location of synaptic contacts on dendrites
A, histogram of geometric distances from the somata of visually (i.e. on the light microscopic level) identified putative synaptic contacts in 13 pairs of L4 spiny neurone-L2/3 pyramidal cells. Inset, distribution of number of synaptic contacts per connection. B, relationship between unitary EPSP amplitude in L2/3 pyramidal cells and the number of synaptic contacts per connection. The correlation coefficient r obtained for (B) was 0.434 and the slope was 0.0813 mV contact−1. C, relationship between unitary EPSP amplitude and the dendritic mean geometric distance of synaptic contacts in a connection. The correlation coefficient r was 0.565 and the slope 0.00432 mVμm−1. For both graphs, the correlation was not statistically significant.
Similar articles
- Reliable synaptic connections between pairs of excitatory layer 4 neurones within a single 'barrel' of developing rat somatosensory cortex.
Feldmeyer D, Egger V, Lubke J, Sakmann B. Feldmeyer D, et al. J Physiol. 1999 Nov 15;521 Pt 1(Pt 1):169-90. doi: 10.1111/j.1469-7793.1999.00169.x. J Physiol. 1999. PMID: 10562343 Free PMC article. - Physiology and anatomy of synaptic connections between thick tufted pyramidal neurones in the developing rat neocortex.
Markram H, Lübke J, Frotscher M, Roth A, Sakmann B. Markram H, et al. J Physiol. 1997 Apr 15;500 ( Pt 2)(Pt 2):409-40. doi: 10.1113/jphysiol.1997.sp022031. J Physiol. 1997. PMID: 9147328 Free PMC article. - Efficacy and connectivity of intracolumnar pairs of layer 2/3 pyramidal cells in the barrel cortex of juvenile rats.
Feldmeyer D, Lübke J, Sakmann B. Feldmeyer D, et al. J Physiol. 2006 Sep 1;575(Pt 2):583-602. doi: 10.1113/jphysiol.2006.105106. Epub 2006 Jun 22. J Physiol. 2006. PMID: 16793907 Free PMC article. - From single cells and single columns to cortical networks: dendritic excitability, coincidence detection and synaptic transmission in brain slices and brains.
Sakmann B. Sakmann B. Exp Physiol. 2017 May 1;102(5):489-521. doi: 10.1113/EP085776. Epub 2017 Apr 21. Exp Physiol. 2017. PMID: 28139019 Free PMC article. Review. - Shared and divergent principles of synaptic transmission between cortical excitatory neurons in rodent and human brain.
de Kock CPJ, Feldmeyer D. de Kock CPJ, et al. Front Synaptic Neurosci. 2023 Sep 5;15:1274383. doi: 10.3389/fnsyn.2023.1274383. eCollection 2023. Front Synaptic Neurosci. 2023. PMID: 37731775 Free PMC article. Review.
Cited by
- Extracellular glutamate is not modulated by cannabinoid receptor activity.
Chiu DN, Carter BC. Chiu DN, et al. Sci Rep. 2024 Nov 6;14(1):26889. doi: 10.1038/s41598-024-75962-5. Sci Rep. 2024. PMID: 39505963 Free PMC article. - A layered microcircuit model of somatosensory cortex with three interneuron types and cell-type-specific short-term plasticity.
Jiang HJ, Qi G, Duarte R, Feldmeyer D, van Albada SJ. Jiang HJ, et al. Cereb Cortex. 2024 Sep 3;34(9):bhae378. doi: 10.1093/cercor/bhae378. Cereb Cortex. 2024. PMID: 39344196 Free PMC article. - Variation and convergence in the morpho-functional properties of the mammalian neocortex.
Mahon S. Mahon S. Front Syst Neurosci. 2024 Jun 20;18:1413780. doi: 10.3389/fnsys.2024.1413780. eCollection 2024. Front Syst Neurosci. 2024. PMID: 38966330 Free PMC article. Review. - Differences in the consolidation by spontaneous and evoked ripples in the presence of active dendrites.
Jauch J, Becker M, Tetzlaff C, Fauth MJ. Jauch J, et al. PLoS Comput Biol. 2024 Jun 25;20(6):e1012218. doi: 10.1371/journal.pcbi.1012218. eCollection 2024 Jun. PLoS Comput Biol. 2024. PMID: 38917228 Free PMC article. - Synchronization of delayed coupled neurons with multiple synaptic connections.
Shavikloo M, Esmaeili A, Valizadeh A, Madadi Asl M. Shavikloo M, et al. Cogn Neurodyn. 2024 Apr;18(2):631-643. doi: 10.1007/s11571-023-10013-9. Epub 2023 Nov 10. Cogn Neurodyn. 2024. PMID: 38699603
References
- Agmon A, Connors BW. Thalamocortical responses of mouse somatosensory (barrel) cortex in vitro. Neuroscience. 1991;41:365–380. - PubMed
- Ahissar E, Sosnik R, Haidarliu S. Transformation from temporal to rate coding in a somatosensory thalamocortical pathway. Nature. 2000;406:302–306. - PubMed
- Ahmed B, Anderson JC, Douglas RJ, Martin KAC, Nelson JC. Polyneuronal innervation of spiny stellate neurons in cat visual cortex. Journal of Comparative Neurology. 1994;341:39–49. - PubMed
- Armstrong-James M, Fox K. Spatiotemporal convergence and divergence in the rat S1 ‘barrel’ cortex. Journal of Comparative Neurology. 1987;263:265–281. - PubMed
- Armstrong-James M, Fox K, Das-Gupta A. Flow of excitation within rat barrel cortex on striking a single vibrissa. Journal of Neurophysiology. 1992;68:1345–1358. - PubMed
Publication types
MeSH terms
Substances
LinkOut - more resources
Full Text Sources
Miscellaneous
