Prominent neurodegeneration and increased plaque formation in complement-inhibited Alzheimer's mice - PubMed (original) (raw)
Prominent neurodegeneration and increased plaque formation in complement-inhibited Alzheimer's mice
Tony Wyss-Coray et al. Proc Natl Acad Sci U S A. 2002.
Abstract
Abnormal accumulation of beta-amyloid (Abeta) in Alzheimer's disease (AD) is associated with prominent brain inflammation. Whereas earlier studies concluded that this inflammation is detrimental, more recent animal data suggest that at least some inflammatory processes may be beneficial and promote Abeta clearance. Consistent with these observations, overproduction of transforming growth factor (TGF)-beta1 resulted in a vigorous microglial activation that was accompanied by at least a 50% reduction in Abeta accumulation in human amyloid precursor protein (hAPP) transgenic mice. In a search for inflammatory mediators associated with this reduced pathology, we found that brain levels of C3, the central component of complement and a key inflammatory protein activated in AD, were markedly higher in hAPP/TGF-beta1 mice than in hAPP mice. To assess the importance of complement in the pathogenesis of AD-like disease in mice, we inhibited C3 activation by expressing soluble complement receptor-related protein y (sCrry), a complement inhibitor, in the brains of hAPP mice. Abeta deposition was 2- to 3-fold higher in 1-year-old hAPP/sCrry mice than in age-matched hAPP mice and was accompanied by a prominent accumulation of degenerating neurons. These results indicate that complement activation products can protect against Abeta-induced neurotoxicity and may reduce the accumulation or promote the clearance of amyloid and degenerating neurons. These findings provide evidence for a role of complement and innate immune responses in AD-like disease in mice and support the concept that certain inflammatory defense mechanisms in the brain may be beneficial in neurodegenerative disease.
Figures
Fig 1.
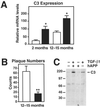
Increased complement C3 expression in hAPP/TGF-β1 and TGF-β1 transgenic mice. (A) Brains from hAPP (white bars) and hAPP/TGF-β1 (black bars) mice at the indicated ages were divided sagitally, and relative C3 mRNA levels were measured by RNase protection assay in one hemibrain. (B) In the opposite hemibrain, average numbers of thioflavin S-positive plaques per 40-μm brain section (5–6 sections per mouse; hippocampus plus neocortex) were counted. Values are mean ± SEM from 4–6 mice per group. *, P < 0.05; **, P < 0.001 by t test. (C) Western blot analysis of solubilized total brain homogenates from 15-month-old hAPP, hAPP/TGF-β1, TGF-β1, and nontransgenic littermate mice was performed under nonreducing conditions with an anti-C3 (C3c) antibody. The α/β dimer of C3 (185 kDa) is indicated on the right.
Fig 2.
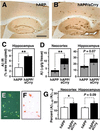
Increased Aβ accumulation and amyloid formation in hAPP/sCrry mice. (_A_– F) Brains from 10- to 12-month-old hAPP (n = 6) and hAPP/sCrry (n = 8) mice were dissected and analyzed for Aβ accumulation and amyloid formation. (A and B) Aβ immunostaining in the hippocampus and neocortex of an hAPP (A) and an hAPP/sCrry (B) mouse. (C) The area occupied by Aβ immunoreactivity was significantly larger in hAPP/sCrry than in hAPP mice. Values are mean ± SEM. **, P < 0.01 by t test. (D) Total Aβ (Aβ1-x, black + gray bars) and Aβ1–42 levels (gray bars) in neocortex and hippocampus of hAPP and hAPP/sCrry mice. Values are mean ± SEM. **, P = 0.028; *, P = 0.039 by t test. (E and F) Congo red staining in the hippocampus of an hAPP/sCrry mouse viewed with crosspolarized filters (E) or under normal light (F). (G) Aβ1–42/Aβ1-x ratios in neocortex and hippocampus of 3-month-old hAPP/sCrry (n = 9; black bars) and hAPP (n = 8; white bars) mice as measured by ELISA. Values are mean ± SEM. *, P < 0.05 by t test. [Scale bars: 250 μm (A and B), 100 μm (E and F).]
Fig 3.
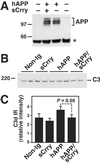
Transgene and complement expression in hAPP and hAPP/sCrry brains. (A) Similar levels of hAPP were detected in hippocampal homogenates from 3-month-old hAPP and hAPP/sCrry mice by Western blot analysis with the 8E5 antibody. APP, hAPP isoforms; asterisk indicates a nonspecific band. (B) Similar levels of C3 were detected in hippocampal homogenates from 3-month-old mice of four genotypes by Western blot analysis with an anti-C3 (C3c) antibody. (C) Relative C3d immunoreactivity (IR) in the stratum radiatum of the CA3 hippocampal region of 12-month-old mice calculated from four measurements per case. Values are mean ± SEM from three mice per genotype.
Fig 4.
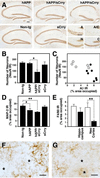
Prominent neurodegeneration and reduced microgliosis in hAPP/sCrry mice. Brain sections from 10- to 12-month-old mice from a cross of hAPP with sCrry mice were analyzed for neurodegeneration and microglial activation. (A) NeuN immunostaining of 40-μm brain sections showed a prominent decrease in staining in the hippocampal CA3 region in hAPP/sCrry compared with single transgenic or nontransgenic (Non-tg) mice. The four panels in the bottom right corner show the CA3c subregion of the hAPP (A), sCrry (C), Non-tg (N), and the hAPP/sCrry (A/C) mouse in the upper right corner at higher magnification. (B) The number of NeuN-immunoreactive (IR) neurons in the CA2/CA3 region of the hippocampus was strongly reduced in hAPP/sCrry mice compared with littermate controls. Bars represent mean ± SEM from three sections per mouse and 5–8 mice per genotype. *, P < 0.05 by Tukey–Kramer test. (C) Relative numbers of NeuN-positive neurons in the CA2/CA3 region of the hippocampus of hAPP (○) and hAPP/sCrry (•) mice plotted against the percent area occupied by Aβ immunoreactive deposits (3D6 antibody). (D) Dendritic integrity determined as percent area occupied by MAP-2 immunoreactive dendrites in the stratum radiatum of the CA3 subfield of the hippocampus was reduced in hAPP and hAPP/sCrry mice. Bars represent mean ± SEM from 5–8 mice per genotype. *, P < 0.05; **, P < 0.01 by Tukey–Kramer test. (E) Microglial activation determined as the relative area of F4/80 immunoreactive products in the hippocampus or the midfrontal cortex was reduced in hAPP/sCrry (black bars) compared with hAPP (white bars) mice. Bars are mean ± SEM from 5–8 mice per group. **, P = 0.008 by t test. (F and G) Microglia surrounding amyloid plaques (indicated by asterisks) appear more activated and express more F4/80 immunoreactivity in hAPP (F) than in hAPP/sCrry (G) mice. [Scale bars: 100 μm (A), 20 μm (F and G).]
Fig 5.
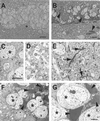
Accumulation of degenerating neurons in hAPP/sCrry mice. Brain sections from 12-month-old nontransgenic (A, C, and D) or hAPP/sCrry mice (B and E–G) were stained with toluidine blue and viewed by light microscopy (A and B) or analyzed by electron microscopy (C–G). (A and B) Dentate gyrus of a nontransgenic (A) or hAPP/sCrry mouse (B) with darkly stained degenerating cells (arrow heads). (C and D) Normal appearing neurons (asterisks) in the dentate gyrus (C) and neuropil (D) in the hippocampal CA3 region of a nontransgenic mouse. (E) Degenerating neurites (arrows) in the CA3 region of the hippocampus in a hAPP/sCrry mouse. (F and G) Neurons with different degrees of electron density (arrow heads) indicating different degrees of degeneration in the dentate gyrus (F) or CA3 pyramidal layer (G). Asterisks mark healthy-appearing neurons. [Scale bars: 25 μm (A and B), 10 μm (C–F), 3 μm (G).]
Similar articles
- Complement C3 deficiency leads to accelerated amyloid beta plaque deposition and neurodegeneration and modulation of the microglia/macrophage phenotype in amyloid precursor protein transgenic mice.
Maier M, Peng Y, Jiang L, Seabrook TJ, Carroll MC, Lemere CA. Maier M, et al. J Neurosci. 2008 Jun 18;28(25):6333-41. doi: 10.1523/JNEUROSCI.0829-08.2008. J Neurosci. 2008. PMID: 18562603 Free PMC article. - Astrocyte-Microglia Cross Talk through Complement Activation Modulates Amyloid Pathology in Mouse Models of Alzheimer's Disease.
Lian H, Litvinchuk A, Chiang AC, Aithmitti N, Jankowsky JL, Zheng H. Lian H, et al. J Neurosci. 2016 Jan 13;36(2):577-89. doi: 10.1523/JNEUROSCI.2117-15.2016. J Neurosci. 2016. PMID: 26758846 Free PMC article. - High-level neuronal expression of abeta 1-42 in wild-type human amyloid protein precursor transgenic mice: synaptotoxicity without plaque formation.
Mucke L, Masliah E, Yu GQ, Mallory M, Rockenstein EM, Tatsuno G, Hu K, Kholodenko D, Johnson-Wood K, McConlogue L. Mucke L, et al. J Neurosci. 2000 Jun 1;20(11):4050-8. doi: 10.1523/JNEUROSCI.20-11-04050.2000. J Neurosci. 2000. PMID: 10818140 Free PMC article. - Alzheimer's disease and amyloid: culprit or coincidence?
Skaper SD. Skaper SD. Int Rev Neurobiol. 2012;102:277-316. doi: 10.1016/B978-0-12-386986-9.00011-9. Int Rev Neurobiol. 2012. PMID: 22748834 Review. - The role of complement in Alzheimer's disease pathology.
Emmerling MR, Watson MD, Raby CA, Spiegel K. Emmerling MR, et al. Biochim Biophys Acta. 2000 Jul 26;1502(1):158-71. doi: 10.1016/s0925-4439(00)00042-9. Biochim Biophys Acta. 2000. PMID: 10899441 Review.
Cited by
- Ablation of CCAAT/Enhancer-Binding Protein Delta (C/EBPD): Increased Plaque Burden in a Murine Alzheimer's Disease Model.
Lutzenberger M, Burwinkel M, Riemer C, Bode V, Baier M. Lutzenberger M, et al. PLoS One. 2015 Jul 31;10(7):e0134228. doi: 10.1371/journal.pone.0134228. eCollection 2015. PLoS One. 2015. PMID: 26230261 Free PMC article. - Extensive innate immune gene activation accompanies brain aging, increasing vulnerability to cognitive decline and neurodegeneration: a microarray study.
Cribbs DH, Berchtold NC, Perreau V, Coleman PD, Rogers J, Tenner AJ, Cotman CW. Cribbs DH, et al. J Neuroinflammation. 2012 Jul 23;9:179. doi: 10.1186/1742-2094-9-179. J Neuroinflammation. 2012. PMID: 22824372 Free PMC article. - Current status on Alzheimer disease molecular genetics: from past, to present, to future.
Bettens K, Sleegers K, Van Broeckhoven C. Bettens K, et al. Hum Mol Genet. 2010 Apr 15;19(R1):R4-R11. doi: 10.1093/hmg/ddq142. Epub 2010 Apr 13. Hum Mol Genet. 2010. PMID: 20388643 Free PMC article. Review. - Contribution of Neurons and Glial Cells to Complement-Mediated Synapse Removal during Development, Aging and in Alzheimer's Disease.
Luchena C, Zuazo-Ibarra J, Alberdi E, Matute C, Capetillo-Zarate E. Luchena C, et al. Mediators Inflamm. 2018 Nov 11;2018:2530414. doi: 10.1155/2018/2530414. eCollection 2018. Mediators Inflamm. 2018. PMID: 30533998 Free PMC article. Review. - Complement receptor 1 is expressed on brain cells and in the human brain.
Daskoulidou N, Shaw B, Torvell M, Watkins L, Cope EL, Carpanini SM, Allen ND, Morgan BP. Daskoulidou N, et al. Glia. 2023 Jun;71(6):1522-1535. doi: 10.1002/glia.24355. Epub 2023 Feb 24. Glia. 2023. PMID: 36825534 Free PMC article.
References
- Wyss-Coray, T. & Mucke, L. (2002) Neuron, in press. - PubMed
- McGeer P. L. & McGeer, E. G. (1999) J. Leukocyte Biol. 65, 409-415. - PubMed
- Terry R. D., Masliah, E. & Hansen, L. A. (1994) in Alzheimer Disease, eds. Terry, R. D., Katzman, R. & Bick, K. L. (Raven, New York), pp. 179–196.
- Selkoe D. J. (1999) Nature (London) 399, A23-A31. - PubMed
Publication types
MeSH terms
Substances
Grants and funding
- P50 AG005131/AG/NIA NIH HHS/United States
- DK41873/DK/NIDDK NIH HHS/United States
- AI30040/AI/NIAID NIH HHS/United States
- AG10869/AG/NIA NIH HHS/United States
- N01AI30040/AI/NIAID NIH HHS/United States
- R01 DK041873/DK/NIDDK NIH HHS/United States
- R56 DK041873/DK/NIDDK NIH HHS/United States
- AG15871/AG/NIA NIH HHS/United States
- U24 DK058820/DK/NIDDK NIH HHS/United States
- DK58820/DK/NIDDK NIH HHS/United States
- AG5131/AG/NIA NIH HHS/United States
LinkOut - more resources
Full Text Sources
Other Literature Sources
Medical
Molecular Biology Databases
Miscellaneous
