Rewarding and psychomotor stimulant effects of endomorphin-1: anteroposterior differences within the ventral tegmental area and lack of effect in nucleus accumbens - PubMed (original) (raw)
Rewarding and psychomotor stimulant effects of endomorphin-1: anteroposterior differences within the ventral tegmental area and lack of effect in nucleus accumbens
Abraham Zangen et al. J Neurosci. 2002.
Abstract
Endomorphin-1 (EM-1) is a recently isolated endogenous peptide having potent analgesic activity and high affinity and selectivity for the mu-opioid receptor. The present study was designed to investigate the rewarding and psychomotor stimulant effects of EM-1 in specific brain regions. We found that rats would learn without priming or response shaping to lever-press for microinjections of EM-1 into the ventral tegmental area (VTA); responding was most vigorous for high-dose injections into the posterior VTA. Rats did not learn to lever-press for microinjections of EM-1 into the nucleus accumbens (NAS) or regions just dorsal to the VTA. Lever-pressing for EM-1 in the VTA was extinguished when vehicle was substituted for the peptide and was reinstated when EM-1 reinforcement was re-established. Conditioned place preference was established by EM-1 injections into the posterior but not the anterior VTA or the NAS. Injection of EM-1 (0.1-1.0 nmol) into the posterior VTA induced robust increases in locomotor activity, whereas injections into the anterior VTA had very weak locomotor-stimulating effects. When injected into the NAS, EM-1 (0.1-10.0 nmol) did not affect locomotor activity. The present findings implicate the posterior VTA as a highly specific and sensitive site for opioid reward and suggest a role for EM-1-containing projections to the posterior VTA in the rewarding effects of other reinforcers.
Figures
Fig. 1.
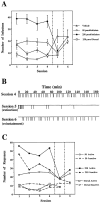
Self-administration of EM-1 into the posterior VTA. During the first four sessions, rats were allowed to press a lever for self-injection of aCSF containing either vehicle (n = 6) or 50 pmol per infusion (n = 5) or 250 pmol per infusion (n = 6) of EM-1 into the posterior VTA. Another group of rats was allowed to press a lever for self-injection of aCSF containing 250 pmol per infusion of EM-1 into a control site 1.5 mm dorsal to the posterior VTA (n = 5). In session 5 (separated by vertical lines), rats that previously received EM-1 were exposed to vehicle only, whereas rats that previously received vehicle now received 250 pmol per infusion of EM-1. In session 6, all groups received 250 pmol per infusion of EM-1. A, Total number of infusions during each session for each group of rats. Repeated ANOVA over the first four sessions, comparing the three groups of rats receiving 0 or 50 or 250 pmol of EM-1 per infusion into the posterior VTA, showed a significant effect of dose (F(2,14) = 23.78; p< 0.0001). Application of the Student–Newman–Keuls post hoc test revealed that both the 50 and 250 pmol doses were significantly different from vehicle (0) and from each other. Repeated ANOVA over the first four sessions, comparing the group receiving 250 pmol per infusion into the posterior VTA and the group receiving 250 pmol per infusion into the dorsal control site, showed a significant effect of site (F(1,9) = 54.00;p < 0.0001). A within-subject analysis over sessions 4–6 showed a significant effect of session for all three posterior VTA groups (F(2,10) = 7.09, p_= 0.012; F(2,8) = 7.28,p = 0.016; F(2,10)= 13.97, p = 0.0013 for the vehicle and 50 and 250 pmol doses, respectively). Application of the Student–Newman–Keuls_post hoc test revealed that in all cases, the vehicle session was significantly different from the EM-1 sessions.B, Example of the infusion-rate pattern during sessions 4–6 of a rat with an injection cannula directed to the posterior VTA from the 250 pmol per infusion group. C, Comparison between the responses on the active versus the inactive lever during each session for each group of rats. Repeated ANOVA over the first four sessions comparing active versus inactive lever responses (within-subjects analysis) revealed that in both the 50 pmol and 250 pmol posterior VTA groups, active responses were significantly different from inactive responses (F(1,4) = 63.85, _p_= 0.0013, and F(1,4) = 7.84,p = 0.038, respectively), whereas no significant difference between active and inactive responses was observed in the dorsal control group (F(1,4) = 3.20;p = 0.14).
Fig. 2.
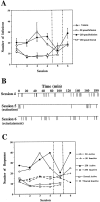
Self-administration of EM-1 into the anterior VTA. During the first four sessions, rats were allowed to press a lever for self-injection of aCSF containing either vehicle (n = 5) or 50 pmol per infusion (n = 5) or 250 pmol per infusion (n = 6) of EM-1 into the anterior VTA. Another group of rats was allowed to press a lever for self-injection of aCSF containing 250 pmol per infusion of EM-1 into a control site 1.5 mm dorsal to the anterior VTA (n = 5). In session 5 (separated by vertical lines), rats that previously received EM-1 were exposed to vehicle only, whereas rats that previously received vehicle now received 250 pmol per infusion of EM-1. In session 6, all groups received 250 pmol per infusion of EM-1. A, Total number of infusions during each session for each group of rats. Repeated ANOVA over the first four sessions comparing the three groups of rats receiving 0 or 50 or 250 pmol of EM-1 per infusion into the anterior VTA showed a significant effect of dose (F(2,13) = 11.66; _p_= 0.0013). Application of the Student–Newman–Keuls post hoc test revealed that both the 50 and 250 pmol doses were significantly different from vehicle (0) but not from each other. Repeated ANOVA over the first four sessions comparing the group receiving 250 pmol per infusion into the anterior VTA and the group receiving 250 pmol per infusion into the dorsal control site showed a significant effect of site (F(1,9) = 101.66; p < 0.0001). A within-subjects analysis over sessions 4–6 showed a significant effect of session for all three anterior VTA groups (F(2,8) = 27.68, p_= 0.0003; F(2,8) = 4.89,p = 0.041; F(2,10)= 9.88, p = 0.0043 for the vehicle and 50 and 250 pmol doses, respectively). Application of the Student–Newman–Keuls_post hoc test revealed that in all cases, the vehicle session was significantly different from the EM-1 sessions.B, Example of the infusion rate pattern during sessions 4–6 of a rat with an injection cannula directed to the anterior VTA from the 250 pmol per infusion group. C, Comparison between the responses on the active versus the inactive lever during each session for each group of rats. Repeated ANOVA over the first four sessions comparing active versus inactive lever responses (within-subjects analysis) revealed that in both the 50 pmol and 250 pmol posterior VTA groups, active responses were significantly different from inactive responses (F(1,4) = 14.30, _p_= 0.019 and F(1,4) = 11.62,p = 0.019, respectively), whereas no significant differences between active and inactive responses were observed in the dorsal control group.
Fig. 3.
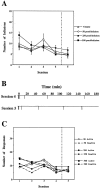
Self-administration of EM-1 into the NAS shell. During the first four sessions, rats were allowed to press a lever for self-injection of aCSF containing either vehicle (_n_= 5) or 50 pmol per infusion (n = 6), 250 pmol per infusion (n = 6), or 500 pmol per infusion (n = 5) of EM-1 into the NAS shell. In session 5 (separated by a vertical line), rats that previously received EM-1 were exposed to vehicle only, whereas rats that previously received vehicle now received 250 pmol per infusion of EM-1.A, Total number of infusions during each session for each group of rats. Repeated ANOVA over the first four sessions comparing the four groups of rats receiving 0 or 50 or 250 or 500 pmol of EM-1 per infusion into the NAS shell showed no significant effect of dose (F(3,18) = 0.32;p = 0.81). A within-subjects analysis comparing sessions 4 and 5 showed no significant effect of session in any of the NAS shell groups. B, Example of the infusion rate pattern during sessions 4 and 5 of a rat with an injection cannula directed to the NAS shell from the 250 pmol per infusion group.C, Comparison between the responses on the active versus the inactive lever during each session for each group of rats. Repeated ANOVA over the first four sessions comparing active versus inactive lever responses (within-subjects analysis) revealed no significant differences between active and inactive lever responses in any of the NAS groups.
Fig. 4.
Effect of EM-1 microinjections into the posterior hypothalamus or anterior or posterior VTA on locomotor activity.A, B, Time course of the distance traveled during 30 min sessions after EM-1 (0–1.0 nmol/0.5 μl) injections into the posterior and anterior VTA, respectively. C, D, Dose–response effects of EM-1 microinjections into the posterior hypothalamus (n = 8) or anterior (n = 11) or posterior (n = 10) VTA on the total distance and the rearing activity during the entire session. Data are presented as means ± SEM. Data were analyzed by one-way ANOVA with repeated measures over the four doses, coupled with application of the Student–Newman–Keuls post hoc test. *p < 0.01 versus effect of the vehicle microinjections.
Fig. 5.
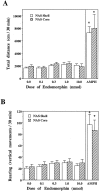
Effect of EM-1 and amphetamine (AMPH) microinjections into the NAS shell or core on locomotor activity. Data are presented as means ± SEM values of the total distance (A) and the total rearing activity (B) measured during 30 min sessions after EM-1 (0–10.0 nmol) or amphetamine (20.0 nmol) injections into the NAS shell (n = 12) or core (n = 8). One-way ANOVA with repeated measures over the five EM-1 doses showed no significant effect of the EM-1 dose (shell: F(4,44) = 2.44,p = 0.061; core:F(4,28) = 1.18, p = 0.34). However, when the amphetamine session was included in the repeated ANOVA, a significant effect of session was obtained (shell:F(5,55) = 25.08, p< 0.0001; core: F(5,35) = 7.04,p < 0.001). An asterisk indicates a significant difference from vehicle treatment (by application of the Newman–Keuls post hoc test).
Fig. 6.
Conditioned place preference induced by intracranial microinjections of EM-1. Data are presented as mean ± SEM values of the total time spent in the EM-1-associated and the vehicle-associated compartments during the 15 min test session (n = 8 for each brain site; *p< 0.05; paired t test).
Fig. 7.
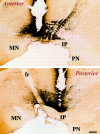
Placement of posterior and anterior VTA injections as related to the boundaries of dopamine cell bodies. Photomicrographs show sagittal sections through the VTA, with the track of the injection needle (top, anterior site; bottom, posterior site). The sections were immunostained for TH, showing the boundaries of the dopaminergic cells of the VTA. IP, Interpeduncular nucleus; PN, paranigral nucleus;MN, mamillary nucleus; fr, fasciculus retroflexus. Scale bar, 0.35 mm.
Similar articles
- Differential conditioned place preference responses to endomorphin-1 and endomorphin-2 microinjected into the posterior nucleus accumbens shell and ventral tegmental area in the rat.
Terashvili M, Wu HE, Leitermann RJ, Hung KC, Clithero AD, Schwasinger ET, Tseng LF. Terashvili M, et al. J Pharmacol Exp Ther. 2004 May;309(2):816-24. doi: 10.1124/jpet.103.059287. Epub 2004 Jan 30. J Pharmacol Exp Ther. 2004. PMID: 14755004 - Two brain sites for cannabinoid reward.
Zangen A, Solinas M, Ikemoto S, Goldberg SR, Wise RA. Zangen A, et al. J Neurosci. 2006 May 3;26(18):4901-7. doi: 10.1523/JNEUROSCI.3554-05.2006. J Neurosci. 2006. PMID: 16672664 Free PMC article. - Dissociation between rewarding and psychomotor effects of opiates: differential roles for glutamate receptors within anterior and posterior portions of the ventral tegmental area.
Shabat-Simon M, Levy D, Amir A, Rehavi M, Zangen A. Shabat-Simon M, et al. J Neurosci. 2008 Aug 20;28(34):8406-16. doi: 10.1523/JNEUROSCI.1958-08.2008. J Neurosci. 2008. PMID: 18716199 Free PMC article. - Rewarding effects of the cholinergic agents carbachol and neostigmine in the posterior ventral tegmental area.
Ikemoto S, Wise RA. Ikemoto S, et al. J Neurosci. 2002 Nov 15;22(22):9895-904. doi: 10.1523/JNEUROSCI.22-22-09895.2002. J Neurosci. 2002. PMID: 12427846 Free PMC article. - Localization of brain reinforcement mechanisms: intracranial self-administration and intracranial place-conditioning studies.
McBride WJ, Murphy JM, Ikemoto S. McBride WJ, et al. Behav Brain Res. 1999 Jun;101(2):129-52. doi: 10.1016/s0166-4328(99)00022-4. Behav Brain Res. 1999. PMID: 10372570 Review.
Cited by
- Region and sex differences in constituent dopamine neurons and immunoreactivity for intracellular estrogen and androgen receptors in mesocortical projections in rats.
Kritzer MF, Creutz LM. Kritzer MF, et al. J Neurosci. 2008 Sep 17;28(38):9525-35. doi: 10.1523/JNEUROSCI.2637-08.2008. J Neurosci. 2008. PMID: 18799684 Free PMC article. - Nicotine-mediated activation of dopaminergic neurons in distinct regions of the ventral tegmental area.
Zhao-Shea R, Liu L, Soll LG, Improgo MR, Meyers EE, McIntosh JM, Grady SR, Marks MJ, Gardner PD, Tapper AR. Zhao-Shea R, et al. Neuropsychopharmacology. 2011 Apr;36(5):1021-32. doi: 10.1038/npp.2010.240. Epub 2011 Feb 2. Neuropsychopharmacology. 2011. PMID: 21289604 Free PMC article. - Differential effects of dopamine D2 and GABA(A) receptor antagonists on dopamine neurons between the anterior and posterior ventral tegmental area of female Wistar rats.
Ding ZM, Liu W, Engleman EA, Rodd ZA, McBride WJ. Ding ZM, et al. Pharmacol Biochem Behav. 2009 May;92(3):404-12. doi: 10.1016/j.pbb.2009.01.004. Pharmacol Biochem Behav. 2009. PMID: 19480073 Free PMC article. - Hormones and Neuropeptide Receptor Heteromers in the Ventral Tegmental Area. Targets for the Treatment of Loss of Control of Food Intake and Substance Use Disorders.
Ferré S. Ferré S. Curr Treat Options Psychiatry. 2017;4(2):167-183. doi: 10.1007/s40501-017-0109-x. Epub 2017 Apr 22. Curr Treat Options Psychiatry. 2017. PMID: 28580231 Free PMC article. Review. - Dual roles of dopamine in food and drug seeking: the drive-reward paradox.
Wise RA. Wise RA. Biol Psychiatry. 2013 May 1;73(9):819-26. doi: 10.1016/j.biopsych.2012.09.001. Epub 2012 Oct 5. Biol Psychiatry. 2013. PMID: 23044182 Free PMC article. Review.
References
- Arnt J, Scheel-Krüger J. GABA in the ventral tegmental area: differential regional effects on locomotion, aggression and food intake after microinjection of GABA agonists and antagonists. Life Sci. 1979;25:1351–1360. - PubMed
- Bals-Kubik R, Ableitner A, Herz A, Shippenberg TS. Neuroanatomical sites mediating the motivational effects of opioids as mapped by the conditioned place preference paradigm in rats. J Pharmacol Exp Ther. 1993;264:489–495. - PubMed
- Bardo MT, Valone JM, Bevins RA. Locomotion and conditioned place preference produced by acute intravenous amphetamine: role of dopamine receptors and individual differences in amphetamine self-administration. Psychopharmacology. 1999;143:39–46. - PubMed
- Bozarth MA. Neuroanatomical boundaries of the reward-relevant opiate-receptor field in the ventral tegmental area as mapped by the conditioned place preference method in rats. Brain Res. 1987;414:77–84. - PubMed
- Bozarth MA, Wise RA. Intracranial self-administration of morphine into the ventral tegmental area in rats. Life Sci. 1981;28:551–555. - PubMed
Publication types
MeSH terms
Substances
LinkOut - more resources
Full Text Sources
Research Materials
