Activation of the TrkB neurotrophin receptor is induced by antidepressant drugs and is required for antidepressant-induced behavioral effects - PubMed (original) (raw)
. 2003 Jan 1;23(1):349-57.
doi: 10.1523/JNEUROSCI.23-01-00349.2003.
Panu Hendolin, Guilherme Lucas, Eija Koponen, Mikko Sairanen, Ewen MacDonald, Karin Agerman, Annakaisa Haapasalo, Hiroyuki Nawa, Raquel Aloyz, Patrik Ernfors, Eero Castrén
Affiliations
- PMID: 12514234
- PMCID: PMC6742146
- DOI: 10.1523/JNEUROSCI.23-01-00349.2003
Activation of the TrkB neurotrophin receptor is induced by antidepressant drugs and is required for antidepressant-induced behavioral effects
Tommi Saarelainen et al. J Neurosci. 2003.
Abstract
Recent studies have indicated that exogenously administered neurotrophins produce antidepressant-like behavioral effects. We have here investigated the role of endogenous brain-derived neurotrophic factor (BDNF) and its receptor trkB in the mechanism of action of antidepressant drugs. We found that trkB.T1-overexpressing transgenic mice, which show reduced trkB activation in brain, as well as heterozygous BDNF null (BDNF(+/)-) mice, were resistant to the effects of antidepressants in the forced swim test, indicating that normal trkB signaling is required for the behavioral effects typically produced by antidepressants. In contrast, neurotrophin-3(+/)- mice showed a normal behavioral response to antidepressants. Furthermore, acute as well as chronic antidepressant treatment induced autophosphorylation and activation of trkB in cerebral cortex, particularly in the prefrontal and anterior cingulate cortex and hippocampus. Tyrosines in the trkB autophosphorylation site were phosphorylated in response to antidepressants, but phosphorylation of the shc binding site was not observed. Nevertheless, phosphorylation of cAMP response element-binding protein was increased by antidepressants in the prefrontal cortex concomitantly with trkB phosphorylation and this response was reduced in trkB.T1-overexpressing mice. Our data suggest that antidepressants acutely increase trkB signaling in a BDNF-dependent manner in cerebral cortex and that this signaling is required for the behavioral effects typical of antidepressant drugs. Neurotrophin signaling increased by antidepressants may induce formation and stabilization of synaptic connectivity, which gradually leads to the clinical antidepressive effects and mood recovery.
Figures
Fig. 1.
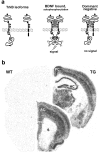
Transgenic mice overexpressing the truncated trkB.T1 isoform in neurons. a, Schematic representation of trkB activation by BDNF and of the dominant-negative role of the truncated trkB.T1 isoform. b, TrkB.T1 transgene expression in adult transgenic mouse brain. _In situ_hybridization of a wild-type (WT) and transgenic (TG) mouse at two different rostrocaudal levels with an oligonucleotide probe that specifically recognizes the FLAG-epitope sequence inserted into the transgene.AC, Anterior cingulate cortex; HC, hippocampus; PC, posterior cingulate cortex;PFC, prefrontal cortex; S, striatum;T, thalamus.
Fig. 2.
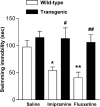
TrkB.T1 transgenic mice are resistant to antidepressants in forced swim test. Immobility time in a forced swim test in trkB.T1 transgenic (filled bars) and wild-type mice (open bars) after injection with saline, imipramine (30 mg/kg), or fluoxetine (20 mg/kg; n = 8–12 for each differently treated genotype). *p < 0.05, **p < 0.01, compared with saline-treated wild-type animals. #p < 0.05 and##p < 0.01 show the difference between transgenic and wild-type animals with the same treatment (one-way ANOVA, post hoc analysis; Bonferroni's test). Data are presented as means ± SEM.
Fig. 3.
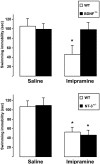
Forced swim test behavior of BDNF+/− (top panel) and NT-3+/− mice (bottom panel). Female BDNF+/− mice and wild-type littermates were injected with saline or imipramine (30 mg/kg;n = 8 and 9 for saline and imipramine, respectively, for both genotypes) and subjected to a forced swim test (6 min, immobility recorded during the last 4 min) 30 min after the injection. Male NT-3+/− mice and wild-type littermates were treated identically (n = 9 and 10 for saline and imipramine, respectively, for both genotypes). Means ± SEM; *p < 0.01; one-way ANOVA and Bonferroni's post hoc test.
Fig. 4.
Antidepressants induce trkB autophosphorylation in mouse brain. a, Mice were injected intraperitoneally with imipramine (IMI) (30 mg/kg;n = 15) or saline (Sal) (n = 15), or with fluoxetine (FLX) (20 mg/kg, n = 11) or saline (Sal) (n = 11).Top panel, Representative Western blots of WGA-precipitated samples sequentially probed with anti-phosphotyrosine antibody (4G10) and anti-trkBout antibody.TrkB indicates the location of 145 kDa band.Bottom panel, Quantitated levels of the trkB from different treatments. Data are presented as mean ± SEM percentages of the ratio of phosphorylated trk (4G10) to full-length trkB (anti-trkBout) signal intensity levels found in saline-treated animals. **p < 0.01 against saline control; Student's t test.b, Trk immunoprecipitation. Mice received saline (Sal) or imipramine (IMI) (30 mg/kg, i.p.) 30 min before protein extraction. Representative Western blots precipitated with trk antibody and sequentially probed with anti-phosphotyrosine antibody 4G10 and anti-trkBoutantibody are shown. TrkB indicates the location of trkB.IP, Immunoprecipitation; WB, Western blot.
Fig. 5.
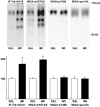
Autophosphorylation of different trkB tyrosines after antidepressant treatment. Top panel, Tissue lysates from prefrontal cortex from mice injected with saline (SAL) or imipramine (IMI) (30 mg/kg) 30 min before dissection were precipitated with anti-pan-trk antibody (IP-trk) or wheat germ agglutinin (WGA) and detected with phosphotyrosine antibody (4G10), pY674/5 antibody (recognized phosphorylated trk autophosphorylation site), _pY490_antibody (recognizes shc binding site in trk), or _panTrk_antibody (to verify equal loading). The three WGA-precipitated blots show the same representative lanes on a single filter sequentially probed with different antibodies. Bottom panel, Quantitation of autophosphorylation-different trkB tyrosines. Data are shown as a mean ± SEM; n = 6 for each treatment. The experiment was repeated at least three times for each of the antibodies, with similar results.
Fig. 6.
a, Time course of changes in trkB autophosphorylation in response to fluoxetine administration (20 mg/kg, i.p.). b, Autophosphorylation of trkB after acute and chronic antidepressant treatments. Mice received saline (open bars) or imipramine (30 mg/kg) (filled bars) intraperitoneally once (30 min; n = 18 for both groups) or once daily for 3 weeks (21 d; n = 11 for both groups). Top panel, Representative Western blots precipitated with WGA and sequentially probed with anti-phosphotyrosine antibody 4G10 and anti-trkBout antibody. Bottom panel and a show quantitated levels of phosphorylated trkB from different treatments. Data are presented as means ± SEM percentages of the ratio of phosphorylated trk (4G10) to full-length trkB (anti-trkBout) signal intensity levels found in saline-treated animals. *p < 0.03, **p < 0.01 against saline control; Student's_t_ test.
Fig. 7.
Effects of acute or chronic antidepressant treatments on trkB phosphorylation in different cortical areas. Lysates of dissected samples from anterior cingulate–prefrontal cortex (AC), hippocampus (HC), posterior cingulate cortex (PC), and parietal cortex (CX) of mice injected once or for 21 d with imipramine (30 mg/kg, 30 min before dissection;n = 6) were precipitated with WGA, and blots were probed with anti-phospho-trk 674/675 antibody. Means ± SEM; percentage of saline-treated control in the same cortical area (n = 6) shown (Cont) is saline control of the AC area. *p < 0.05,#p = 0.053; Student's _t_test.
Fig. 8.
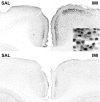
Phosphorylation of CREB in the anterior cingulate cortex 30 min after saline (SAL) or imipramine (IMI) (30 mg/kg, i.p.) administration. Top panel, Wild-type mice; bottom panel, trkB.T1-overexpressing mice; magnification, 40×.Inset shows a larger magnification (400×), demonstrating nuclear localization of the phosphorylated CREB.
Fig. 9.
a, TrkB autophosphorylation in trkB.T1 transgenic and wild-type littermate mice after acute fluoxetine treatment and forced swim test (n = 8–16 for each differently treated genotype). There was no significant difference in the extent of trkB phosphorylation induction between saline- and fluoxetine-treated transgenic mice. *p < 0.05, **p < 0.01, compared with saline-treated wild-type animals (Student's t test). Data presented as means ± SEM. b, Representative Western blots corresponding to data shown in a precipitated with WGA and probed first with anti-phosphotyrosine antibody 4G10 and reprobed with anti-trkBout antibody to ascertain that samples contained similar amounts of trkB. Wt, Wild type;Tg, transgenic.
Similar articles
- Pharmacologically diverse antidepressants rapidly activate brain-derived neurotrophic factor receptor TrkB and induce phospholipase-Cgamma signaling pathways in mouse brain.
Rantamäki T, Hendolin P, Kankaanpää A, Mijatovic J, Piepponen P, Domenici E, Chao MV, Männistö PT, Castrén E. Rantamäki T, et al. Neuropsychopharmacology. 2007 Oct;32(10):2152-62. doi: 10.1038/sj.npp.1301345. Epub 2007 Feb 21. Neuropsychopharmacology. 2007. PMID: 17314919 - Brain-derived neurotrophic factor and antidepressant drugs have different but coordinated effects on neuronal turnover, proliferation, and survival in the adult dentate gyrus.
Sairanen M, Lucas G, Ernfors P, Castrén M, Castrén E. Sairanen M, et al. J Neurosci. 2005 Feb 2;25(5):1089-94. doi: 10.1523/JNEUROSCI.3741-04.2005. J Neurosci. 2005. PMID: 15689544 Free PMC article. - The VGF-derived peptide TLQP62 produces antidepressant-like effects in mice via the BDNF/TrkB/CREB signaling pathway.
Lin P, Wang C, Xu B, Gao S, Guo J, Zhao X, Huang H, Zhang J, Chen X, Wang Q, Zhou W. Lin P, et al. Pharmacol Biochem Behav. 2014 May;120:140-8. doi: 10.1016/j.pbb.2014.03.003. Epub 2014 Mar 11. Pharmacol Biochem Behav. 2014. PMID: 24631486 - TrkB neurotrophin receptor at the core of antidepressant effects, but how?
Rantamäki T. Rantamäki T. Cell Tissue Res. 2019 Jul;377(1):115-124. doi: 10.1007/s00441-018-02985-6. Epub 2019 Jan 12. Cell Tissue Res. 2019. PMID: 30637517 Review. - Behavioral and serotonergic consequences of decreasing or increasing hippocampus brain-derived neurotrophic factor protein levels in mice.
Deltheil T, Guiard BP, Cerdan J, David DJ, Tanaka KF, Repérant C, Guilloux JP, Coudoré F, Hen R, Gardier AM. Deltheil T, et al. Neuropharmacology. 2008 Nov;55(6):1006-14. doi: 10.1016/j.neuropharm.2008.08.001. Epub 2008 Aug 12. Neuropharmacology. 2008. PMID: 18761360 Review.
Cited by
- Alpha-Linolenic Acid-Induced Increase in Neurogenesis is a Key Factor in the Improvement in the Passive Avoidance Task After Soman Exposure.
Piermartiri TC, Pan H, Chen J, McDonough J, Grunberg N, Apland JP, Marini AM. Piermartiri TC, et al. Neuromolecular Med. 2015 Sep;17(3):251-69. doi: 10.1007/s12017-015-8353-y. Epub 2015 Apr 29. Neuromolecular Med. 2015. PMID: 25920465 - Cinnamomum zeylanicum extract has antidepressant-like effects by increasing brain-derived neurotrophic factor (BDNF) and its receptor in prefrontal cortex of rats.
Aryanezhad M, Abdi M, Amini S, Hassanzadeh K, Valadbeigi E, Rahimi K, Izadpanah E, Moloudi MR. Aryanezhad M, et al. Avicenna J Phytomed. 2021 May-Jun;11(3):302-313. Avicenna J Phytomed. 2021. PMID: 34046326 Free PMC article. - Possible associations of NTRK2 polymorphisms with antidepressant treatment outcome: findings from an extended tag SNP approach.
Hennings JM, Kohli MA, Czamara D, Giese M, Eckert A, Wolf C, Heck A, Domschke K, Arolt V, Baune BT, Horstmann S, Brückl T, Klengel T, Menke A, Müller-Myhsok B, Ising M, Uhr M, Lucae S. Hennings JM, et al. PLoS One. 2013 Jun 4;8(6):e64947. doi: 10.1371/journal.pone.0064947. Print 2013. PLoS One. 2013. PMID: 23750220 Free PMC article. - BDNF receptor TrkB as the mediator of the antidepressant drug action.
Casarotto P, Umemori J, Castrén E. Casarotto P, et al. Front Mol Neurosci. 2022 Nov 2;15:1032224. doi: 10.3389/fnmol.2022.1032224. eCollection 2022. Front Mol Neurosci. 2022. PMID: 36407765 Free PMC article. Review. - Neurotrophins role in depression neurobiology: a review of basic and clinical evidence.
Neto FL, Borges G, Torres-Sanchez S, Mico JA, Berrocoso E. Neto FL, et al. Curr Neuropharmacol. 2011 Dec;9(4):530-52. doi: 10.2174/157015911798376262. Curr Neuropharmacol. 2011. PMID: 22654714 Free PMC article.
References
- Altar CA. Neurotrophins and depression. Trends Pharmacol Sci. 1999;20:59–61. - PubMed
- Altar CA, DiStefano PS. Neurotrophin trafficking by anterograde transport. Trends Neurosci. 1998;21:433–437. - PubMed
- Charney DS. Monoamine dysfunction and the pathophysiology and treatment of depression. J Clin Psychiatry. 1998;59:11–14. - PubMed
Publication types
MeSH terms
Substances
LinkOut - more resources
Full Text Sources
Other Literature Sources
Medical
Miscellaneous
