Mdm2 haplo-insufficiency profoundly inhibits Myc-induced lymphomagenesis - PubMed (original) (raw)
Comparative Study
Mdm2 haplo-insufficiency profoundly inhibits Myc-induced lymphomagenesis
Jodi R Alt et al. EMBO J. 2003.
Abstract
Mdm2 harnesses the p53 tumor suppressor, yet loss of one Mdm2 allele in Mdm2(+/-) mice has heretofore not been shown to impair tumor development. Here we report that Mdm2 haplo-insufficiency profoundly suppresses lymphomagenesis in E micro -myc transgenic mice. Mdm2(+/-)E micro -myc transgenics had greatly protracted rates of B cell lymphoma development with life spans twice that of wild-type transgenic littermates. Im paired lymphoma development was associated with drastic reductions in peripheral B cell numbers in Mdm2(+/-)E micro -myc transgenics, and primary pre-B cells from Mdm2(+/-)E micro -myc transgenics and Mdm2(+/-) littermates were extremely susceptible to spontaneous apoptosis. Loss of p53 rescued all of the effects of Mdm2 haplo-insufficiency, indicating they were p53 dependent. Furthermore, half of the lymphomas that ultimately emerged in Mdm2(+/-)E micro -myc transgenics harbored inactivating mutations in p53, and the majority overcame haplo-insufficiency by overexpressing Mdm2. These results support the concept that Mdm2 functions are rate limiting in lymphomagenesis and that targeting Mdm2 will enhance p53-mediated apoptosis, compromising tumor development and/or maintenance.
Figures
Fig. 1. Myc-induced lymphomagenesis is inhibited by Mdm2 haplo-insufficiency. Kaplan–Meier survival curves of Mdm2+/–Eµ-myc transgenic, Mdm2+/+Eµ-myc transgenic, p53+/–Eµ-myc transgenic and p53+/–Mdm2+/–Eµ-myc transgenic mice. The average survivals are 44.3, 20.6, 5.6 and 5 weeks, respectively (log-rank test, P < 0.001). n, the number of mice in each group. Vertical lines indicate ages of surviving mice. Three (3/58) Mdm2+/+Eµ-myc transgenic mice and nine (9/45) Mdm2+/–Eµ-myc transgenic mice are still alive, whereas none of the p53+/–Eµ-myc and p53+/–Mdm2+/–Eµ-myc transgenics is alive. The Kaplan–Meier curves are right-censored because the study was terminated before all of the animals were sacrificed. Therefore, although 20% (9/45) of the Mdm2+/–Eµ-myc transgenic mice are still alive at 70 weeks, the Kaplan–Meier estimate at 70 weeks is lower because there were fewer animals at risk of death at 70 weeks. Lymphoma was documented in all of the animals.
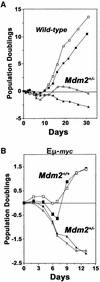
Fig. 2. Mdm2 heterozygous bone marrow is sensitive to spontaneous and Myc-induced apoptosis. Bone marrow from two Mdm2+/– mice [(A), triangles], two wild-type littermates (A, squares), two Mdm2+/–Eµ-myc transgenics [(B), triangles], and two Mdm2+/+Eµ-myc transgenic littermate controls (B, squares) prior to any detectable lymphoma was placed into IL-7-containing medium (day 0). Cells were counted on the indicated days. Pre-B cell growth was calculated as net population doublings at the indicated intervals. Viability was determined by Trypan Blue dye exclusion and apoptosis was verified by PI staining.
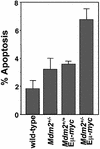
Fig. 3. Increased apoptosis in splenocytes from Mdm2+/–Eµ-myc transgenics. Disaggregated, ethanol fixed splenocytes from the indicated genotypes prior to any detectable disease were stained with PI and analyzed on a FACScan. Sub-G1 DNA was quantified from three separate mice of each genotype with CellQuest software. Each bar is an average and error bars represent 1 SD.
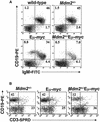
Fig. 4. Mdm2+/–Eµ-myc transgenics have drastically reduced numbers of B cells. (A and B) Splenic cells from mice of the indicated genotypes prior to any detectable disease were stained with fluorescent antibodies specific for B cells (IgM, CD19) and T cells (CD3) and subjected to flow cytometry phenotype analysis. The location of the quadrant axes was determined from isotype controls, and the numbers in the quadrants are the percentage of cells in each of those quadrants. Data are representative of five separate experiments.
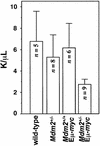
Fig. 5. Mdm2+/–Eµ-myc transgenics have reduced numbers of circulating lymphocytes. Peripheral blood lymphocytes were counted from retro-orbital eye bleeds from wild-type, Mdm2+/–, Mdm2+/+Eµ-myc transgenic and Mdm2+/–Eµ-myc transgenic mice prior to any detectable disease. n, number of animals that were analyzed from each genotype. Error bars represent 1 SD. K/µl = 1000 cells/µl.
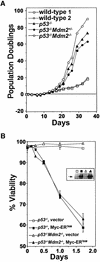
Fig. 6. Loss of p53 inhibits apoptosis of Mdm2+/– pre-B cells. (A) Bone marrow cells from _p53_–/–, p53_–/–_Mdm2+/–, _p53_–/–_Mdm2_–/– (prior to any detectable disease) and two wild-type littermates were placed into IL-7 containing medium (day 0) and pre-B cell growth, calculated as net population doublings, was determined at the indicated intervals. (B) 4-HT was added to the indicated primary pre-B cell cultures to activate Myc-ERTAM, and their viability was determined at intervals thereafter by Trypan Blue dye exclusion. Apoptosis was confirmed by analysis of subdiploid DNA content after staining with PI. Steady-state levels of apoptosis in the wild-type primary pre-B cells are indicated at the 0 h time point. Data points are an average of at least three separate experiments, and error bars represent 1 SD. (B, inset) The protein levels of Myc-ERTAM in the indicated pre-B cells was determined by immunoblotting with an antibody specific for Myc. Arrow denotes location of Myc-ERTAM.
Fig. 7. Analysis of p53, ARF and Mdm2 status in lymphomas arising in Mdm2+/–Eµ-myc transgenic mice. Western blot analysis: levels of p53 (top panel), p19ARF (second panel), Mdm2 (third panel) and β-actin (bottom panel) protein in whole-cell extracts of lymphomas from the indicated Eµ-myc transgenic mice were assessed by immunoblotting with antibodies specific to each protein. The three arrows next to Mdm2 indicate the location of the three isoforms of Mdm2 protein. Lymphomas from Mdm2+/+Eµ-myc transgenics were run as controls for p53, ARF and/or Mdm2 protein expression.
Similar articles
- Disruption of the ARF-Mdm2-p53 tumor suppressor pathway in Myc-induced lymphomagenesis.
Eischen CM, Weber JD, Roussel MF, Sherr CJ, Cleveland JL. Eischen CM, et al. Genes Dev. 1999 Oct 15;13(20):2658-69. doi: 10.1101/gad.13.20.2658. Genes Dev. 1999. PMID: 10541552 Free PMC article. - Bax loss impairs Myc-induced apoptosis and circumvents the selection of p53 mutations during Myc-mediated lymphomagenesis.
Eischen CM, Roussel MF, Korsmeyer SJ, Cleveland JL. Eischen CM, et al. Mol Cell Biol. 2001 Nov;21(22):7653-62. doi: 10.1128/MCB.21.22.7653-7662.2001. Mol Cell Biol. 2001. PMID: 11604501 Free PMC article. - Loss of one allele of ARF rescues Mdm2 haploinsufficiency effects on apoptosis and lymphoma development.
Eischen CM, Alt JR, Wang P. Eischen CM, et al. Oncogene. 2004 Nov 25;23(55):8931-40. doi: 10.1038/sj.onc.1208052. Oncogene. 2004. PMID: 15467748 - Overexpression of the MDM2 oncogene in leukemia and lymphoma.
Watanabe T, Ichikawa A, Saito H, Hotta T. Watanabe T, et al. Leuk Lymphoma. 1996 May;21(5-6):391-7, color plates XVI following 5. doi: 10.3109/10428199609093436. Leuk Lymphoma. 1996. PMID: 9172803 Review. - Inhibiting the p53-MDM2 interaction: an important target for cancer therapy.
Chène P. Chène P. Nat Rev Cancer. 2003 Feb;3(2):102-9. doi: 10.1038/nrc991. Nat Rev Cancer. 2003. PMID: 12563309 Review.
Cited by
- The p53 regulatory gene MDM2 is a direct transcriptional target of MYCN in neuroblastoma.
Slack A, Chen Z, Tonelli R, Pule M, Hunt L, Pession A, Shohet JM. Slack A, et al. Proc Natl Acad Sci U S A. 2005 Jan 18;102(3):731-6. doi: 10.1073/pnas.0405495102. Epub 2005 Jan 11. Proc Natl Acad Sci U S A. 2005. PMID: 15644444 Free PMC article. - p53 status dictates responses of B lymphomas to monotherapy with proteasome inhibitors.
Yu D, Carroll M, Thomas-Tikhonenko A. Yu D, et al. Blood. 2007 Jun 1;109(11):4936-43. doi: 10.1182/blood-2006-10-050294. Epub 2007 Feb 6. Blood. 2007. PMID: 17284530 Free PMC article. - p53, SKP2, and DKK3 as MYCN Target Genes and Their Potential Therapeutic Significance.
Chen L, Tweddle DA. Chen L, et al. Front Oncol. 2012 Nov 28;2:173. doi: 10.3389/fonc.2012.00173. eCollection 2012. Front Oncol. 2012. PMID: 23226679 Free PMC article. - Clinical relevance of MDM2 SNP 309 and TP53 Arg72Pro in follicular lymphoma.
Wrench D, Waters R, Carlotti E, Iqbal S, Matthews J, Calaminici M, Gribben J, Lister TA, Fitzgibbon J. Wrench D, et al. Haematologica. 2009 Jan;94(1):148-50. doi: 10.3324/haematol.13533. Epub 2008 Nov 23. Haematologica. 2009. PMID: 19029147 Free PMC article. No abstract available. - Ribosomal protein S27-like is a physiological regulator of p53 that suppresses genomic instability and tumorigenesis.
Xiong X, Zhao Y, Tang F, Wei D, Thomas D, Wang X, Liu Y, Zheng P, Sun Y. Xiong X, et al. Elife. 2014 Aug 21;3:e02236. doi: 10.7554/eLife.02236. Elife. 2014. PMID: 25144937 Free PMC article.
References
- Adams J.M., Harris,A.W., Pinkert,C.A., Corcoran,L.M., Alexander,W.S., Cory,S., Palmiter,R.D. and Brinster,R.L. (1985) The c-myc oncogene driven by immunoglobulin enhancers induces lymphoid malignancy in transgenic mice. Nature, 318, 533–538. - PubMed
- Boyd M.T., Vlatkovic,N. and Haines,D.S. (2000) A novel cellular protein (MTBP) binds to MDM2 and induces a G1 arrest that is suppressed by MDM2. J. Biol. Chem., 275, 31883–31890. - PubMed
- de Rozieres S., Maya,R., Oren,M. and Lozano,G. (2000) The loss of mdm2 induces p53-mediated apoptosis. Oncogene, 19, 1691–1697. - PubMed
- Eischen C.M., Packham,G., Nip,J., Fee,B.E., Hiebert,S.W., Zambetti,G.P. and Cleveland,J.L. (2001a) Bcl-2 is an apoptotic target suppressed by both c-Myc and E2F-1. Oncogene, 20, 6983–6993. - PubMed
Publication types
MeSH terms
Substances
Grants and funding
- R01 DK044158/DK/NIDDK NIH HHS/United States
- CA76379/CA/NCI NIH HHS/United States
- T32 CA09476/CA/NCI NIH HHS/United States
- R01 CA076379/CA/NCI NIH HHS/United States
- DK44158/DK/NIDDK NIH HHS/United States
- T32 CA009476/CA/NCI NIH HHS/United States
LinkOut - more resources
Full Text Sources
Molecular Biology Databases
Research Materials
Miscellaneous

