Alpha interferon induces distinct translational control programs to suppress hepatitis C virus RNA replication - PubMed (original) (raw)
Alpha interferon induces distinct translational control programs to suppress hepatitis C virus RNA replication
Chunfu Wang et al. J Virol. 2003 Apr.
Abstract
Hepatitis C virus (HCV) infection is treated with interferon (IFN)-based therapy. The mechanisms by which IFN suppresses HCV replication are not known, and only limited efficacy is achieved with therapy because the virus directs mechanisms to resist the host IFN response. In the present study we characterized the effects of IFN action upon the replication of two distinct quasispecies of an HCV replicon whose encoded NS5A protein exhibited differential abilities to bind and inhibit protein kinase R (PKR). Metabolic labeling experiments revealed that IFN had little overall effect upon HCV protein stability or polyprotein processing but specifically blocked translation of the HCV RNA, such that the replication of both viral quasispecies was suppressed by IFN treatment of the Huh7 host cells. However, within cells expressing an NS5A variant that inhibited PKR, we observed a reduced level of eukaryotic initiation factor 2 alpha subunit (eIF2alpha) phosphorylation and a concomitant increase in HCV protein synthetic rates, enhancement of viral RNA replication, and a partial rescue of viral internal ribosome entry site (IRES) function from IFN suppression. Assessment of the ribosome distribution of the HCV replicon RNA demonstrated that the NS5A-mediated block in eIF2alpha phosphorylation resulted in enhanced recruitment of the HCV RNA into polyribosome complexes in vivo but only partially rescued the RNA from polyribosome dissociation induced by IFN treatment. Examination of cellular proteins associated with HCV-translation complexes in IFN-treated cells identified the P56 protein as an eIF3-associated factor that fractionated with the initiator ribosome-HCV RNA complex. Importantly, we found that P56 could independently suppress HCV IRES function both in vitro and in vivo, but a mutant P56 that was unable to bind eIF3 had no suppressive action. We conclude that IFN blocks HCV replication through translational control programs involving PKR and P56 to, respectively, target eIF2- and eIF3-dependent steps in the viral RNA translation initiation process.
Figures
FIG. 1.
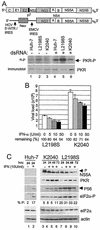
Assessment of PKR activity and viral RNA levels within Huh7 control and HCV replicon cells. (A) Analysis of in vivo PKR activity during HCV RNA replication. The diagram shows comparative structural representations of the HCV genome (upper) and subgenomic replicon, denoting the HCV 5′-NTR/IRES, the EMCV IRES, and regions encoding the neomycin-resistance protein (Neo) and the various cleavage products of the HCV polyprotein. The panels show protein analyses of Huh7 control and replicon cells that were cultured alone (lanes 1 to 3) or in the presence of 40 μg of dsRNA/ml (lanes 4 to 6) as described in Materials and Methods. In the upper panel, the phosphorylation state (activity) of PKR was assessed by 32P metabolic labeling of proteins, followed by anti-PKR immunoprecipitation anal-ysis of control Huh7 cells (lanes 1 and 4) and Huh7 cells harboring the L2198S (lanes 2 and 5) or K2040 HCV replicon quasispecies (lanes 3 and 6). The lower panel is an immunoblot analysis of PKR levels present within identical parallel cultures of Huh7 control and replicon cells. The results shown are representative of three independent experiments. (B) HCV RNA levels in IFN-treated HCV replicon cells. HCV RNA levels were quantified by real-time RT-PCR assay of total RNA extracted from Huh7 cells harboring the L2198S or K2040 HCV replicon that were cultured for 24 h alone or with the indicated concentrations of IFN-α. Bars show combined data from three independent experiments presenting the overall average and standard deviation of RNA copy number relative to the GAPDH mRNA levels present within each sample. The percent viral RNA remaining after each 24 h IFN treatment is shown beneath the respective bar. (C) Protein expression and eIF2α phosphorylation in HCV replicon cell cultures. Huh7 control cells (lanes 1 and 2) and Huh7 cells harboring the K2040 (lanes 3 to 6) or L2198S HCV replicon quasispecies (lanes 7 to 10) were cultured alone or with 10 U of IFN-α/ml for the time indicated above each lane. Protein levels in cell extracts were determined by immunoblot analysis. The arrows point to the positions of the high-mass, hyperphosphorylated NS5A isoform or to P56. eIF2α-P denotes the expression of the S51-phosphorylated species of eIF2α. The relative levels of eIF2α-P from total eIF2α were quantified by densitometric analysis and are presented below each corresponding lane. The results shown are representative of three independent experiments.
FIG. 2.
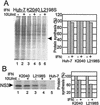
Analysis of cellular and viral protein synthesis in Huh7 cells. (A) Cellular protein synthesis. The left panel shows an autoradiogram from an SDS-PAGE analysis of total cellular proteins within extracts harvested from Huh7 control cells (lanes 1and 2) and Huh7 cells harboring HCV replicon K2040 (lanes3 and 4) or L2198S (lanes 5 and 6) that were cultured in medium alone or in medium containing 10 U of IFN-α/ml for 16 h, followed by [35S]methionine pulse-labeling for 30 min. The band marked by the arrow denotes a cellular protein that was selected for phosphorimager quantification of incorporated radioactivity. The right panel displays the values as a percentage of the amount of the protein produced within cells cultured in the absence of IFN. (B) Synthesis of the HCV NS3 protein. The cell extracts shown in panel A were subjected to immunoprecipitation analysis with a specific antibody against the NS3 protein. The left panel shows an autoradiogram of the NS3 protein (denoted by the arrow) recovered from Huh7 cells harboring the indicated HCV replicon quasispecies (lanes 1 to 4). Lane 5 shows a parallel immunoprecipitation analysis of an extract prepared from IFN-treated Huh7 control cells. The NS3 protein band was quantified by phosphorimager analysis of the dried gel. The right panel shows the phosphorimager quantification of the relative amount of NS3 produced during the labeling period. Values are shown as a percentage relative to the amount of NS3 recovered from cells cultured in the absence of IFN. “+” and “-” denote cell culture in the presence or absence of IFN, respectively. Similar results were obtained from cells cultured in 50 or 100 U of IFN/ml. The results shown were reproduced in three separate experiments.
FIG. 3.
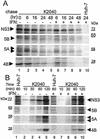
HCV protein stability and polyprotein processing kinetics within IFN-treated cells. (A) Pulse-chase analysis. Huh7 cells harboring the K2040 HCV replicon were cultured for 24 h, followed by a 30-min pulse-labeling period in the presence of [35S]methionine. After being labeled, the cells were harvested (lane 1, 0 h time point) or were cultured with excess cold methionine alone (− [lanes 2 to 5]) or in the presence of 50 U/ml of IFN-α (+ [lanes 6 to 9]) for the time period indicated (in hours) above each lane. Lane 10 shows a parallel analysis of Huh7 control cells. The indicated HCV proteins were recovered from cell extracts by immunoprecipitation. The panels show an autoradiogram from SDS-PAGE analyses of the recovered immunoprecipitation products (indicated by the arrows). For NS5A, the upper arrow denotes the position of the putative hyperphosphorylated isoform. The incorporation of radiolabel into each protein was quantified by phosphorimager analysis over three separate experiments, and resulting values were used to determine the protein _t_1/2 (see Table 1). The positions of the molecular mass standards are shown in kilodaltons. Similar results were obtained from cells treated with 10 or 100 U of IFN/ml. (B) HCV polyprotein processing kinetics. Huh7 control cells (lanes 1 and 6) or those harboring the K2040 HCV replicon were cultured alone (lanes 1 to 5) or in the presence of 50 U of IFN-α/ml for 24 h, after which the cells were metabolically labeled with [35S]methionine for the time period shown above each lane. Panels show an SDS-PAGE analysis and autoradiogram of viral proteins (indicated by arrows) that were recovered by immunoprecipitation of extracts prepared from the respective cultures. The positions of the molecular mass standards are shown in kilodaltons.
FIG. 4.
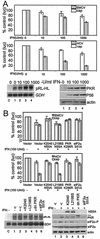
Influence of IFN and the PKR pathway upon HCV and EMCV IRES function. (A) Suppression of IRES function by IFN. Huh7 cells were transfected with the bicistronic plasmid reporter constructs pCMVRluc-EFluc or pRL-HL to simultaneously assess 5′ cap-dependent Renilla luciferase translation (cap) and EMCV IRES (upper panel) or HCV IRES-dependent firefly luciferase translation (middle panel), respectively. Cells were transfected and cultured for 24 h., followed by a 24-h incubation in medium alone or with medium containing increasing amounts of IFN-α. Luciferase activity, protein expression, and RNA levels were assessed from cell extracts. Each panel shows the luciferase values (an average from three experiments) derived from the 5′ cap (open bars) or viral IRES (shaded bars) as a percentage with standard deviations relative to cells cultured without IFN. The lower panel set shows Northern blot analyses of 3.3-kb pRL-HL bicistronic RNA (pRL-HL) and GAPDH (GDH) RNA levels (left) and a representative immunoblot analysis of PKR, P56, and actin protein levels (right) within the cultures corresponding to the pRL-HL transfected cells shown in the middle panel. Lanes show untransfected control cells (denoted as “C” on the Northern blot) or cells transfectedwith pRL-HL that were cultured for 24 h in the absence of IFN (lane 1) or increasing concentrations of IFN (lanes 2 to 4). We also conducted Northern blot analysis of RNA isolated from cells that were transfected with pCMVRluc-EFluc, and we confirmed that the corresponding bicistronic luciferase RNA was expressed to similar levels across all conditions (data not shown). (B) The PKR pathway influences IRES translation. Huh7 cells were cotransfected with bicistronic plasmid reporter constructs to simultaneously assess 5′ cap-dependent Renilla luciferase translation (cap) and EMCV IRES (upper panel) or HCV IRES-dependent firefly luciferase translation (middle panel) in the presence of an additional plasmid encoding the vector alone, the NS5A protein from the K2040 or L2198S HCV replicon, PKR K296R, or eIF2α S51A. At 24 h after transfection the culture medium was replaced with DMEM alone (IFN−) or DMEM containing 100 U of IFN-α/ml (IFN+) and, after an additional 24 h, the cells were harvested and extracts were subjected to the dual luciferase assay. Bars show the percentages of the luciferase levels relative to the values obtained from cultures cotransfected with the vector control (an average and standard deviation from three experiments) derived from 5′cap-dependent translation (open bars) or viral IRES-dependent translation (shaded bars). The lower panel set shows Northern blot analysis of the pRL-HL bicistronic luciferase RNA (pRL-HL) and GAPDH (GDH) RNA levels (left panel) and immunoblot analyses of NS5A, PKR, phospho-eIF2α (eIF2α-P), total eIF2α, and actin levels (right panel) in extracts derived from cells that were cotransfected with pRL-HL and expression constructs encoding the vector control (lanes 1 and 2), K2040 NS5A (lane 3), L2198S NS5A (lane 4), PKR K296R (lane 5; the hash mark denotes the position of HA-PKR K296R), or eIF2α S51A (lane 6), either treated or not treated with IFN as indicated. “C” (left panel set) denotes untransfected control cultures. In similar analyses, we confirmed that equal RNA and protein levels were present in cells cotransfected with pCMVRluc-Efluc (data not shown).
FIG. 5.
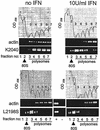
Polyribosome distribution analysis. Huh7 cells harboring the K2040 or L2198S HCV replicon were cultured for 24 h alone (no IFN; left panel sets) or in the presence of 10 U of IFN-α/ml (right panel sets). Cell extracts were prepared and fractionated by sucrose gradient ultracentrifugation, and fractions were collected while the optical density at 258 nm (OD258) was monitored. The gradient distribution of β-actin mRNA and HCV replicon RNA was assessed by semiquantitative RT-PCR of an equal volume of total RNA isolated from each fraction. The OD258 profile and RT-PCR analysis for the fractionation procedures are shown. In each case the gradient positions of the 80S ribosome and polysomes are indicated and were confirmed by assessing the rRNA distribution pattern within the gradient fractions (data not shown). Fraction numbers shown below each lane of the RT-PCR panels correspond to the numbers shown on the associated OD258 profile. “+” and “−” indicate PCR plasmid control and a control RT-PCR of template RNA without the RT step. The results shown are representative of three separate experiments.
FIG. 6.
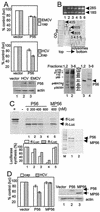
Polysome distribution of P56 and eIF3 proteins, and analysis of P56 action on viral IRES function. (A) Regulation of viral IRES function by P56. Huh7 cells were cotransfected with vector alone or a P56 expression plasmid and the pCMVRluc-EFluc or pRL-HL bicistronic luciferase reporter construct to simultaneously assess 5′ cap-dependent Renilla luciferase translation (cap; open bars) and EMCV IRES (shaded bars; upper panel) or HCV IRES-dependent firefly luciferase translation (shaded bars; middle panel), respectively, in the presence of P56 expression. Cells were harvested 24 h after transfection, and cell extracts were subjected to luciferase assay and immunoblot analysis. In addition, total RNA was extracted from an aliquot of each culture to assess luciferase mRNA levels, which were similar in all cultures (data not shown). The upper and middle panels show the average and standard deviation luciferase expression levels derived from three independent experiments and are presented as a percentage of the control cultures that were cotransfected with an empty expression vector. The lower panel set shows an immunoblot of P56 and actin protein levels expressed in extracts prepared from the cul-tures that were cotransfected with pRL-HL and vector alone (lane 1), pRL-HL and the P56 expression plasmid (lane 2), or pCMVRluc-EFluc and the P56 expression plasmid (lane 3). (B) P56 is codistributed with the p48 subunit of eIF3. Proteins were extracted from the indicated fractions recovered from the polyribosome fractionation procedure depicted in the rRNA gel and OD258 profile (upper panels). For these experiments the fractions were collected in the absence of proteinase K. The top panel shows rRNA within equal volumes of total RNA isolated from the sucrose gradient fractions numbered below each lane, and fractions correspond the peaks depicted in the OD258 profile (middle panel). Proteins isolated from fractions containing the 40S and 60S ribosomal subunits and 80S monosomes (fractions 1 and 2) or those isolated from polyribosome fractions (fractions 3 to 6) were pooled. A total of 25 μg of each protein pool was separated by SDS-PAGE and subjected to immunoblot analysis. The lower panels show the same blot that was first probed with antiserum against eIF3 (left panel), stripped, and then reprobed with antiserum to P56 (right panel). Lanes of each panel correspond to proteins pooled from fractions 1 and 2 (lane 1) or fractions 3 to 6 (lane 2). The positions of P56 and the eIF3 subunits are indicated. p48 is indicated in boldface. Molecular mass standards are shown in kilodaltons. (C) Functional analysis of P56 on HCV IRES translation in vitro. Rabbit reticulocyte lysates were incubated with increasing nanomolar amounts of purified recombinant P56 or MP56 in the presence of [35S]methionine and equal amounts of in vitro-transcribed RNA generated from the bicistronic pRL-HL construct. The pRL-HL RNA directs Renilla and firefly luciferase translation from the 5′ cap and HCV IRES, respectively. Equal volumes of the translation products were resolved on SDS-PAGE. The upper panel shows an autoradiogram of the dried gel. The positions of firefly (ff-Luc) and Renilla (R-Luc) luciferase are shown. “+” and “−” denote control translation reactions programmed with RNA encoding firefly luciferase or with buffer only, respectively. The level of Renilla (shaded bars) and firefly luciferase translation products (open bars) in lanes 1 to 5 were quantified by phosphorimager analysis and are presented as a percentage of the lane 1 translation reaction, which was conducted in the absence of P56. The right panel shows an image from a Coomassie blue-stained gel containing resolved aliquots of purified recombinant P56 and MP56 preparations that were used in the translation reactions. The results were reproduced in three separate experiments. (D) Functional analysis of P56 on HCV IRES translation in vivo. Huh7 cells were cotransfected with pRL-HL and either an empty control expression vector or an expression plasmid encoding P56 or MP56. After 24 h the cells were harvested, and extracts were subjected to luciferase assay and immunoblot analysis. The left panel shows the average and standard deviation (obtained from three independent experiments) of 5′ cap-dependent (open bars) and HCV IRES-dependent luciferase values (shaded bars) expressed as a percentage of the values derived from cultures cotransfected with the vector control. The right panel set shows P56, MP56, and actin expression within the corresponding cell extracts. Expression of P56 resulted in an average 35% reduction in HCV IRES translation.
FIG. 7.
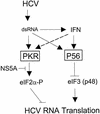
HCV RNA replication and IFN induce parallel translation control programs that impact virus replication. Our results demonstrate that HCV RNA replication has the capacity to activate PKR and to induce P56 expression through dsRNA signaling events that induce the host cell antiviral state (8, 40). During the antiviral response, PKR and P56 can function in parallel to limit viral RNA translation through the phosphorylation of eIF2α and disruption of eIF3 function, respectively. NS5A quasispecies that are competent to bind and inhibit PKR, such as the K2040 variant (40), can relieve the PKR-dependent translational control to increase the overall efficiency of viral RNA translation and replication. This regulation results in higher viral loads and may contribute a level of resistance against the antiviral actions of IFN (24). The HCV IRES, perhaps through a unique dependence upon eIF3 and/or the p48 eIF3 subunit (39), is acutely sensitive to the actions of P56. Our results suggest that sensitivity to P56 contributes to the dominant antiviral effects of IFN upon HCV IRES function, which may effectively limit HCV replication.
Similar articles
- Interferon and ribavirin combination treatment synergistically inhibit HCV internal ribosome entry site mediated translation at the level of polyribosome formation.
Panigrahi R, Hazari S, Chandra S, Chandra PK, Datta S, Kurt R, Cameron CE, Huang Z, Zhang H, Garry RF, Balart LA, Dash S. Panigrahi R, et al. PLoS One. 2013 Aug 23;8(8):e72791. doi: 10.1371/journal.pone.0072791. eCollection 2013. PLoS One. 2013. PMID: 24009705 Free PMC article. Retracted. - Antiapoptotic and oncogenic potentials of hepatitis C virus are linked to interferon resistance by viral repression of the PKR protein kinase.
Gale M Jr, Kwieciszewski B, Dossett M, Nakao H, Katze MG. Gale M Jr, et al. J Virol. 1999 Aug;73(8):6506-16. doi: 10.1128/JVI.73.8.6506-6516.1999. J Virol. 1999. PMID: 10400746 Free PMC article. - Regulation of mRNA translation and cellular signaling by hepatitis C virus nonstructural protein NS5A.
He Y, Tan SL, Tareen SU, Vijaysri S, Langland JO, Jacobs BL, Katze MG. He Y, et al. J Virol. 2001 Jun;75(11):5090-8. doi: 10.1128/JVI.75.11.5090-5098.2001. J Virol. 2001. PMID: 11333890 Free PMC article. - Repression of the PKR protein kinase by the hepatitis C virus NS5A protein: a potential mechanism of interferon resistance.
Gale MJ Jr, Korth MJ, Katze MG. Gale MJ Jr, et al. Clin Diagn Virol. 1998 Jul 15;10(2-3):157-62. doi: 10.1016/s0928-0197(98)00034-8. Clin Diagn Virol. 1998. PMID: 9741641 Review.
Cited by
- Ifit1 inhibits Japanese encephalitis virus replication through binding to 5' capped 2'-O unmethylated RNA.
Kimura T, Katoh H, Kayama H, Saiga H, Okuyama M, Okamoto T, Umemoto E, Matsuura Y, Yamamoto M, Takeda K. Kimura T, et al. J Virol. 2013 Sep;87(18):9997-10003. doi: 10.1128/JVI.00883-13. Epub 2013 Jul 3. J Virol. 2013. PMID: 23824812 Free PMC article. - Free fatty acids induce ER stress and block antiviral activity of interferon alpha against hepatitis C virus in cell culture.
Gunduz F, Aboulnasr FM, Chandra PK, Hazari S, Poat B, Baker DP, Balart LA, Dash S. Gunduz F, et al. Virol J. 2012 Aug 3;9:143. doi: 10.1186/1743-422X-9-143. Virol J. 2012. PMID: 22863531 Free PMC article. - The broad-spectrum antiviral functions of IFIT and IFITM proteins.
Diamond MS, Farzan M. Diamond MS, et al. Nat Rev Immunol. 2013 Jan;13(1):46-57. doi: 10.1038/nri3344. Epub 2012 Dec 14. Nat Rev Immunol. 2013. PMID: 23237964 Free PMC article. Review. - Inhibition of hepatitis C virus infection and expression in vitro and in vivo by recombinant adenovirus expressing short hairpin RNA.
Sakamoto N, Tanabe Y, Yokota T, Satoh K, Sekine-Osajima Y, Nakagawa M, Itsui Y, Tasaka M, Sakurai Y, Cheng-Hsin C, Yano M, Ohkoshi S, Aoyagi Y, Maekawa S, Enomoto N, Kohara M, Watanabe M. Sakamoto N, et al. J Gastroenterol Hepatol. 2008 Sep;23(9):1437-47. doi: 10.1111/j.1440-1746.2007.05076.x. Epub 2007 Aug 7. J Gastroenterol Hepatol. 2008. PMID: 17683479 Free PMC article.
References
- Alter, M. J., D. Kruszon-Moran, O. V. Nainan, G. M. Mcquillan, F. Gao, L. A. Moyer, R. A. Kaslow, and H. S. Margolis. 1999. The prevelance of hepatitis C virus infection in the United States, 1988 through 1994. N. Engl. J. Med. 314:556-562. - PubMed
- Alter, M. J. H. 1997. Epidemiology of hepatitis C. Hepatology 26:62-65. - PubMed
- Asano, K., W. Merrick, and J. Hershey. 1997. The translation initiation factor eIF3-p48 subunit is encoded by int-6, a site of frequent integration by the mouse mammary tumor virus genome. J. Biol. Chem. 272:23477-23480. - PubMed
- Baron, S., S. K. Tyring, W. R. Fleischmann, Jr., D. H. Coppenhaver, D. W. Niesel, G. R. Klimpel, G. J. Stanton, and T. K. Hughes. 1991. The interferons: mechanisms of action and clinical applications. J. Am. Med. Assoc. 266:1375-1383. - PubMed
- Blight, K. J., A. A. Kolykhalov, and C. M. Rice. 2000. Efficient inititation of HCV RNA replication in cell culture. Science 290:1972-1974. - PubMed
Publication types
MeSH terms
Substances
Grants and funding
- R37 AI035522/AI/NIAID NIH HHS/United States
- T32 GM08203/GM/NIGMS NIH HHS/United States
- AI35522/AI/NIAID NIH HHS/United States
- CA68782/CA/NCI NIH HHS/United States
- AI48235/AI/NIAID NIH HHS/United States
- U01 AI048235/AI/NIAID NIH HHS/United States
- R01 AI035522/AI/NIAID NIH HHS/United States
- T32 GM008203/GM/NIGMS NIH HHS/United States
- R01 CA068782/CA/NCI NIH HHS/United States
LinkOut - more resources
Full Text Sources
Other Literature Sources
Research Materials
