The representation of retinal blood vessels in primate striate cortex - PubMed (original) (raw)
The representation of retinal blood vessels in primate striate cortex
Daniel L Adams et al. J Neurosci. 2003.
Abstract
The blood vessels that nourish the inner retina cast shadows on photoreceptors, creating "angioscotomas" in the visual field. We have found the representations of angioscotomas in striate cortex of the squirrel monkey. They were detected in 9 of 12 normal adult animals by staining flatmounts for cytochrome oxidase activity after enucleation of one eye. They appeared as thin profiles in layer 4C radiating from the blind spot representation. Angioscotomas can be regarded as a local form of amblyopia. After birth, when light strikes the retina, photoreceptors beneath blood vessels are denied normal visual stimulation. This deprivation induces remodeling of geniculocortical afferents in a distribution that corresponds to the retinal vascular tree. Angioscotoma representations were most obvious in monkeys with fine ocular dominance columns and were invisible in monkeys with large, well segregated columns. In monkeys without columns, their width corresponded faithfully to the inducing retinal shadow, making it possible to calculate the minimum shadow required to produce a cortical representation. The "amblyogenic threshold" was calculated as the fraction of the pupil area eclipsed to trigger remodeling of geniculocortical afferents. It was found to be constant over retinal eccentricity, vessel size, and shadow size. Ambliogenic shadows only three to four cones wide were sufficient to generate a cortical representation, testifying to the remarkable precision of the cortical map. The representations of retinal blood vessels separated by only 0.65 degrees were resolvable in the cortex, yielding an upper limit on cortical resolution of 340 microm in layer 4C.
Figures
Figure 2.
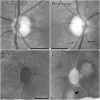
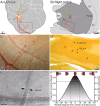
Monkey K. Fundus pictures showing the optic discs and retinal vessels. Below are single CO sections through layer 4C showing the representations of the optic discs pictured directly above. The left eye was enucleated, so the right blind spot representation (represented in the left cortex) appears pale. The thin lines radiating from the blind spot representations are the representations of angioscotomas from shadows cast by retinal vessels leaving the optic disc. Tissue between the arrows is shown in cross section in Figure 5. The leftmost vessel, an artery, is indicated below in the cortex by an arrowhead.
Figure 1.
To detect one's own angioscotomas, close the right eye and stare at the X while holding the page ∼40 cm away. The oval will disappear into your blind spot. Slowly move the page a bit closer or farther away. The black dash above the blind spot will disappear when it falls into the angioscotoma created by your inferior temporal retinal vein. Next, shift your gaze methodically from one letter to the next. As you proceed leftward, you will lose the black dash again. This occurs when it falls in the angioscotoma of the inferior temporal artery.
Figure 3.
Monkey K. A, Single section of layer 3, cut through the same region of the right cortex shown in Figure 2 (see bottom left panel) but 210 μm more superficial. CO patches are present throughout the area. No effect of monocular enucleation is visible. The blind spot representation is not apparent, because the upper layers in squirrel monkey contain highly binocular cells. B, Same section as in A, with the locations of the blind spot and angioscotomas from layer 4 outlined with dots. The patches neither skirt nor follow the path of the angioscotomas. C, Single section grazing layer 4A, immediately adjacent to the section shown above. The region overlying the blind spot representation appears slightly darker than surrounding cortex, but the angioscotomas are not visible. D, Single section cut mostly through layer 5, 105 μm below the section shown from layer 4C in Figure 2, bottom left. No hint of the blind spot or angioscotomas is seen.
Figure 4.
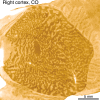
Macaque monkey. A, Single CO section through layer 4C, after enucleation of the contralateral eye. This experiment was done in connection with an unrelated project and is shown here simply for comparison with Figure 2, bottom left panel. The blind spot representation appears dark, as in the squirrel monkey. The striking difference is that the surrounding cortex is organized into high-contrast, large, sharply defined ocular dominance columns. B, Section from the same region, 315 μm more superficial, passing through layer 3. The patches in every other row appear pale, as opposed to the squirrel monkey, in which all patches retain the same level of CO activity after monocular enucleation. In addition, the blind spot representation is visible as an oval dark zone matching its shape in layer 4C. The blind spot representation is visible in all layers because the cortex outside layer 4 retains greater monocularity than in the squirrel monkey.
Figure 5.
Monkey K. Plastic section (1 μm) of the right eye, stained with Toluidine blue, passing between the arrows shown in Figure 2. The precise location was pinpointed by the junction between the vein and its branch, which can be seen in the retinal photograph, although it is a bit out of focus. Near the optic disc, large vessels are situated in the nerve fiber layer, which becomes especially thickened. The vein branch enters and disrupts the ganglion cell layer. The artery on the left, the angioscotoma representation of which is marked by an arrowhead in Figure 2, has a lumen diameter of 57 μm. This was calculated by measuring the lumen circumference and dividing by π (we assumed the oval shape was a postmortem artifact). The small arrows denote four ellipsoids of cone inner segments, located underneath the artery. NFL, Nerve fiber layer; GCL, ganglion cell layer; IPL, inner plexiform layer; INL, inner nuclear layer; OPL, outer plexiform layer; ONL, outer nuclear layer; IS, inner segments; OS, outer segments; PE, pigment epithelium.
Figure 6.
A, Schematic scale drawing of the squirrel monkey eye illustrating the paths of light from the pupil to the retina. The dimensions used to calculated the size of shadows cast by retina blood vessels are labeled: p, pupil diameter; d, pupil aperture to blood vessel distance. B, The boxed region of retina from A shown at higher magnification. The rays of light are shown superimposed onto a 1 μm plastic section of squirrel monkey retina. A single artery of lumen diameter c is present in the retinal ganglion cell layer at a distance s from the photoreceptor inner/outer segment transition plane (the shadow plane). The shadow cast by this vessel comprises a central total shadow (umbra) bordered by a peripheral partial shadow (penumbra).
Figure 7.
Monkey Q, right retina. A, Stacked series of 20 plastic cross sections (1 μm), each 125 μm apart, compiled to measure s (distance from center of blood vessel lumen to cone inner/outer segment junction) for individually identified vessels at different locations. Boxed vessel is shown in panels below. B, Photograph of right fundus, outlining the retina illustrated histologically (A) with a rectangle. The fine vertical white lines indicate the positions of cross sections shown below. C, High-power view of venule only 28 μm in lumen diameter (calculated assuming circular cross section), the representation of which was visible in the cortex. The vessel was located at an eccentricity of 7.5° and cast only penumbra, equal to 83 μm (gradient between thin black lines), on the basis of values s = 243 μm, p = 1.9 mm, d = 8.4 mm. D, The same venule, but at an eccentricity of 4.1°, cast only penumbra, measuring 64 μm, on the basis of the indicated parameters. This shadow did not induce a visible representation in the cortex. OD, Optic disc.
Figure 8.
A, Graph showing the widths of shadows cast onto photoreceptors by retinal vessels of different lumen (c) at various pupil diameters (p). Solid lines represent the width of the umbra alone, and dotted lines represent the width of the whole shadow (umbra + twice penumbra). Pupil diameters of 1, 3, and 4 mm are shown, plus 1.9 mm, the experimentally determined value for an infant squirrel monkey. The values of s and d were 200 μm and 8.4 mm, respectively. B, Graph showing the widths of shadows cast onto photoreceptors by retinal vessels of different lumen (c), at various distances (s) from the photoreceptor layer. Solid lines represent the width of the umbra alone, and dotted lines represent the width of the total shadow. Five values of s are shown: 100–300 μm. For this graph, p and d were fixed at 1.9 and 8.4 mm, respectively.
Figure 9.
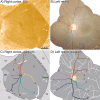
Monkey L, right hemisphere. A, CO flatmount montage, showing dark blind spot and angioscotoma representations after enucleation of the left eye. Except for some fluctuations in CO density near the monocular crescent, ocular dominance columns were essentially absent in this animal. B, Photomontage of the left fundus. C, Drawing of angioscotomas. D, Drawing of retina, with color-coded vessels represented in the cortex.
Figure 10.
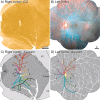
Monkey Q, right hemisphere. A, Layer 4C CO montage, showing blind spot with 12 radiating angioscotoma representations. They are pale because the right eye was enucleated. The angioscotomas are particularly extensive and obvious in this animal. A fine pattern of rather indistinct ocular dominance columns is present. B, Retinal montage, compiled from fundus pictures taken in vivo. C, Color-coded drawing of angioscotomas visible in A. A few angioscotomas of reversed (dark) CO contrast, induced by vessels in the temporal retina of the right eye, are shown in black. D, Drawing showing 12 vessels in nasal retina represented in the right cortex.
Figure 11.
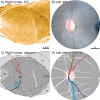
Monkey E, right hemisphere. A, CO flatmount montage, showing dark blind spot and angioscotoma representations after enucleation of the left eye. A pattern of “intermediate” ocular dominance columns can be seen throughout the cortex except in the representation of the blind spot and monocular crescent. Only the largest blood vessels are represented within the ocular dominance mosaic. B, Single fundus photograph including the optic disk, major retinal vessels, and fovea. C, Drawing of angioscotomas. Dotted line represents striate cortex corresponding to the extent of the fundus photograph. D, Drawing of retina, with color-coded vessels represented in the cortex. Star, Fovea.
Figure 12.
Monkey N, right cortex. A highly segregated pattern of coarse ocular dominance columns (reminiscent of macaque and human striate cortex) precludes the formation of angioscotoma representations.
Figure 13.
Schematic illustration of the relationship between ocular dominance column periodicity and angioscotoma visibility in the cortex. The pattern of geniculate afferents from the left and right eye is represented as black and white. The region of striate cortex shown here contains the superior half of the blind spot representation. The four panels show examples of different column periodicities: A, rudimentary columns (monkeys L, K); B, fine columns (monkeys C, Q); C, intermediate columns (monkey E); D, coarse columns (monkey N). Note that angioscotomas are best seen in animals with fine columns, because they are highlighted by columns serving the other eye. Angioscotomas are not well seen in animals with coarser, better segregated columns, because the columns override the angioscotoma pattern.
Figure 14.
Monkey K. A, Diagram showing vessels represented in cortex of monkey K, an animal with only rudimentary ocular dominance columns. A photograph of the left optic disc is shown in Figure 2. The boxed region is shown in C. B, Diagram showing the angioscotomas visible in the right cortex, color-coded to vessels in A. The angioscotomas near the optic disc are shown in Figure 2. C, View of a small venule (red arrows) crossing the inferotemporal artery at an eccentricity of 12.5°. D, Single CO-stained section, showing representation of the venule, which measured 102 μm in the cortex. E, Photomicrograph of the unstained retinal whole mount, showing the boxed region in C where the venule crosses the artery. At this location the venule had a lumen diameter of 30 μm. The cobblestone pattern of cones is shown for comparison with the size of the blood vessels. This figure was prepared by photographing the retinal layers containing the cones and vessels separately. Photoshop 6.0 was then used to superimpose the vessels on the cone mosaic. Cones underneath the blood vessels are obscured by red cells. F, Graph showing the fraction of pupil occlusion as a function of distance on the retina from the center of the penumbra cast by the venule in E. The shadow eclipsed a maximum of 86% of the pupil. The central 20 μm (between vertical dashed lines) of the 72 μm penumbra had sufficient contrast to produce a representation in the cortex, corresponding to an amblyogenic threshold of 66% pupil occlusion. Pupil occlusion is illustrated schematically by red vessel eclipsing gray pupil at five different positions.
Figure 15.
Monkey C. A, Upper pole of the left optic disc, showing an emerging superior retinal artery and vein. The vessels (blue arrowheads) remain completely separate along their retinal course. B, Corresponding region from the right striate cortex, showing the cortical representation of the vessels in layer 4C (blue arrowheads). They merge ∼2 mm above the optic disc representation. At this point, the centers of the retinal vessels are 0.65° apart and their cortical representations are 340 μm apart.
Similar articles
- Ocular dominance columns: enigmas and challenges.
Adams DL, Horton JC. Adams DL, et al. Neuroscientist. 2009 Feb;15(1):62-77. doi: 10.1177/1073858408327806. Neuroscientist. 2009. PMID: 19218231 Free PMC article. Review. - The effect of angioscotomas on map structure in primary visual cortex.
Giacomantonio CE, Goodhill GJ. Giacomantonio CE, et al. J Neurosci. 2007 May 2;27(18):4935-46. doi: 10.1523/JNEUROSCI.1261-06.2007. J Neurosci. 2007. PMID: 17475802 Free PMC article. - The cortical representation of shadows cast by retinal blood vessels.
Horton JC, Adams DL. Horton JC, et al. Trans Am Ophthalmol Soc. 2000;98:33-8; discussion 38-9. Trans Am Ophthalmol Soc. 2000. PMID: 11190031 Free PMC article. - Ocular integration in the human visual cortex.
Horton JC. Horton JC. Can J Ophthalmol. 2006 Oct;41(5):584-93. doi: 10.1016/S0008-4182(06)80027-X. Can J Ophthalmol. 2006. PMID: 17016529 Review. - A precise retinotopic map of primate striate cortex generated from the representation of angioscotomas.
Adams DL, Horton JC. Adams DL, et al. J Neurosci. 2003 May 1;23(9):3771-89. doi: 10.1523/JNEUROSCI.23-09-03771.2003. J Neurosci. 2003. PMID: 12736348 Free PMC article.
Cited by
- Adaptation of the central retina for high acuity vision: cones, the fovea and the avascular zone.
Provis JM, Dubis AM, Maddess T, Carroll J. Provis JM, et al. Prog Retin Eye Res. 2013 Jul;35:63-81. doi: 10.1016/j.preteyeres.2013.01.005. Epub 2013 Mar 15. Prog Retin Eye Res. 2013. PMID: 23500068 Free PMC article. Review. - Ocular dominance columns: enigmas and challenges.
Adams DL, Horton JC. Adams DL, et al. Neuroscientist. 2009 Feb;15(1):62-77. doi: 10.1177/1073858408327806. Neuroscientist. 2009. PMID: 19218231 Free PMC article. Review. - On the origin of the functional architecture of the cortex.
Ringach DL. Ringach DL. PLoS One. 2007 Feb 28;2(2):e251. doi: 10.1371/journal.pone.0000251. PLoS One. 2007. PMID: 17330140 Free PMC article. - Human trichromacy revisited.
Horiguchi H, Winawer J, Dougherty RF, Wandell BA. Horiguchi H, et al. Proc Natl Acad Sci U S A. 2013 Jan 15;110(3):E260-9. doi: 10.1073/pnas.1214240110. Epub 2012 Dec 19. Proc Natl Acad Sci U S A. 2013. PMID: 23256158 Free PMC article. - The effect of angioscotomas on map structure in primary visual cortex.
Giacomantonio CE, Goodhill GJ. Giacomantonio CE, et al. J Neurosci. 2007 May 2;27(18):4935-46. doi: 10.1523/JNEUROSCI.1261-06.2007. J Neurosci. 2007. PMID: 17475802 Free PMC article.
References
- Adams DL, Horton JC ( 2003a) Capricious expression of cortical columns in the primate brain. Nat Neurosci 6: 113–114. - PubMed
- Applegate RA, Bradley A, van Heuven WA ( 1990) Entoptic visualization of the retinal vasculature near fixation. Invest Ophthalmol Vis Sci 31: 2088–2098. - PubMed
Publication types
MeSH terms
Grants and funding
- RR00169/RR/NCRR NIH HHS/United States
- R01 EY10217/EY/NEI NIH HHS/United States
- EY02162/EY/NEI NIH HHS/United States
- R01 EY010217/EY/NEI NIH HHS/United States
- P30 EY002162/EY/NEI NIH HHS/United States
- P51 RR000169/RR/NCRR NIH HHS/United States
LinkOut - more resources
Full Text Sources
Miscellaneous
