Mechanism of constitutive export from the golgi: bulk flow via the formation, protrusion, and en bloc cleavage of large trans-golgi network tubular domains - PubMed (original) (raw)
Mechanism of constitutive export from the golgi: bulk flow via the formation, protrusion, and en bloc cleavage of large trans-golgi network tubular domains
Elena V Polishchuk et al. Mol Biol Cell. 2003 Nov.
Abstract
Transport of constitutive cargo proteins from the Golgi complex to the plasma membrane (PM) is known to be mediated by large tubular-saccular carriers moving along microtubules. However, the process by which these large structures emerge from the trans-Golgi network (TGN) remains unclear. Here, we address the question of the formation of Golgi-to-PM carriers (GPCs) by using a suitable cluster of morphological techniques, providing an integrated view of their dynamics and three-dimensional structure. Our results indicate that exit from the TGN of a constitutive traffic marker, the VSVG protein, occurs by bulk flow and is a three-step process. First, the formation of a tubular-reticular TGN domain (GPC precursor) that includes PM-directed proteins and excludes other cargo and Golgi-resident proteins. Notably, this step does not require membrane fusion. Second, the docking of this preformed domain on microtubules and its kinesin-mediated extrusion. Finally, the detachment of the extruded domain by membrane fission. The formation of GPCs does not involve cargo concentration and is not associated with the presence of known coat proteins on GPC precursors. In summary, export from the Golgi occurs via the formation, protrusion and en bloc cleavage of specialized TGN tubular-saccular domains.
Figures
Figure 9.
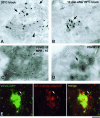
Distribution of VSVG and adaptor proteins upon exit from the Golgi. (A and B) VSV-infected Cos7 cells were fixed at the end of the 20°C block (A) or shortly after the shift to 32°C (B) and stained with an anti-VSVG antibody for immuno-EM. A similar density of gold particles is seen on the TGN (A, arrows) and the free GPC (B, arrow), with a lesser extent of labeling at the _cis_-face of the Golgi stack (A, arrowhead). (C and D) VSV-infected Cos7 cells were fixed at the end of the 20°C block (C) or 10 min after the block release (D) and prepared for cryo-immuno-EM with anti-VSVG and anti-MPR antibodies. VSVG (5-nm gold) is distributed throughout the TGN membranes (C), except at coated profiles where MPR (10-nm gold) resides (arrowhead). A GPC (D, arrow) exhibits a similar density of VSVG labeling as the TGN (C). (E) A VSVG-GFP–transfected Cos7 cell was exposed to the 40 and 20°C blocks. The cell was shifted to 32°C, fixed at the moment when a GPC precursor started to extend from the Golgi, and stained with an antibody against α-tubulin. Immunostaining revealed that the GPC precursor (arrow) does not contain δ-adaptin. Bar, 200 nm (A–D) and 4 μm (E).
Figure 1.
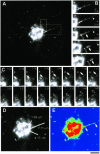
Process of GPC formation. (A) Cos7 cells were transfected with temperature-sensitive VSVG-GFP and kept at 40°C for 4 h and then at 20°C for 2 h, before being shifted to 32°C to initiate transport out of the Golgi. VSVG-GFP exit from the Golgi was observed in specific regions of interest (indicated by boxes) (Movie 1a). (B) Sequential time-lapse images, corresponding to the dashed box region of the cell in A, demonstrate the breakdown of this tubular GPC precursor into three carriers (arrows, arrowhead). (C) Sequential time-lapse images, corresponding to the area defined by the solid box in (A), show the successive formation of two different GPCs (white arrow, black arrow) from the same area of the Golgi. (D) Orientation and length (white lines) of three tubular precursors from which GPCs formed during the course of the observation. (E) The same cell is shown in false colors to indicate the intensity of the VSVG-GFP fluorescence. The arrows indicate the areas of VSVG-GFP concentration within the tubule shown in B. Bar, 4.65 μm (A), 4 μm (B–E).
Figure 2.
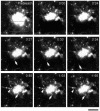
GPC formation within the core region of the Golgi complex. VSVG-GFP transfected Cos7 cells were exposed to the 40°C block for 4 h, shifted to 32°C, and after 30 min observed by confocal microscopy. The portion of the Golgi complex indicated (dashed box) was bleached (Movie 2). Sequential time-lapse images show that formation of GPCs from tubular precursors occurs both in the bleached (arrows) and unbleached (arrow-heads) regions. Bar, 4.8 μm.
Figure 3.
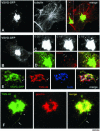
Molecular composition of GPC precursors and their association with microtubules. (A) A VSVG-GFP–transfected Cos7 cell was exposed to the 40 and 20°C blocks, shifted to 32°C, fixed just after the detachment of a GPC from its tubular precursor (Movie 3a), and then stained with an antibody against α-tubulin. Both the GPC (arrow) and the tubular domain of its exit from the Golgi (arrowheads) are oriented along microtubules. Inset, right, detail of the Golgi region corresponding to the dashed box region. (B) Formation of a GPC was observed in the Golgi region (dashed box) of a Cos7 cell transfected with VSVG-GFP (Movie 3b). (C) Time-lapse images, corresponding to the dashed box region of the cell in B, show a tubular GPC precursor (arrows) extending from the Golgi. (D) The same GPC precursor in C was fixed and stained for kinesin. Immunolabeling indicates the presence of kinesin on the hot spots of GPC precursors (arrows) and free GPCs (arrowhead). (E) A Cos7 cell transfected with VSVG-GFP was observed under confocal microscopy until a GPC precursor (arrow) started to bud from the Golgi (Movie 3d). At this moment, the cell was fixed and stained for TGN46 and furin. Distribution of these markers revealed that the GPC precursor contains TGN46, but does not contain furin (arrow). (F) A Cos7 cell grown under steady-state conditions (no temperature blocks, no VSVG-GFP transfection) was fixed and stained for TGN46 and giantin. A free tubule (arrow) and a tubule attached to the Golgi (arrowhead) are seen to contain TGN46 and to exclude giantin. Bar, 7 μm (A and B), 4.3 μm (C and D), 4 μm (E), and 2.9 μm (F).
Figure 4.
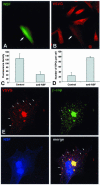
Post-Golgi transport of VSVG after microinjection of an anti-NSF antibody. (A and B) BHK cells were infected with VSV, exposed to the 40°C block, and microinjected with an anti-NSF antibody (mixed with fluorescent dextran) during the 20°C block. They were then shifted to 32°C for 30 min, fixed, and stained with an antibody against the ectodomain of VSVG without permeabilization. The microinjected BHK cell (arrows) exhibits less VSVG signal on its cell surface in comparison with the noninjected cells in B. (C) Fluorescence density of VSVG surface staining (mean ± SD) was quantified in mock-injected (n = 35) and anti-NSF-antibody–injected (n = 35) cells (arbitrary units), treated as in A and B. (D) Cells were infected with VSV, treated as in A and B, fixed, permeabilized, and stained with an anti-VSVG antibody conjugated with Cy3. The number of GPCs (mean ± SD) in mock-injected (n = 20) and anti-NSF-antibody–injected (n = 20) cells 30 min after the release of the 20°C block are shown. (E) A BHK cell was infected with VSV, microinjected at 20°C, shifted to 32°C for 30 min, and then fixed, permeabilized, and stained for VSVG and β-COP. Numerous β-COP–negative GPCs have accumulated within the cytoplasm of the injected cell (arrows). Bar, 34 μm (A and B) and 12 μm (E).
Figure 5.
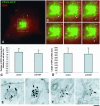
Dynamics and ultrastructure of GPCs in anti-NSF-antibody–microinjected cells. (A) A BHK cell was transfected with VSVG-GFP, exposed to the 40°C block, and microinjected with an anti-NSF antibody (mixed with fluorescent dextran) during the 20°C block. Shortly after the temperature shift to 32°C, the cell was observed in vivo under confocal microscope (Movie 5). (B) Time-lapse images, corresponding to the dashed box region of the cell in A show formation of VSVG-GFP–positive GPCs from tubular precursors (arrows and arrowheads). (C) BHK cells were treated and observed in vivo as in A. The number of GPCs forming from tubular precursors per cell per min (mean ± SD) in mock-injected (n = 13) and anti-NSF-antibody-injected (n = 11) cells is shown. (D) BHK cells were infected with VSV, exposed to the 40°C block, and microinjected during the 20°C block. Thirty minutes after the 20°C block release, they were fixed, labeled for VSVG by using the immunogold protocol, and prepared for EM. GPC profiles were found in thin sections and their length (mean ± SD) was measured in mock-injected (n = 15) and anti-NSF-antibody-injected (n = 15) cells. (E and F). Immuno-gold labeling of VSVG reveals that the morphology of GPCs (arrows) is similar in control (D) and anti-NSF-antibody-injected (E) cells. Arrowheads indicate fenestrae within GPCs. Bar, 7 μm (A), 4.5 μm (B), and 95 nm (E and F).
Figure 6.
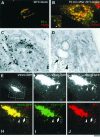
VSVG and PC-I exit the Golgi within the same GPCs. (A) HFs were infected with VSV, exposed to the 40 and 20°C blocks, and stained with antibodies against VSVG and PC-I. Both VSVG and PC-I reside within the Golgi after the 20°C block. (B) HFs as in A, 10 min after the release of the 20°C block, both VSVG and PC-I are found within the same GPCs. Inset, detail with arrows indicating a GPC where VSVG and PC-I exhibit an overlap only within the globular part of the GPC, whereas the tubular part of the GPC contains VSVG alone. (C) HFs, infected and treated as in A, were fixed, stained against VSVG by using the immunogold protocol, and prepared for EM. Gold particles reveal the accumulation of VSVG within the Golgi stack and together with PC-I in extensions (arrow). (D) HFs as in C, after the release of the 20°C block; PC-I extensions (arrowhead) and VSVG are found in common large tubular-saccular carriers (arrow, arrowhead) peeling off the Golgi stack. (E) Formation of a GPC was observed in the Golgi region (dashed box) of a HF transfected with VSVG-GFP and exposed subsequently to the 40 and 20°C blocks (Movie 6). (F and G) Time-lapse images, corresponding to the dashed box region of the cell in E, show a tubular GPC precursor (arrow, arrowhead) extending from the Golgi and a GPC (empty arrow) derived from one of them. (H–J) The same GPC precursor in C was fixed and stained for PC-I. Immunolabeling indicates the presence of PC-I within both GPC precursors (arrow, arrowhead) and free GPCs (empty arrow) that had pinched off one of the precursors. Bar, 7.2 μm (A and B), 200 nm (C), 270 nm (D), 8 μm (E), and 3.9 μm (F–J).
Figure 7.
CVEM of a GPC formation site. (A) A VSVG-GFP-transfected Cos7 cell was observed in vivo after the release of the 20°C block and fixed when a GPC precursor (arrow) was seen to extend from the Golgi, along the border of the nucleus (Movie 7). (B–E) After anti-VSVG immunogold labeling, the same cell was embedded in resin and cut into serial sections. The membranes of the same GPC precursor (arrow in D and E) were found in serial sections (B–E). Arrows indicate the membranes of the GPC precursor and its connection with the parent Golgi membranes (white asterisk). Inset in E, detail of the dashed box region in E, showing a complex portion of the GPC precursor containing fenestrae. (F) Three-dimensional reconstruction of the same GPC precursor (green) and a surrounding mitochondrion (red) from the serial sections. Bar, 4.2 μm (A), 560 nm (B–E), 530 nm (F).
Figure 8.
Ultrastructure of a GPC formation site. (A) Thirty minutes after the release of the 40°C block, a VSVG-GFP–transfected HF was fixed at the moment when a GPC precursor extended from the Golgi (arrow; Movie 8). (B) The same cell was labeled with an antibody against VSVG using the immuno-peroxidase protocol, and processed for CVEM. The same GPC formation site (arrow) was found at low EM magnification. (C) Corresponding to the dashed box region of the cell in B, the arrows indicate complex segments of the GPC precursor. Inset, detail of the area defined by the dashed box region in C. Arrows in inset show continuity between the GPC precursor and parent Golgi membranes. Bar, 7.5 μm (A), 3 μm (B), 375 nm (C), and 230 nm (inset).
Figure 10.
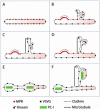
Model of GPC formation and related cargo sorting at the TGN. (A) TGN membrane with VSVG and MPR before GPC formation. (B) Part of the TGN membrane bends, tubulates, and acquires the MT docking device (kinesin, thus becoming a GPC precursor. MPR is segregated from the bulk TGN into clathrin-coated domains. (C) The GPC precursor docks onto a MT and is extruded out of the Golgi. (D) The GPC precursor undergoes fission, and the resulting GPC moves away. (E) The TGN membrane with VSVG and PC-I aggregates before formation of the GPC precursor. (F) On formation of the GPC precursor, both VSVG and PC-I aggregates are incorporated into its membranes.
Similar articles
- ER-to-Golgi carriers arise through direct en bloc protrusion and multistage maturation of specialized ER exit domains.
Mironov AA, Mironov AA Jr, Beznoussenko GV, Trucco A, Lupetti P, Smith JD, Geerts WJ, Koster AJ, Burger KN, Martone ME, Deerinck TJ, Ellisman MH, Luini A. Mironov AA, et al. Dev Cell. 2003 Oct;5(4):583-94. doi: 10.1016/s1534-5807(03)00294-6. Dev Cell. 2003. PMID: 14536060 - Dual-color visualization of trans-Golgi network to plasma membrane traffic along microtubules in living cells.
Toomre D, Keller P, White J, Olivo JC, Simons K. Toomre D, et al. J Cell Sci. 1999 Jan;112 ( Pt 1):21-33. doi: 10.1242/jcs.112.1.21. J Cell Sci. 1999. PMID: 9841901 - Membrane flow through the Golgi apparatus: specific disassembly of the cis-Golgi network by ATP depletion.
del Valle M, Robledo Y, Sandoval IV. del Valle M, et al. J Cell Sci. 1999 Nov;112 ( Pt 22):4017-29. doi: 10.1242/jcs.112.22.4017. J Cell Sci. 1999. PMID: 10547362 - Morphogenesis of post-Golgi transport carriers.
Luini A, Mironov AA, Polishchuk EV, Polishchuk RS. Luini A, et al. Histochem Cell Biol. 2008 Feb;129(2):153-61. doi: 10.1007/s00418-007-0365-8. Epub 2008 Jan 23. Histochem Cell Biol. 2008. PMID: 18214517 Free PMC article. Review. - Molecular mechanisms responsible for formation of Golgi ribbon.
Mironov AA, Beznoussenko GV. Mironov AA, et al. Histol Histopathol. 2011 Jan;26(1):117-33. doi: 10.14670/HH-26.117. Histol Histopathol. 2011. PMID: 21117033 Review.
Cited by
- Molecular events initiating exit of a copper-transporting ATPase ATP7B from the trans-Golgi network.
Hasan NM, Gupta A, Polishchuk E, Yu CH, Polishchuk R, Dmitriev OY, Lutsenko S. Hasan NM, et al. J Biol Chem. 2012 Oct 19;287(43):36041-50. doi: 10.1074/jbc.M112.370403. Epub 2012 Aug 16. J Biol Chem. 2012. PMID: 22898812 Free PMC article. - Uromodulin is expressed in renal primary cilia and UMOD mutations result in decreased ciliary uromodulin expression.
Zaucke F, Boehnlein JM, Steffens S, Polishchuk RS, Rampoldi L, Fischer A, Pasch A, Boehm CW, Baasner A, Attanasio M, Hoppe B, Hopfer H, Beck BB, Sayer JA, Hildebrandt F, Wolf MT. Zaucke F, et al. Hum Mol Genet. 2010 May 15;19(10):1985-97. doi: 10.1093/hmg/ddq077. Epub 2010 Feb 18. Hum Mol Genet. 2010. PMID: 20172860 Free PMC article. - The Road not Taken: Less Traveled Roads from the TGN to the Plasma Membrane.
Spang A. Spang A. Membranes (Basel). 2015 Mar 10;5(1):84-98. doi: 10.3390/membranes5010084. Membranes (Basel). 2015. PMID: 25764365 Free PMC article. Review. - The intracellular transport and secretion of calumenin-1/2 in living cells.
Wang Q, Feng H, Zheng P, Shen B, Chen L, Liu L, Liu X, Hao Q, Wang S, Chen J, Teng J. Wang Q, et al. PLoS One. 2012;7(4):e35344. doi: 10.1371/journal.pone.0035344. Epub 2012 Apr 13. PLoS One. 2012. PMID: 22514732 Free PMC article. - Quantitative analysis of ribbons, vesicles, and cisterns at the cat inner hair cell synapse: correlations with spontaneous rate.
Kantardzhieva A, Liberman MC, Sewell WF. Kantardzhieva A, et al. J Comp Neurol. 2013 Oct 1;521(14):3260-71. doi: 10.1002/cne.23345. J Comp Neurol. 2013. PMID: 23787810 Free PMC article.
References
- Acharya, U., Jacobs, R., Peters, J.M., Watson, N., Farquhar, M.G., and Malhotra, V. (1995). The formation of Golgi stacks from vesiculated Golgi membranes requires two distinct fusion events. Cell 82, 895-904. - PubMed
- Band, A.M., Maatta, J., Kaariainen, L., and Kuismanen, E. (2001). Inhibition of the membrane fusion machinery prevents exit from the TGN and proteolytic processing by furin. FEBS Lett. 505, 118-124. - PubMed
- Banting, G., and Ponnambalam, S. (1997). TGN38 and its orthologues: roles in post-TGN vesicle formation and maintenance of TGN morphology. Biochim. Biophys. Acta 1355, 209-217. - PubMed
- Brown, W.J., Chambers, K., and Doody, A. (2003). Phospholipase A2 (PLA2) enzymes in membrane trafficking: mediators of membrane shape and function. Traffic 4, 214-221. - PubMed
Publication types
MeSH terms
Substances
LinkOut - more resources
Full Text Sources
Research Materials
Miscellaneous
