Microbial communities associated with geological horizons in coastal subseafloor sediments from the sea of okhotsk - PubMed (original) (raw)
Microbial communities associated with geological horizons in coastal subseafloor sediments from the sea of okhotsk
Fumio Inagaki et al. Appl Environ Microbiol. 2003 Dec.
Abstract
Microbial communities from a subseafloor sediment core from the southwestern Sea of Okhotsk were evaluated by performing both cultivation-dependent and cultivation-independent (molecular) analyses. The core, which extended 58.1 m below the seafloor, was composed of pelagic clays with several volcanic ash layers containing fine pumice grains. Direct cell counting and quantitative PCR analysis of archaeal and bacterial 16S rRNA gene fragments indicated that the bacterial populations in the ash layers were approximately 2 to 10 times larger than those in the clays. Partial sequences of 1,210 rRNA gene clones revealed that there were qualitative differences in the microbial communities from the two different types of layers. Two phylogenetically distinct archaeal assemblages in the Crenarchaeota, the miscellaneous crenarchaeotic group and the deep-sea archaeal group, were the most predominant archaeal 16S rRNA gene components in the ash layers and the pelagic clays, respectively. Clones of 16S rRNA gene sequences from members of the gamma subclass of the class Proteobacteria dominated the ash layers, whereas sequences from members of the candidate division OP9 and the green nonsulfur bacteria dominated the pelagic clay environments. Molecular (16S rRNA gene sequence) analysis of 181 isolated colonies revealed that there was regional proliferation of viable heterotrophic mesophiles in the volcanic ash layers, along with some gram-positive bacteria and actinobacteria. The porous ash layers, which ranged in age from tens of thousands of years to hundreds of thousands of years, thus appear to be discrete microbial habitats within the coastal subseafloor clay sediment, which are capable of harboring microbial communities that are very distinct from the communities in the more abundant pelagic clays.
Figures
FIG. 1.
Profiles of total cell density (A) and 16S rRNA gene concentration (B) in the MD01-2412 core sediments. (A) Total cell densities in pelagic clay samples (○) and ash layer samples (•) were estimated by direct counting of AO-stained cells. (B) Archaeal (□) and bacterial (▪) concentrations of the 16S rRNA gene were determined by quantitative PCR by using domain-specific fluorogenic probes. mbsf, meters below the seafloor; rDNA, ribosomal DNA.
FIG. 2.
Profiles of archaeal and bacterial communities in 16S rRNA gene clone libraries constructed for various depths of pelagic clay and volcanic ash layers. The numbers of clones examined are indicated in parentheses. The percentages of the cloned sequences affiliated with the phylogenetic groups are indicated by the bar graphs. Sec., section; mbsf, meters below the seafloor.
FIG. 3.
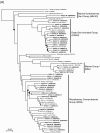
Phylogenetic relationships of archaeal 16S rRNA gene sequences of representative clones from the Okhotsk core sediments and of related pure cultures and environmental clones in the kingdoms Crenarchaeota (A) and Euryarchaeota (B). The trees were inferred by neighbor-joining analysis by using restricted homologous positions of 16S rRNA gene sequences. The solid circles at nodes indicate positions where the confidence value for 100 bootstrap trial results is less than 40%. The sequences of representative clones determined in this study are indicated by boldface type. The numbers in parentheses are accession numbers of sequences. Scale bar = 0.02 nucleotide substitution per sequence position.
FIG. 4.
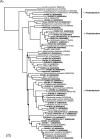
Phylogenetic relationships of bacterial 16S rRNA gene sequences of representative clones from the Okhotsk core sediments and related pure cultures and environmental clones belonging to the class Proteobacteria (A) and to the Dehalococcoides group of the green nonsulfur bacteria and the candidate OP9 division (B). The NT-B3 and NT-B4 clusters in panel B correspond to the clusters described by Reed et al. (25). The trees were inferred by neighbor-joining analysis by using restricted homologous positions of 16S rRNA gene sequences. The solid circles at nodes indicate positions where the confidence value for 100 bootstrap trial results is less than 40%. 16S rRNA gene sequences of representative clones and isolates determined in this study are indicated by boldface type. The numbers in parentheses are accession numbers of sequences. Scale bar = 0.02 nucleotide substitution per sequence position.
FIG. 5.
CFU assay of MD01-2412 subseafloor sediments. Three kinds of solid plates were incubated at 5, 15, 25, 35, and 45°C for 2 weeks. No colonies were observed after incubation at 45°C. Sec., section; PC, pelagic clay.
FIG. 6.
Summary pie charts of archaeal and bacterial phylotype compositions for 16S rRNA gene clone libraries constructed from pelagic clay and volcanic ash layers in the MD01-2412 Okhotsk core sediments. MHVG, marine hydrothermal vent group; MG1, marine group 1; MBG-D, marine benthic group D; SAGMEG, South American gold mine euryarchaeotic group; α, alpha subclass of the class Proteobacteria; γ, gamma subclass of the class Proteobacteria; δ, delta subclass of the class Proteobacteria.
Similar articles
- Microbial communities from methane hydrate-bearing deep marine sediments in a forearc basin.
Reed DW, Fujita Y, Delwiche ME, Blackwelder DB, Sheridan PP, Uchida T, Colwell FS. Reed DW, et al. Appl Environ Microbiol. 2002 Aug;68(8):3759-70. doi: 10.1128/AEM.68.8.3759-3770.2002. Appl Environ Microbiol. 2002. PMID: 12147470 Free PMC article. - Archaeal and bacterial communities respond differently to environmental gradients in anoxic sediments of a California hypersaline lake, the Salton Sea.
Swan BK, Ehrhardt CJ, Reifel KM, Moreno LI, Valentine DL. Swan BK, et al. Appl Environ Microbiol. 2010 Feb;76(3):757-68. doi: 10.1128/AEM.02409-09. Epub 2009 Nov 30. Appl Environ Microbiol. 2010. PMID: 19948847 Free PMC article. - Microbial diversity in ultra-high-pressure rocks and fluids from the Chinese Continental Scientific Drilling Project in China.
Zhang G, Dong H, Xu Z, Zhao D, Zhang C. Zhang G, et al. Appl Environ Microbiol. 2005 Jun;71(6):3213-27. doi: 10.1128/AEM.71.6.3213-3227.2005. Appl Environ Microbiol. 2005. PMID: 15933024 Free PMC article. - Microbial community stratification controlled by the subseafloor fluid flow and geothermal gradient at the Iheya North hydrothermal field in the Mid-Okinawa Trough (Integrated Ocean Drilling Program Expedition 331).
Yanagawa K, Breuker A, Schippers A, Nishizawa M, Ijiri A, Hirai M, Takaki Y, Sunamura M, Urabe T, Nunoura T, Takai K. Yanagawa K, et al. Appl Environ Microbiol. 2014 Oct;80(19):6126-35. doi: 10.1128/AEM.01741-14. Epub 2014 Jul 25. Appl Environ Microbiol. 2014. PMID: 25063666 Free PMC article. - Prokaryotic community composition and biogeochemical processes in deep subseafloor sediments from the Peru Margin.
Webster G, Parkes RJ, Cragg BA, Newberry CJ, Weightman AJ, Fry JC. Webster G, et al. FEMS Microbiol Ecol. 2006 Oct;58(1):65-85. doi: 10.1111/j.1574-6941.2006.00147.x. FEMS Microbiol Ecol. 2006. PMID: 16958909
Cited by
- Richness and diversity of bacteria in the Nansha carbonate platform (Core MD05-2896), South China Sea.
Li T, Wang P. Li T, et al. World J Microbiol Biotechnol. 2013 Oct;29(10):1895-905. doi: 10.1007/s11274-013-1354-9. Epub 2013 May 23. World J Microbiol Biotechnol. 2013. PMID: 23700125 - Heterotrophic Archaea dominate sedimentary subsurface ecosystems off Peru.
Biddle JF, Lipp JS, Lever MA, Lloyd KG, Sørensen KB, Anderson R, Fredricks HF, Elvert M, Kelly TJ, Schrag DP, Sogin ML, Brenchley JE, Teske A, House CH, Hinrichs KU. Biddle JF, et al. Proc Natl Acad Sci U S A. 2006 Mar 7;103(10):3846-51. doi: 10.1073/pnas.0600035103. Epub 2006 Feb 27. Proc Natl Acad Sci U S A. 2006. PMID: 16505362 Free PMC article. - A combined lipidomic and 16S rRNA gene amplicon sequencing approach reveals archaeal sources of intact polar lipids in the stratified Black Sea water column.
Sollai M, Villanueva L, Hopmans EC, Reichart GJ, Sinninghe Damsté JS. Sollai M, et al. Geobiology. 2019 Jan;17(1):91-109. doi: 10.1111/gbi.12316. Epub 2018 Oct 3. Geobiology. 2019. PMID: 30281902 Free PMC article. - Microbial ecology of the dark ocean above, at, and below the seafloor.
Orcutt BN, Sylvan JB, Knab NJ, Edwards KJ. Orcutt BN, et al. Microbiol Mol Biol Rev. 2011 Jun;75(2):361-422. doi: 10.1128/MMBR.00039-10. Microbiol Mol Biol Rev. 2011. PMID: 21646433 Free PMC article. Review. - Expanding the World of Marine Bacterial and Archaeal Clades.
Yilmaz P, Yarza P, Rapp JZ, Glöckner FO. Yilmaz P, et al. Front Microbiol. 2016 Jan 8;6:1524. doi: 10.3389/fmicb.2015.01524. eCollection 2015. Front Microbiol. 2016. PMID: 26779174 Free PMC article.
References
- Bidle, K. A., M. Kastner, and D. H. Bartlett. 1999. A phylogenetic analysis of microbial communities associated with methane hydrate containing marine fluids and sediments in the Cascadia margin (ODP site 892B). FEMS Microbiol. Lett. 177:101-108. - PubMed
MeSH terms
Substances
LinkOut - more resources
Full Text Sources
Molecular Biology Databases
Research Materials
Miscellaneous


