Adipose-specific peroxisome proliferator-activated receptor gamma knockout causes insulin resistance in fat and liver but not in muscle - PubMed (original) (raw)
Adipose-specific peroxisome proliferator-activated receptor gamma knockout causes insulin resistance in fat and liver but not in muscle
Weimin He et al. Proc Natl Acad Sci U S A. 2003.
Abstract
Syndrome X, typified by obesity, insulin resistance (IR), dyslipidemia, and other metabolic abnormalities, is responsive to antidiabetic thiazolidinediones (TZDs). Peroxisome proliferator-activated receptor (PPAR) gamma, a target of TZDs, is expressed abundantly in adipocytes, suggesting an important role for this tissue in the etiology and treatment of IR. Targeted deletion of PPARgamma in adipose tissue resulted in marked adipocyte hypocellularity and hypertrophy, elevated levels of plasma free fatty acids and triglyceride, and decreased levels of plasma leptin and ACRP30. In addition, increased hepatic glucogenesis and IR were observed. Despite these defects, blood glucose, glucose and insulin tolerance, and insulin-stimulated muscle glucose uptake were all comparable to those of control mice. However, targeted mice were significantly more susceptible to high-fat diet-induced steatosis, hyperinsulinemia, and IR. Surprisingly, TZD treatment effectively reversed liver IR, whereas it failed to lower plasma free fatty acids. These results suggest that syndrome X may be comprised of separable PPARgamma-dependent components whose origins and therapeutic sites may reside in distinct tissues.
Figures
Fig. 1.
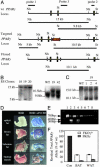
PPARγ targeting strategy and aP2-Cre transgene activity. (A) Shown (top to bottom) are the wt, targeted, and floxed _ppar_γ gene loci. Probes 1–3 were used to identify recombinants. Sizes and positions of detectable restricted fragments are shown. (B) Southern analysis of targeted ES cells. (Left) Hybridization with 5′ probes. (Right) Hybridization with 3′ probes (C) Southern blot with probe 3 of ES cells transiently transfected with a Cre plasmid. (D) 5-Bromo-4-chloro-3-indolyl β-
d
-galactoside staining of BAT, WAT, skin, and skeletal muscle from ROSA26 Con and ROSA/aP2-Cre mice. (E) Detection of wt and mutant PPARγ1 mRNA by RT-PCR. Lane 1, wt BAT; lane 2, FKO BAT; lane 3, wt WAT; lane 4, FKO WAT; lanes 5–8, FKO macrophages, heart, skeletal muscle, and liver, respectively. Arrows indicate the wt (700-bp) and mutant (300- and 400-bp) PCR products. (F) Southern blot of DNA from BAT and WAT of FKOγfl/+ and FKOγf/f. Recombination efficiencies are depicted as residual total PPARγ allele relative to wt.
Fig. 2.
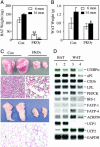
Deletion of PPARγ in fat leads to progressive lipodystrophy. BAT (A) and WAT (B) weight changes in 6- and 14-month-old Con and FKOγ mice. Values are the mean ± SEM (n = 10). (C) Gross morphology and histology of BAT (top two panels) and WAT (bottom two panels) from 6-month-old Con and FKOγ mice. (D) Northern blot analysis of adipocyte genes in BAT and WAT in Con (lanes 1 and 3) and FKOγ (lanes 2 and 4) mice. Total RNA from each group (n = 5) was pooled, and 10 μg of RNA per group was analyzed.
Fig. 3.
FKOγ mice show relatively normal insulin sensitivity. (A) Blood FFA levels in basal state and during clamp. Values from each group are the mean ± SEM (n = 8). *, P < 0.05, basal vs. clamp; ##, P < 0.01, FKOγ vs. Con. Glucose tolerance (B) and insulin tolerance (C) tests in Con and FKOγ mice. Values are the mean ± SEM (n = 10). (D) Insulin-stimulated muscle glucose uptake during clamp. Values are the mean ± SEM (n = 8).
Fig. 4.
Fatty liver and hepatic IR. (A) Liver weights from 6- and 14-month-old Con and FKOγ mice. #, P < 0.05. (B) Histology (Upper) and oil red O staining (Lower) of livers from 6-month-old Con and FKOγ mice. (C) HGP in basal state and during clamp study. *, P < 0.05, basal vs. clamp; #, P < 0.05, FKOγ vs. Con during clamp.
Fig. 5.
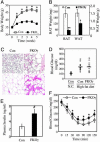
HFD leads to expedited lipodystrophy and severe IR in FKOγ mice. (A and B) Body weight gain and fat pad mass change of HFD-fed Con and FKOγ mice. Values are the mean ± SEM (n = 10). *, P < 0.05. (C) Histology of BAT (Upper) and WAT (Lower) from Con and FKOγ mice. Fasting blood glucose (D) and insulin (E) levels in HFD-fed animals are shown. HFD causes similar elevation of fasting blood glucose levels but higher levels of insulin in FKOγ mice. Values are the mean ± SEM (n = 10). *, P < 0.05, FKOγ vs. Con. (F) Insulin tolerance test after HFD feeding. Values are the mean ± SEM (n = 10). *, P < 0.05, FKOγ vs. Con.
Fig. 6.
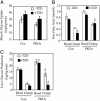
TZD treatment sensitizes insulin action in muscle and liver but not in fat. (A) Insulin-stimulated muscle glucose disposal rate in TZD-treated and untreated FKOγ and Con mice (n = 8). (B) Antilipolytic activity of insulin in TZD-treated and nontreated Con and FKOγ mice (n = 8). *, P < 0.01, treated vs. untreated Con during clamp. #, P < 0.01, treated FKOγ vs. treated Con during clamp. (C) HGP in TZD-treated and nontreated Con and FKOγ mice (n = 8) in basal state and during clamp study. #, P < 0.01, untreated FKOγ vs. untreated Con during clamp. *, P < 0.01, treated and untreated FKOγ during clamp.
References
- Spiegelman, B. M. (1998) Diabetes 47, 507–514. - PubMed
- Barroso, I., Gurnell, M., Crowley, V. E., Agostini, M., Schwabe, J. W., Soos, M. A., Maslen, G. L., Williams, T. D., Lewis, H., Schafer, A. J., et al. (1999) Nature 402, 880–883. - PubMed
- Lehmann, J. M., Moore, L. B., Smith-Oliver, T. A., Wilkison, W. O., Willson, T. M. & Kliewer, S. A. (1995) J. Biol. Chem. 270, 12953–12956. - PubMed
- Tontonoz, P., Hu, E. & Spiegelman, B. M. (1994) Cell 79, 1147–1156. - PubMed
Publication types
MeSH terms
Substances
Grants and funding
- T32 DK007044/DK/NIDDK NIH HHS/United States
- R01 DK033651/DK/NIDDK NIH HHS/United States
- K01 DK060484/DK/NIDDK NIH HHS/United States
- HL56989/HL/NHLBI NIH HHS/United States
- 2T32 DK07044-23/DK/NIDDK NIH HHS/United States
- P50 HL056989/HL/NHLBI NIH HHS/United States
- DK-60484/DK/NIDDK NIH HHS/United States
- R37 DK057978/DK/NIDDK NIH HHS/United States
- DK-33651/DK/NIDDK NIH HHS/United States
- DK57978-27/DK/NIDDK NIH HHS/United States
- DK07494/DK/NIDDK NIH HHS/United States
- R37 DK033651/DK/NIDDK NIH HHS/United States
LinkOut - more resources
Full Text Sources
Other Literature Sources
Molecular Biology Databases
Miscellaneous


