p50alpha/p55alpha phosphoinositide 3-kinase knockout mice exhibit enhanced insulin sensitivity - PubMed (original) (raw)
p50alpha/p55alpha phosphoinositide 3-kinase knockout mice exhibit enhanced insulin sensitivity
Dong Chen et al. Mol Cell Biol. 2004 Jan.
Abstract
Class Ia phosphoinositide (PI) 3-kinases are heterodimers composed of a regulatory and a catalytic subunit and are essential for the metabolic actions of insulin. In addition to p85alpha and p85beta, insulin-sensitive tissues such as fat, muscle, and liver express the splice variants of the pik3r1 gene, p50alpha and p55alpha. To define the role of these variants, we have created mice with a deletion of p50alpha and p55alpha by using homologous recombination. These mice are viable, grow normally, and maintain normal blood glucose levels but have lower fasting insulin levels. Results of an insulin tolerance test indicate that p50alpha/p55alpha knockout mice have enhanced insulin sensitivity in vivo, and there is an increase in insulin-stimulated glucose transport in isolated extensor digitorum longus muscle tissues and adipocytes. In muscle, loss of p50alpha/p55alpha results in reduced levels of insulin-stimulated insulin receptor substrate 1 (IRS-1) and phosphotyrosine-associated PI 3-kinase but enhanced levels of IRS-2-associated PI 3-kinase and Akt activation, whereas in adipocytes levels of both insulin-stimulated PI 3-kinase and Akt are unchanged. Despite this, adipocytes of the knockout mice are smaller and have increased glucose uptake with altered glucose metabolic pathways. When treated with gold thioglucose, p50alpha/p55alpha knockout mice become hyperphagic like their wild-type littermates. However, they accumulate less fat and become mildly less hyperglycemic and markedly less hyperinsulinemic. Taken together, these data indicate that p50alpha and p55alpha play an important role in insulin signaling and action, especially in lipid and glucose metabolism.
Figures
FIG. 1.
Gene targeting of the p50α/p55α locus. (A) Protein structures of the class Ia PI 3-kinase regulatory subunits. SH, Src homology; P, proline-rich region; BH, BCR homology. (B) Genomic structure of the mouse pik3r1 gene (top), targeting vector (middle), and targeted locus after homologous recombination (bottom). P, _Pst_I; E, Eco N1; Neo, neomycin cassette; TK, thymidine kinase. P1, P2, and P3 are primers for genotyping. (C) PCR genotyping of tail DNA identifying wild-type (+/+), p50α/p55α+/−, and p50α/p55α−/− mice.
FIG. 2.
Tissue expression of p50α and p55α in wild-type mice and evidence of deletion in p50α/p55α knockout mice. Isolated adipocytes (A), livers (B), muscle extracts (C), and a combination of equal amounts of these tissues (D) prepared from wild-type (W) and knockout (K) mice were subjected to Western immunoblotting (IB) with anti-p85α pan antisera (Upstate Biotechnology, Inc.) raised against the common N-SH2 domain of p85α, p55α, and p50α.
FIG. 3.
Increased in vivo insulin sensitivity in p50α/p55α knockout mice. (A) Glucose and insulin concentrations in randomly fed and fasting mice. Blood glucose (left panels) and insulin (right panels) concentrations were determined by tail bleeding in 5-month-old mice. Experimental groups consisted of 10 animals each. Values depict means ± standard errors of the means (SEM) (*, P < 0.05). WT, wild-type mice; KO, knockout mice. (B) Results of insulin tolerance tests (ITT) (left panel) and glucose tolerance tests (GTT) (right panel) for wild-type (WT) and p50α/p55α knockout (p50α/p55α KO) mice. Insulin and glucose tolerance tests were performed on 6-month-old mice with 0.75 U of insulin/kg of body weight and 2 g of glucose/kg of body weight, respectively. Each experimental group consisted of 10 animals. Values represent means ± SEM (**, P < 0.01).
FIG. 4.
Glucose transport in EDL muscles and isolated adipocytes. EDL muscle strips (A) and adipocytes (B) were isolated from wild-type (WT) and p50α/p55α−/− (KO) mice, and glucose transport activities were determined without (basal) or with insulin at the indicated concentrations. Four to six independent observations were made under each condition. Results shown are means ± SEM (**, P < 0.01).
FIG. 5.
Breakdown of glucose metabolism into different pathways by using isolated adipocytes. Metabolism of glucose into lactate (A), triglyceride (TG) (B), and CO2 (C) was measured in isolated adipocytes from 4-month-old wild-type (WT) and p50α/p55α−/− (KO) mice without (basal) or with 80 nM insulin. Four independent observations were made under each condition. Results shown are means ± SEM (**, P < 0.01).
FIG. 6.
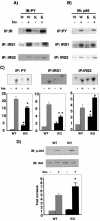
Insulin signaling in muscles of wild-type (W) and p50α/p55α knockout (K) mice. Mice were injected with saline (−) or 5 U of insulin (+) via inferior venae cavae as described in Materials and Methods. (A) Muscle extracts were prepared and immunoprecipitated (IP) with anti-insulin receptor (IR; Santa Cruz), anti-IRS-1 (Santa Cruz), or anti-IRS-2 (Upstate Biotechnology) antibody. The immunoprecipitates were subjected to anti-PY (Transduction Laboratory) Western immunoblotting (IB). Ins, insulin. (B) Muscle extracts were immunoprecipitated with anti-PY (Santa Cruz), anti-IRS-1, or anti-IRS-2 antibody. The immunoprecipitates were subjected to anti-p85α pan (Upstate Biotechnology) Western immunoblotting. (C) Aliquots of the immunoprecipitates described in the legend to panel B were subjected to a PI 3-kinase assay. WT, wild-type mice; KO, knockout mice. (D) Muscle extracts were subjected to anti-phospho-Akt (Ser473) and anti-Akt (Cell Signaling Technology, Inc.) Western immunoblotting and an Akt in vitro kinase assay. The graphs in panels C and D depict the average activities in three to four animals of each genotype and condition. Results shown are means ± SEM (*, P < 0.05).
FIG. 7.
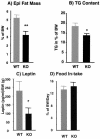
Epididymal (Epi) fat pad masses (n, 9 wild-type [WT] and 10 knockout [KO] mice) (A), total body triglyceride (TG) contents (n, 10 in each group) (B), serum leptin levels in fasting mice (n, 10 in each group) (C), and daily food intake (n, 10 wild-type and 6 knockout mice) (D) in 5-month-old wild-type and p50α/p55α knockout mice. All the measurements were normalized to body weights (BW) of individual mice, and the values are expressed as means ± SEM (*, P < 0.05; **, P < 0.01).
FIG. 8.
Lipid contents (n, nine in each group) (A), cell numbers (n, nine wild-type and eight knockout mice) (B), and hematoxylin and eosin (H&E) staining (C) of isolated adipocytes from 5-month-old wild-type (WT) and p50α/p55α knockout (KO) mice. Values in panels A and B are expressed as means ± SEM (**, P < 0.01). In panel C, each field is a representative hematoxylin-and-eosin-stained image from a separate animal of the indicated genotype.
FIG. 9.
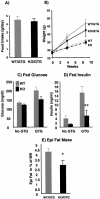
Effects of GTG on wild-type (WT) and p50α/p55α knockout (KO) mice. (A) Two-month-old wild-type (n = 9) and knockout (n = 9) mice were injected with 0.5 mg of GTG/g of body weight. Daily food intakes of GTG-treated wild-type and knockout mice were measured 6 weeks after injection. (B) Body weights of GTG-injected (n, nine in each group) and saline-injected control (n, six wild-type and nine knockout) mice were monitored for up to 9 weeks postinjection. (C and D) Glucose and insulin concentrations of fed mice were determined with GTG-injected mice and saline-injected control mice 8 weeks after GTG injection (**, P < 0.01). (E) Epididymal (Epi) fat pad masses normalized to body weights (BW) of the GTG-treated wild-type and knockout mice were determined 10 weeks after injection (*, P < 0.05). All values are expressed as means ± SEM.
Similar articles
- Divergent roles of the regulatory subunits of class IA PI3K.
Kim CW, Lee JM, Park SW. Kim CW, et al. Front Endocrinol (Lausanne). 2024 Jan 22;14:1152579. doi: 10.3389/fendo.2023.1152579. eCollection 2023. Front Endocrinol (Lausanne). 2024. PMID: 38317714 Free PMC article. Review. - Calorie Restriction-Induced Increase in Skeletal Muscle Insulin Sensitivity Is Not Prevented by Overexpression of the p55α Subunit of Phosphoinositide 3-Kinase.
Martins VF, Tahvilian S, Kang JH, Svensson K, Hetrick B, Chick WS, Schenk S, McCurdy CE. Martins VF, et al. Front Physiol. 2018 Jun 27;9:789. doi: 10.3389/fphys.2018.00789. eCollection 2018. Front Physiol. 2018. PMID: 29997524 Free PMC article. - p85alpha gene generates three isoforms of regulatory subunit for phosphatidylinositol 3-kinase (PI 3-Kinase), p50alpha, p55alpha, and p85alpha, with different PI 3-kinase activity elevating responses to insulin.
Inukai K, Funaki M, Ogihara T, Katagiri H, Kanda A, Anai M, Fukushima Y, Hosaka T, Suzuki M, Shin BC, Takata K, Yazaki Y, Kikuchi M, Oka Y, Asano T. Inukai K, et al. J Biol Chem. 1997 Mar 21;272(12):7873-82. doi: 10.1074/jbc.272.12.7873. J Biol Chem. 1997. PMID: 9065454 - Positive and negative regulation of phosphoinositide 3-kinase-dependent signaling pathways by three different gene products of the p85alpha regulatory subunit.
Ueki K, Algenstaedt P, Mauvais-Jarvis F, Kahn CR. Ueki K, et al. Mol Cell Biol. 2000 Nov;20(21):8035-46. doi: 10.1128/MCB.20.21.8035-8046.2000. Mol Cell Biol. 2000. PMID: 11027274 Free PMC article. - The regulation of class IA PI 3-kinases by inter-subunit interactions.
Backer JM. Backer JM. Curr Top Microbiol Immunol. 2010;346:87-114. doi: 10.1007/82_2010_52. Curr Top Microbiol Immunol. 2010. PMID: 20544340 Free PMC article. Review.
Cited by
- Upregulation of MMPs in placentas of patients with gestational diabetes mellitus: Involvement of the PI3K/Akt pathway.
Zhang Y, Liu Y, Shi Y, Bai C, Wang T, Ruan F, Hu C. Zhang Y, et al. Heliyon. 2024 Jun 7;10(12):e32518. doi: 10.1016/j.heliyon.2024.e32518. eCollection 2024 Jun 30. Heliyon. 2024. PMID: 39021921 Free PMC article. - Muscle fiber type-dependence effect of exercise on genomic networks in aged mice models.
Lee SM, Lee MC, Bae WR, Yoon KJ, Moon HY. Lee SM, et al. Aging (Albany NY). 2022 Apr 19;14(8):3337-3364. doi: 10.18632/aging.204024. Epub 2022 Apr 19. Aging (Albany NY). 2022. PMID: 35440516 Free PMC article. - Paradoxical dominant negative activity of an immunodeficiency-associated activating PIK3R1 variant.
Tomlinson PR, Knox R, Perisic O, Su HC, Brierley GV, Williams RL, Semple RK. Tomlinson PR, et al. bioRxiv [Preprint]. 2024 Nov 5:2023.11.02.565250. doi: 10.1101/2023.11.02.565250. bioRxiv. 2024. PMID: 38077044 Free PMC article. Updated. Preprint. - Organ-specific lymphangiectasia, arrested lymphatic sprouting, and maturation defects resulting from gene-targeting of the PI3K regulatory isoforms p85alpha, p55alpha, and p50alpha.
Mouta-Bellum C, Kirov A, Miceli-Libby L, Mancini ML, Petrova TV, Liaw L, Prudovsky I, Thorpe PE, Miura N, Cantley LC, Alitalo K, Fruman DA, Vary CP. Mouta-Bellum C, et al. Dev Dyn. 2009 Oct;238(10):2670-9. doi: 10.1002/dvdy.22078. Dev Dyn. 2009. PMID: 19705443 Free PMC article. - Class IA phosphoinositide 3-kinases are obligate p85-p110 heterodimers.
Geering B, Cutillas PR, Nock G, Gharbi SI, Vanhaesebroeck B. Geering B, et al. Proc Natl Acad Sci U S A. 2007 May 8;104(19):7809-14. doi: 10.1073/pnas.0700373104. Epub 2007 Apr 30. Proc Natl Acad Sci U S A. 2007. PMID: 17470792 Free PMC article.
References
- Bergen, H. T., N. Monkman, and C. V. Mobbs. 1996. Injection with gold thioglucose impairs sensitivity to glucose: evidence that glucose-responsive neurons are important for long-term regulation of body weight. Brain Res. 734:332-336. - PubMed
- Bruning, J. C., M. D. Michael, J. N. Winnay, T. Hayashi, D. Horsch, D. Accili, L. J. Goodyear, and C. R. Kahn. 1998. A muscle-specific insulin receptor knockout exhibits features of the metabolic syndrome of NIDDM without altering glucose tolerance. Mol. Cell 2:559-569. - PubMed
- Cushman, S. W., and L. B. Salans. 1978. Determinations of adipose cell size and number in suspensions of isolated rat and human adipose cells. J. Lipid Res. 19:269-273. - PubMed
Publication types
MeSH terms
Substances
LinkOut - more resources
Full Text Sources
Other Literature Sources
Medical
Molecular Biology Databases
Research Materials
Miscellaneous


