An integrated gene annotation and transcriptional profiling approach towards the full gene content of the Drosophila genome - PubMed (original) (raw)
doi: 10.1186/gb-2003-5-1-r3. Epub 2003 Dec 22.
B Beckmann, S A Haas, B Koch, V Solovyev, C Busold, K Fellenberg, M Boutros, M Vingron, F Sauer, J D Hoheisel, R Paro
Affiliations
- PMID: 14709175
- PMCID: PMC395735
- DOI: 10.1186/gb-2003-5-1-r3
An integrated gene annotation and transcriptional profiling approach towards the full gene content of the Drosophila genome
M Hild et al. Genome Biol. 2003.
Abstract
Background: While the genome sequences for a variety of organisms are now available, the precise number of the genes encoded is still a matter of debate. For the human genome several stringent annotation approaches have resulted in the same number of potential genes, but a careful comparison revealed only limited overlap. This indicates that only the combination of different computational prediction methods and experimental evaluation of such in silico data will provide more complete genome annotations. In order to get a more complete gene content of the Drosophila melanogaster genome, we based our new D. melanogaster whole-transcriptome microarray, the Heidelberg FlyArray, on the combination of the Berkeley Drosophila Genome Project (BDGP) annotation and a novel ab initio gene prediction of lower stringency using the Fgenesh software.
Results: Here we provide evidence for the transcription of approximately 2,600 additional genes predicted by Fgenesh. Validation of the developmental profiling data by RT-PCR and in situ hybridization indicates a lower limit of 2,000 novel annotations, thus substantially raising the number of genes that make a fly.
Conclusions: The successful design and application of this novel Drosophila microarray on the basis of our integrated in silico/wet biology approach confirms our expectation that in silico approaches alone will always tend to be incomplete. The identification of at least 2,000 novel genes highlights the importance of gathering experimental evidence to discover all genes within a genome. Moreover, as such an approach is independent of homology criteria, it will allow the discovery of novel genes unrelated to known protein families or those that have not been strictly conserved between species.
Figures
Figure 1
The Heidelberg Collection R1. The combination of the BDGP cDNA Collection (BDGC) R1 with the BDGP genome annotation Release 2 contained 13,861 genes. The Heidelberg Prediction based on the Fgenesh ab initio gene prediction software contains 20,622 predictions. Assuming that genes that overlap by more than 30% of their exon sequence represent the same gene, we combined these two annotation sets. In addition we included 71 genes from different databases that were not present in either annotation. The resulting Heidelberg Collection consists of 21,396 potential genes and is the basis for the Heidelberg FlyArray.
Figure 2
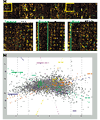
Developmental profiling. (a) Two-color hybridization (green: adult stage; red: 4-8 h old embryo) on the Heidelberg FlyArray directly showing the expression of genes unique to the Heidelberg Prediction (see lower part, spots within the green rectangle). (b) Correspondence cluster analysis of the developmental profiling. Samples from nine different stages of the Drosophila life-cycle were hybridized to the Heidelberg FlyArray. Each experiment was performed at least in triplicate, including a dye reversal to avoid bias. In the resulting plot, each hybridization of an individual developmental stage is depicted as a colored square for each replicate present on the slide. They all form distinct clusters (except for the larval stage), indicating the degree of reproducibility and specificity between them. As a consequence of the normalization process, only the median of all control hybridizations (0-4 h) is shown in the diagram as a single red square. Genes are shown as grey dots if they exhibited significant differential transcription levels. The distance between dots is low when their expression profiles show similar shape, independent of their absolute values. Colored guiding lines are displayed that correspond to the transcription profiles of virtual genes that would exhibit a signal in one condition only.
Figure 3
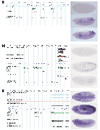
Genomic location and expression patterns of Heidelberg unique predictions. The left part of the figure visualizes the genomic region (10 kb of sequence) for some examples of the novel Heidelberg Predictions. In addition, here is the corresponding amplicon present on the microarray as well as information on conserved regions (D. pseudoobscura in gray, A. gambiae in pink) and ESTs (orange). (a) HDC09253 and (b) HDC04256 lie within regions missing any BDGP/FlyBase prediction. HDC02494 is predicted within known FlyBase predictions but is located on the opposite strand (c). On the right, the in situ pictures show the expression patterns at three different time points of development, 0-4 h (top), 4-8 h (middle) and 8-12 h (bottom), respectively. Embryos are shown in (a, b) lateral view, (c) top: ventral view, middle and bottom: lateral view; anterior is always to the left.
Figure 4
In situ hybridization for HDC13470. (a-f) In situ hybridization of various stages of embryonic development using HDC13470 as probe. (g) The microarray-based expression profile (all stages compared to 0-4 h) is nicely reproduced by (h) the result of the northern analysis. Tub, tubulin. Embryos (a, b, d-f) are shown in lateral view, (c) is a ventral view, with the anterior always to the left.
Figure 5
The Heidelberg FlyArray website. Screen shot of the Heidelberg FlyArray website based on the GBrowse platform. After selecting the genomic region of interest, for example by gene name, amplicon name or position, the user is offered a comparative view of the different gene models from the BDGP genome annotations Release 2, FlyBase Release 3.1 and the Heidelberg Prediction, as well as the placement of the amplicons chosen for the Heidelberg FlyArray. In addition, researchers find a comparison to D. pseudoobscura and A. gambiae along with a novel EST clustering and information on known P-element insertions.
Similar articles
- Genome wide analysis of common and specific stress responses in adult drosophila melanogaster.
Girardot F, Monnier V, Tricoire H. Girardot F, et al. BMC Genomics. 2004 Sep 30;5:74. doi: 10.1186/1471-2164-5-74. BMC Genomics. 2004. PMID: 15458575 Free PMC article. - Prediction of gene expression in embryonic structures of Drosophila melanogaster.
Samsonova AA, Niranjan M, Russell S, Brazma A. Samsonova AA, et al. PLoS Comput Biol. 2007 Jul;3(7):e144. doi: 10.1371/journal.pcbi.0030144. PLoS Comput Biol. 2007. PMID: 17658945 Free PMC article. - Drosophila melanogaster: a case study of a model genomic sequence and its consequences.
Ashburner M, Bergman CM. Ashburner M, et al. Genome Res. 2005 Dec;15(12):1661-7. doi: 10.1101/gr.3726705. Genome Res. 2005. PMID: 16339363 Review. - The Drosophila melanogaster genome sequencing and annotation projects: a status report.
Drysdale R. Drysdale R. Brief Funct Genomic Proteomic. 2003 Jul;2(2):128-34. doi: 10.1093/bfgp/2.2.128. Brief Funct Genomic Proteomic. 2003. PMID: 15239934 Review.
Cited by
- The Release 5.1 annotation of Drosophila melanogaster heterochromatin.
Smith CD, Shu S, Mungall CJ, Karpen GH. Smith CD, et al. Science. 2007 Jun 15;316(5831):1586-91. doi: 10.1126/science.1139815. Science. 2007. PMID: 17569856 Free PMC article. - Genes encoding vitamin-K epoxide reductase are present in Drosophila and trypanosomatid protists.
Robertson HM. Robertson HM. Genetics. 2004 Oct;168(2):1077-80. doi: 10.1534/genetics.104.029744. Genetics. 2004. PMID: 15514077 Free PMC article. - Systematic interpretation of microarray data using experiment annotations.
Fellenberg K, Busold CH, Witt O, Bauer A, Beckmann B, Hauser NC, Frohme M, Winter S, Dippon J, Hoheisel JD. Fellenberg K, et al. BMC Genomics. 2006 Dec 20;7:319. doi: 10.1186/1471-2164-7-319. BMC Genomics. 2006. PMID: 17181856 Free PMC article. - Accelerated sequence divergence of conserved genomic elements in Drosophila melanogaster.
Holloway AK, Begun DJ, Siepel A, Pollard KS. Holloway AK, et al. Genome Res. 2008 Oct;18(10):1592-601. doi: 10.1101/gr.077131.108. Epub 2008 Jun 26. Genome Res. 2008. PMID: 18583644 Free PMC article. - Dominance and the evolutionary accumulation of cis- and trans-effects on gene expression.
Lemos B, Araripe LO, Fontanillas P, Hartl DL. Lemos B, et al. Proc Natl Acad Sci U S A. 2008 Sep 23;105(38):14471-6. doi: 10.1073/pnas.0805160105. Epub 2008 Sep 12. Proc Natl Acad Sci U S A. 2008. PMID: 18791071 Free PMC article.
References
- Hogenesch JB, Ching KA, Batalov S, Su AI, Walker JR, Zhou Y, Kay SA, Schultz PG, Cooke MP. A comparison of the Celera and Ensembl predicted gene sets reveals little overlap in novel genes. Cell. 2001;106:413–415. - PubMed
- Daly MJ. Estimating the human gene count. Cell. 2002;109:283–284. - PubMed
Publication types
MeSH terms
LinkOut - more resources
Full Text Sources
Molecular Biology Databases


