Sensitive and specific detection of K-ras mutations in colon tumors by short oligonucleotide mass analysis - PubMed (original) (raw)
Comparative Study
Sensitive and specific detection of K-ras mutations in colon tumors by short oligonucleotide mass analysis
Matilde E Lleonart et al. Nucleic Acids Res. 2004.
Abstract
Short oligonucleotide mass analysis (SOMA) is a technique by which small sequences of mutated and wild-type DNA, produced by PCR amplification and restriction digestion, are characterized by HPLC-electrospray ionization tandem mass spectrometry. We have adapted the method to specifically detect two common point mutations at codon 12 of the c-K-ras gene. Mutations in DNA from 121 colon tumor samples were identified by SOMA and validated by comparison with sequencing. SOMA correctly identified 26 samples containing the 12GAT mutation and four samples containing the 12AGT mutation. Sequencing did not reveal mutant DNA in three samples out of the 26 samples shown by SOMA to contain the 12GAT mutation. In these three samples, the presence of mutant DNA was confirmed by SOMA analysis after selective PCR amplification in the presence of BstN1 restriction enzyme. Additional mutations in codons 12 and 13 were revealed by sequencing in 24 additional samples, and their presence did not interfere with the correct identification of G to A or G to T mutations in codon 12. These results provide the basis for a sensitive and specific method to detect c-K-ras codon 12-mutated DNA at levels below 10-12% of wild-type DNA.
Figures
Figure 1
Forward (F1 and F2) and reverse (R1) SOMA PCR primers that were used. Primers amplify a 93 bp DNA fragment in the K-ras gene. The inset shows the two wild-type 8mer SOMA oligonucleotides which are produced by restriction digestion of the amplified DNA with the enzyme BpmI. p indicates a 5′-phosphate group. Bold letters indicate the mutation introduced in the primer to amplify the DNA.
Figure 2
(a) Negative electrospray mass spectrum of the wild-type-s oligonucleotide shown in Figure 1. The mass of this peak depends on the number of G, C, A and T bases present in the oligonucleotide. It gives no information about sequence. Under the solvent conditions described herein, the [M-2H]2– ion peak at m/z 1279.6 is the most intense ion, and sodium and other metal-adduct ions (see inset) are kept to a minimum. (b) CID mass spectrum of the [M-2H]2– oligonucleotide ion (m/z 1279.6) shown in Figure 1. Fragment ion peaks in the mass spectrum give oligonucleotide sequence information. (c) The [an–Bn]– series of fragment ions gives sequence information about the 5′ end of the molecule; the wx– series of fragment ions gives sequence information about the 3′ end.
Figure 3
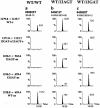
SOMA mass chromatograms illustrating the specific detection of 12AGT and 12GAT variants in the DNA from eight tumor samples shown by sequencing to contain (a) wild-type DNA, (b) wild-type and 12AGT DNA and (c) wild-type and 12GAT DNA. Five CID fragment ions were monitored for each DNA sample.
Figure 4
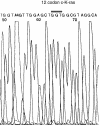
Sequencing chromatogram for DNA sample 953068T shown by SOMA to contain 12% 12GAT-mutated DNA. Primers used for sequencing are shown in Materials and Methods.
Figure 5
SOMA mass chromatograms showing the effect of elimination of wild-type DNA by restriction digestion with BstN1 during PCR amplification. DNA sample 953068T (a) shows small peaks for SOMA oligonucleotides specific for the 12GAT sense (1271.8→650.4) and antisense (1236.3→659.4) mutation. When the wild-type DNA in this sample is cut with BstN1 during PCR amplification (b), these two oligonucleotides increase in intensity relative to wild-type oligonucleotides. For DNA sample 946459N (c), a sample treated under the same conditions but containing no mutated DNA, only wild-type- specific oligonucleotides are observed even after BstN1 treatment (d).
Similar articles
- Rapid and sensitive nonradioactive detection of mutant K-ras genes via 'enriched' PCR amplification.
Kahn SM, Jiang W, Culbertson TA, Weinstein IB, Williams GM, Tomita N, Ronai Z. Kahn SM, et al. Oncogene. 1991 Jun;6(6):1079-83. Oncogene. 1991. PMID: 1676837 - Detection of K-ras point mutation by enriched PCR-colorimetric plate assay.
Santiago FS, Todd AV, Hawkins NJ, Ward RL. Santiago FS, et al. Mol Cell Probes. 1997 Feb;11(1):33-8. doi: 10.1006/mcpr.1996.0073. Mol Cell Probes. 1997. PMID: 9076712 - Mutations of K-ras oncogene and absence of H-ras mutations in squamous cell carcinomas of the lung.
Vachtenheim J, Horáková I, Novotná H, Opáalka P, Roubková H. Vachtenheim J, et al. Clin Cancer Res. 1995 Mar;1(3):359-65. Clin Cancer Res. 1995. PMID: 9815992 - K-ras oncogene activation in adenocarcinoma of the human pancreas. A study of 82 carcinomas using a combination of mutant-enriched polymerase chain reaction analysis and allele-specific oligonucleotide hybridization.
Hruban RH, van Mansfeld AD, Offerhaus GJ, van Weering DH, Allison DC, Goodman SN, Kensler TW, Bose KK, Cameron JL, Bos JL. Hruban RH, et al. Am J Pathol. 1993 Aug;143(2):545-54. Am J Pathol. 1993. PMID: 8342602 Free PMC article. Review.
Cited by
- Sensitive sequencing method for KRAS mutation detection by Pyrosequencing.
Ogino S, Kawasaki T, Brahmandam M, Yan L, Cantor M, Namgyal C, Mino-Kenudson M, Lauwers GY, Loda M, Fuchs CS. Ogino S, et al. J Mol Diagn. 2005 Aug;7(3):413-21. doi: 10.1016/S1525-1578(10)60571-5. J Mol Diagn. 2005. PMID: 16049314 Free PMC article. - High resolution melting analysis for the rapid and sensitive detection of mutations in clinical samples: KRAS codon 12 and 13 mutations in non-small cell lung cancer.
Krypuy M, Newnham GM, Thomas DM, Conron M, Dobrovic A. Krypuy M, et al. BMC Cancer. 2006 Dec 21;6:295. doi: 10.1186/1471-2407-6-295. BMC Cancer. 2006. PMID: 17184525 Free PMC article. - Fast simultaneous detection of K-RAS mutations in colorectal cancer.
Chang YS, Yeh KT, Chang TJ, Chai C, Lu HC, Hsu NC, Chang JG. Chang YS, et al. BMC Cancer. 2009 Jun 11;9:179. doi: 10.1186/1471-2407-9-179. BMC Cancer. 2009. PMID: 19515263 Free PMC article. - KRAS assay selection: sensitivity and accuracy in clinical application.
Herreros-Villanueva M, Aggarwal G. Herreros-Villanueva M, et al. Mol Biol Rep. 2012 Mar;39(3):2467-70. doi: 10.1007/s11033-011-0997-6. Epub 2011 Jun 9. Mol Biol Rep. 2012. PMID: 21656377 - Genetic and epigenetic biomarkers in cancer : improving diagnosis, risk assessment, and disease stratification.
Verma M, Seminara D, Arena FJ, John C, Iwamoto K, Hartmuller V. Verma M, et al. Mol Diagn Ther. 2006;10(1):1-15. doi: 10.1007/BF03256438. Mol Diagn Ther. 2006. PMID: 16646573 Review.
References
- Vogelstein B., Fearon,E.R., Hamilton,S.R., Kern,S.E., Preisinger,A.C., Leppert,M., Nakamura,Y., White,R., Smits,A.M. and Bos,J.L. (1988) Genetic alterations during colorectal-tumor development. N. Engl. J. Med., 319, 525–532. - PubMed
- Bos J.L. (1989) Ras oncogenes in human cancer: a review. Cancer Res., 49, 4682–4689. - PubMed
- Adjei A.A. (2001) Blocking oncogenic Ras signaling for cancer therapy. J. Natl Cancer Inst., 93, 1062–1074. - PubMed
- Slebos R.J., Kibbelaar,R.E., Dalesio,O., Kooistra,A., Stam,J., Meijer,C.J., Wagenaar,S.S., Vanderschueren,R.G., van Zandwijk,N., Mooi,W.J. et al. (1990) K-ras oncogene activation as a prognostic marker in adenocarcinoma of the lung. N. Engl. J. Med., 323, 561–565. - PubMed
- Benhattar J., Losi,L., Chaubert,P., Givel,J.C. and Costa,J. (1993) Prognostic significance of K-ras mutations in colorectal carcinoma. Gastroenterology, 104, 1044–1048. - PubMed
Publication types
MeSH terms
Substances
LinkOut - more resources
Full Text Sources
Other Literature Sources
Miscellaneous


