Distinct migrating and nonmigrating dendritic cell populations are involved in MHC class I-restricted antigen presentation after lung infection with virus - PubMed (original) (raw)
Distinct migrating and nonmigrating dendritic cell populations are involved in MHC class I-restricted antigen presentation after lung infection with virus
Gabrielle T Belz et al. Proc Natl Acad Sci U S A. 2004.
Abstract
During lung infection with virus, airway-derived dendritic cells (DC) have been thought to be the dominant cell type involved in acquisition, transport, and direct antigen presentation for cytotoxic T lymphocyte priming. Contrary to this view, we have found that both an airway-derived CD8alpha(-)CD11b(-) DC subset and distinct CD8alpha(+) lymph node resident DC can present class I-restricted antigens after lung infection with influenza virus or herpes simplex virus 1. Presentation by a nonairway-derived DC population argues that cytotoxic T lymphocyte priming may involve interplay between different DC subsets, not all of which originate within the site of infection.
Figures
Fig. 1.
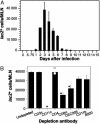
Kinetic analysis of antigen presentation in mediastinal LNs during primary HKx31 influenza infection. (A) Mediastinal LNs from influenza-infected C57BL/6 mice were treated with collagenase/DNase to form single-cell suspensions. These cells were cultured with a _lacZ_-inducible hybridoma specific for influenza NP (BWZ-IFA.NP4) and enumerated in duplicate for β-galactosidase-producing cells. Each time point represents the mean of three to five mice. (B) A CD11c+ cell is responsible for presentation of DbNP366 after influenza infection. Three days after i.n. infection with HKx31 influenza, mediastinal LNs were pooled (15 mice), and collagenase/DNase was digested to form single cells. These cells either were left undepleted or were depleted of specific cellular subsets by using mAb staining followed by anti-rat Dynabeads. They were then cultured with a _lacZ_-inducible hybridoma specific for a class I-restricted epitope of influenza NP (BWZ-IFA.NP4). Data show the mean and SD of three separate experiments. Data for CD4 depletion show the mean (bar) and independent values (open circles) of two experiments. *, P < 0.01 or less.
Fig. 2.
Two subsets of DC prime naïve CD8+ T cells after i.n. virus infection. Three days after i.n. infection with either recombinant influenza A virus Flu.gB (A) or HSV (B), DC were enriched from the mediastinal LNs, stained for CD8α and CD45RA expression, and sorted by fluorescence-activated cell sorter (FACS) into CD8α DC, DN DC, or plasmacytoid DC before culturing with CFSE-labeled gBT-I CD8+ T cells. Proliferation was analyzed at 60 h of culture. The percentage of proliferating cells for each culture is indicated in the upper left corner of each histogram. Shown are representative experiments from at least three separate experiments.
Fig. 3.
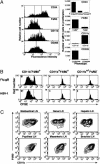
Phenotypical analysis of the DN DC presenting viral antigen after i.n. infection. (A) DC from C57BL/6 mice infected 3 d earlier with Flu.gB (10 mice per group) were enriched as described in Materials and Methods. Enriched DC were stained for CD11c, CD8α, and CD45RA in addition to one of the following: CD24, F4/80, CD11b, or CD205. Cells staining for CD8α and CD45RA were excluded, and remaining CD11c+ cells were sorted according to their level of expression of each additional marker (expression levels are indicated on flow cytometry histograms). Sorted DC were cultured with 5 × 10⁴ CFSE-labeled gBT-I cells, and proliferation was assessed by loss of CFSE staining. (B) Mice were infected with either Flu.gB (Upper) or HSV (Lower), and DC populations were enriched as above but were additionally depleted of CD8+ and CD45RA+ cells and then stained for CD11c, CD11b, and F4/80 expression before sorting for CD11b–F4/80+, CD11b+F4/80+, and F4/80– cells. CFSE-labeled gBT-I CD8+ T cells (5 × 10⁴) were cultured with these DC subsets, and proliferation was analyzed at 60 h of culture. The percentage of proliferating cells for each culture is indicated in each histogram. Data are representative of three separate experiments. (C) Analysis of expression of F4/80 and CD11b on purified DN DC subsets from various LNs after depletion of CD8α+ and CD45RA+ cells. Profiles are gated on CD11c+PI– cells.
Fig. 4.
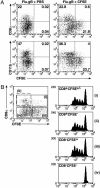
Trafficking and antigen presentation by DC subsets after influenza infection. (A) Mice were inoculated i.n. with CFSE or carrier 6 h before i.n. infection with Flu.gB. Three days later, mediastinal LNs were pooled from four mice per group and digested with collagenase/DNase. Cell suspensions were enriched for conventional DC by labeling cells with antibodies anti-CD3 (KT3), anti-Thy1 (T24/31.7), anti-B220 (RA3–6B2), anti-GR-1 (RB6–8C5), and anti-erythrocyte (TER-119) followed by depletion with anti-rat Ig-coupled magnetic beads. DC preparations in Lower also were depleted of CD8α+ cells. Cells were stained with anti-CD11c-PE and anti-CD8α-APC (Upper) or anti-CD11c-PE and anti-CD11b-bio/SA-APC (Lower), and CD11c+ cells were examined for CFSE expression. CFSE+ DC represented 2–4% of CD11c+ cells in naïve mice. (B) DC were prepared from CFSE-treated mice as in A and stained with anti-CD11c-PE and CD8α-APC (Left). These cells then were sorted into four groups: (i) CD8α+ DC, (ii) CD8α+CFSE– DC, (iii) CD8α–CFSE+ DC, and (iv) CD8α–CFSE– DC; and 12,500 DC of each population were cultured with 5 × 10⁴ CFSE-labeled gBT-I CD8+ T cells. Proliferation was analyzed at 60 h of culture. Data are representative of two experiments.
Fig. 5.
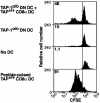
CD8α–CD11b– DC can act as a source of antigen for CD8α DC. Three days after i.n. infection of TAP-10/0 mice with the recombinant influenza A virus Flu.gB, DC were enriched from the mediastinal LNs (CD45RA+ cells were depleted), stained for CD11c, CD11b, and CD8α expression, and sorted by fluorescence-activated cell sorter (FACS) for CD8α–CD11b– (DN) DC. These antigen-bearing DN DC then were cocultured with CD8α+ DC purified from mediastinal LN of naïve C57BL/6 mice at a 10:1 ratio together with CFSE-labeled gBT-I CD8+ T cells (first histogram). Control cultures included TAP-10/0 DN DC from infected mice together with gBT-I CD8+ T cells (second histogram), gBT-I CD8+ T cells alone (third histogram), and gBT-I cells with splenic CD8α DC pulsed with 0.001 μM gB peptide (fourth histogram). Proliferation of gBT-I T cells was analyzed at 60 h of culture. The percentage of proliferating cells for each culture is indicated in the upper left corner of each histogram. Shown is a representative experiment from three separate experiments.
Similar articles
- Migratory dendritic cells transfer antigen to a lymph node-resident dendritic cell population for efficient CTL priming.
Allan RS, Waithman J, Bedoui S, Jones CM, Villadangos JA, Zhan Y, Lew AM, Shortman K, Heath WR, Carbone FR. Allan RS, et al. Immunity. 2006 Jul;25(1):153-62. doi: 10.1016/j.immuni.2006.04.017. Immunity. 2006. PMID: 16860764 - Anatomic location defines antigen presentation by dendritic cells to T cells in response to intravenous soluble antigens.
Chung Y, Chang JH, Kim BS, Lee JM, Kim HY, Kang CY. Chung Y, et al. Eur J Immunol. 2007 Jun;37(6):1453-62. doi: 10.1002/eji.200636544. Eur J Immunol. 2007. PMID: 17474148 - Lung CD103+ dendritic cells efficiently transport influenza virus to the lymph node and load viral antigen onto MHC class I for presentation to CD8 T cells.
Ho AW, Prabhu N, Betts RJ, Ge MQ, Dai X, Hutchinson PE, Lew FC, Wong KL, Hanson BJ, Macary PA, Kemeny DM. Ho AW, et al. J Immunol. 2011 Dec 1;187(11):6011-21. doi: 10.4049/jimmunol.1100987. Epub 2011 Oct 31. J Immunol. 2011. PMID: 22043017 - Unique functions of splenic CD8alpha+ dendritic cells during infection with intracellular pathogens.
Neuenhahn M, Busch DH. Neuenhahn M, et al. Immunol Lett. 2007 Dec 15;114(2):66-72. doi: 10.1016/j.imlet.2007.09.007. Epub 2007 Oct 12. Immunol Lett. 2007. PMID: 17964665 Review.
Cited by
- Dendritic cells and influenza A virus infection.
Waithman J, Mintern JD. Waithman J, et al. Virulence. 2012 Nov 15;3(7):603-8. doi: 10.4161/viru.21864. Epub 2012 Oct 17. Virulence. 2012. PMID: 23076333 Free PMC article. Review. - Myelopoiesis in spleen-producing distinct dendritic-like cells.
Tan JK, O'Neill HC. Tan JK, et al. J Cell Mol Med. 2012 Aug;16(8):1924-33. doi: 10.1111/j.1582-4934.2011.01490.x. J Cell Mol Med. 2012. PMID: 22117595 Free PMC article. - Pulmonary dendritic cell development and antigen acquisition.
Desch AN, Henson PM, Jakubzick CV. Desch AN, et al. Immunol Res. 2013 Mar;55(1-3):178-86. doi: 10.1007/s12026-012-8359-6. Immunol Res. 2013. PMID: 22968708 Free PMC article. Review. - Spleen as a site for hematopoiesis of a distinct antigen presenting cell type.
O'Neill HC, Griffiths KL, Periasamy P, Hinton RA, Hey YY, Petvises S, Tan JK. O'Neill HC, et al. Stem Cells Int. 2011;2011:954275. doi: 10.4061/2011/954275. Epub 2011 Nov 15. Stem Cells Int. 2011. PMID: 22190965 Free PMC article. - Induction of T cell immunity by cutaneous genetic immunization with recombinant lentivector.
He Y, Falo LD. He Y, et al. Immunol Res. 2006;36(1-3):101-17. doi: 10.1385/IR:36:1:101. Immunol Res. 2006. PMID: 17337771 Free PMC article. Review.
References
- Banchereau, J. & Steinman, R. M. (1998) Nature 392, 245–252. - PubMed
- Belz, G. T., Smith, C. M., Eichner, D., Shortman, K., Karupiah, G. & Heath, W. R. (2004) J. Immunol. 172, 1996–2000. - PubMed
- Allan, R. S., Smith, C. M., Belz, G., van Lint, A. L., Wakim, L. M., Heath, W. R. & Carbone, F. R. (2003) Science 301, 1925–1928. - PubMed
- Smith, C. M., Belz, G. T., Wilson, N. S., Villadangos, J. A., Shortman, K., Carbone, F. R. & Heath, W. R. (2003) J. Immunol. 170, 4437–4440. - PubMed
Publication types
MeSH terms
Substances
LinkOut - more resources
Full Text Sources
Other Literature Sources
Medical
Molecular Biology Databases
Research Materials


