ADP-ribosylation factor 6 regulates tumor cell invasion through the activation of the MEK/ERK signaling pathway - PubMed (original) (raw)
ADP-ribosylation factor 6 regulates tumor cell invasion through the activation of the MEK/ERK signaling pathway
Sarah E Tague et al. Proc Natl Acad Sci U S A. 2004.
Abstract
Tumor cell invasion through the extracellular matrix is accompanied by the formation of invadopodia, which are actin-rich protrusions at the adherent surface of cells at sites of extracellular matrix degradation. Using the invasive human melanoma cell line LOX as a model system, we demonstrate that the ADP-ribosylation factor 6 (ARF6) GTPase is an important regulator of invadopodia formation and cell invasion. We show that ARF6 localizes to invadopodia of LOX cells. Sustained activation of ARF6 significantly enhances the invasive capacity of melanoma as well as breast tumor cell lines, whereas dominant negative ARF6 abolishes basal cell invasive capacity as well as invasion induced by growth factors. Furthermore, using biochemical assays, we show that enhanced invasive capacity is accompanied by the activation of endogenous ARF6. Finally, we provide evidence that ARF6-enhanced melanoma cell invasion depends on the activation of the extracellular signal-regulated kinase (ERK), and that the ARF6 GTPase cycle regulates ERK activation. This study describes a vital role for ARF6 in melanoma cell invasion and documents a link between ARF6-mediated signaling and ERK activation.
Figures
Fig. 1.
CFDSE-labeled gelatin is degraded around actin-rich invadopodia formed by LOX cells. LOX cells were seeded on CFDSE-labeled gelatin (green) and allowed to invade for 12 h. The cells were then fixed, permeablized, and stained for actin by using rhodamine phalloidin (red). (A) The image on the left is a single confocal plane along the x/y axis at the tips of invadopodia. (B) The image on the right is a stacked side projection of the same cell along the x/z axis. (Bar = 10 μm.) (C) The image is taken along the ventral cell surface. The number of invadopodia varies from one invading cell to another (compare cells marked by arrow and arrowhead).
Fig. 2.
Endogenous ARF6 localizes to invadopodia along with actin and paxillin. (A) LOX cells were processed for immunofluorescence microscopy and labeled for endogenous ARF6 (red) and Tfn-Rs (green). The image is taken across a single confocal plane at the cell body (x/y axis). (B–D) LOX cells plated on CFDSE-labeled gelatin (green) were fixed, permeablized, and immunofluorescently labeled for endogenous ARF6 (B_–_D) and actin (C), or paxillin (D). Images are across a single confocal plane along the x/y axis at the tips of invadopodia. (B) Endogenous ARF6 (red) can be seen extending into invadopodia, which are actively degrading gelatin. (C and D) Actin (red) and paxillin (red) localizes along with endogenous ARF6 (blue) in invadopodia. (Bar = 10 μm.)
Fig. 3.
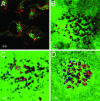
Constitutively active ARF6 enhances cell invasion, whereas the dominant negative mutant of ARF6 prevents invadopodia formation and gelatin degradation. (A–F). LOX cells were transfected with plasmid encoding the HA-tagged ARF6(Q67L) (A–D) or the HA-tagged ARF6(T27N) (E and F). Images are shown along the x/y (A and C–E)or x/z axis (B and F). For all images, the HA-tagged ARF6 mutants were immunofluorescently labeled red and the gelatin is green. (Bar = 10 μm.) (G) MDA-MB-231 were transfected with plasmid encoding the HA-tagged ARF6(Q67L) or the HA-tagged ARF6(T27N). Images are shown along the x/y axis. (H) Quantitation of cell invasion by ARF6 GTP/GDP mutants. LOX cells were transfected with plasmids as indicated and seeded on gelatin-coated coverslips. After 24 h on gelatin, the percentage of transfected cells with gelatin degradation underneath them was calculated as an indicator of invasion and was compared to the percentage of untransfected cells that exhibited gelatin degradation.
Fig. 4.
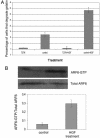
ARF6 activation is required for and occurs during HGF-induced invasion. (A) LOX cells were transfected with plasmids as indicated. Cells plated on CFDSE-labeled gelatin were treated with (or without) 40 ng/ml HGF for 1 h. The percentage of transfected and nontransfected cells with gelatin degradation underneath them was calculated. (B) LOX cells were seeded on gelatin-coated tissue culture dishes and treated with or without HGF as described above. Equal amounts of cells lysates from each experimental condition were incubated with GST-MT2 beads to analyze the level of endogenous ARF6-GTP by using procedures previously described (14). Bound ARF6-GTP was visualized by Western blot analysis by using an anti-ARF6 mouse monoclonal antibody. The band densities were measured by using the enhanced UltroScan XL Laser Densitometer (Pharmacia) and the ratio of ARF6-GTP to total ARF6 was calculated. A representative immunoblot of three independent experiments is shown.
Fig. 5.
Activated ARF6 partially colocalizes with activated ERK in invadopodia, and the ARF6 GTPase cycle regulates ERK activation. Cells were transfected as indicated and seeded on CFDSE-labeled gelatin and allowed to invade. Cells were immunofluorescently labeled for HA and/or phosphorylated ERK as indicated. These images were pseudocolored for better visualization of colocalization between ARF6 (red) and phospho-ERK (green). CFDSE-labeled gelatin is pseudocolored blue. (A and B) Images shown here are single confocal sections at the tips of invadopodia of invading ARF6(Q67L)-expressing cells. A is the same as B except that A does not show gelatin staining. (C–H) These images are confocal sections taken along the cell body to better visualize the differences in phospho-ERK levels. Cells were transfected with ARF6(Q67L)-HA (C–F) or ARF6(T27N)-HA (D–G) and labeled for HA or phospho-ERK as indicated. As seen, ARF6(Q67L)-transfected cells have increased levels of activated ERK (arrows), whereas ARF6(T27N)-transfected cells have decreased levels of activated ERK (arrows) compared with other untransfected cells in the same field. (Bar = 10 μm.) (I) LOX cells transfected with plasmids expressing ARF6(Q67L) or ARF6(T27N) or transfected with empty plasmid as control, were plated on gelatin-coated tissue culture dishes, and treated with or without 40 ng/ml HGF for 30 min and lysed. Equal amounts of cell lysates were resolved by SDS/PAGE followed by probing with antisera directed specifically against total ERK, phospho-ERK, or HA. Representative immunoblots of three independent experiments are shown. The relative intensity of lower phospho-ERK band (arrow) was assessed by densitometric scanning.
Fig. 6.
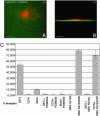
Inactivation of MEK blocks ARF6-GTP-induced cell invasion. (A and B) ARF6(Q67L)-transfected cells were seeded on CFDSE-labeled, gelatin-coated coverslips and allowed to invade in the presence of the MEK inhibitor, PD98059. Cells were fixed, permeablized, and immunofluorescently labeled for HA. A and B are taken along the x/y and x/z axis respectively. (Bar = 10 μm.) (C) LOX cells were singly or dually transfected with plasmids encoding ARF6 and MEK-1 mutants as indicated. Cells were seeded on gelatin and treated with or without PD98059 as indicated. The percentage of single or dually transfected cells exhibiting gelatin degradation underneath them was scored.
Similar articles
- Investigating the role of ADP-ribosylation factor 6 in tumor cell invasion and extracellular signal-regulated kinase activation.
Hoover H, Muralidharan-Chari V, Tague S, D'Souza-Schorey C. Hoover H, et al. Methods Enzymol. 2005;404:134-47. doi: 10.1016/S0076-6879(05)04014-0. Methods Enzymol. 2005. PMID: 16413265 - EFA6A enhances glioma cell invasion through ADP ribosylation factor 6/extracellular signal-regulated kinase signaling.
Li M, Ng SS, Wang J, Lai L, Leung SY, Franco M, Peng Y, He ML, Kung HF, Lin MC. Li M, et al. Cancer Res. 2006 Feb 1;66(3):1583-90. doi: 10.1158/0008-5472.CAN-05-2424. Cancer Res. 2006. PMID: 16452216 - Roles of Arf6 in cancer cell invasion, metastasis and proliferation.
Li R, Peng C, Zhang X, Wu Y, Pan S, Xiao Y. Li R, et al. Life Sci. 2017 Aug 1;182:80-84. doi: 10.1016/j.lfs.2017.06.008. Epub 2017 Jun 15. Life Sci. 2017. PMID: 28625359 Review. - Pathological functions of the small GTPase Arf6 in cancer progression: Tumor angiogenesis and metastasis.
Hongu T, Yamauchi Y, Funakoshi Y, Katagiri N, Ohbayashi N, Kanaho Y. Hongu T, et al. Small GTPases. 2016 Apr 2;7(2):47-53. doi: 10.1080/21541248.2016.1154640. Epub 2016 Feb 24. Small GTPases. 2016. PMID: 26909552 Free PMC article. Review.
Cited by
- Extracellular Vesicles and Their Roles in Cancer Progression.
Chang WH, Cerione RA, Antonyak MA. Chang WH, et al. Methods Mol Biol. 2021;2174:143-170. doi: 10.1007/978-1-0716-0759-6_10. Methods Mol Biol. 2021. PMID: 32813249 Free PMC article. - EphA2 engages Git1 to suppress Arf6 activity modulating epithelial cell-cell contacts.
Miura K, Nam JM, Kojima C, Mochizuki N, Sabe H. Miura K, et al. Mol Biol Cell. 2009 Apr;20(7):1949-59. doi: 10.1091/mbc.e08-06-0549. Epub 2009 Feb 4. Mol Biol Cell. 2009. PMID: 19193766 Free PMC article. - The EGFR-GEP100-Arf6-AMAP1 signaling pathway specific to breast cancer invasion and metastasis.
Sabe H, Hashimoto S, Morishige M, Ogawa E, Hashimoto A, Nam JM, Miura K, Yano H, Onodera Y. Sabe H, et al. Traffic. 2009 Aug;10(8):982-93. doi: 10.1111/j.1600-0854.2009.00917.x. Epub 2009 Apr 21. Traffic. 2009. PMID: 19416474 Free PMC article. Review. - The matricellular protein CCN5 regulates podosome function via interaction with integrin αvβ 3.
Myers RB, Wei L, Castellot JJ Jr. Myers RB, et al. J Cell Commun Signal. 2014 Jun;8(2):135-46. doi: 10.1007/s12079-013-0218-2. Epub 2014 Feb 2. J Cell Commun Signal. 2014. PMID: 24488697 Free PMC article. - Extracellular signal-regulated kinase regulates clathrin-independent endosomal trafficking.
Robertson SE, Setty SR, Sitaram A, Marks MS, Lewis RE, Chou MM. Robertson SE, et al. Mol Biol Cell. 2006 Feb;17(2):645-57. doi: 10.1091/mbc.e05-07-0662. Epub 2005 Nov 28. Mol Biol Cell. 2006. PMID: 16314390 Free PMC article.
References
- Basbaum, C. B. & Werb, Z. (1996) Curr. Opin. Cell. Biol. 8, 731-738. - PubMed
- Bowden, E. T., Barth, M., Thomas, D., Glazer, R. I. & Mueller, S. C. (1999) Oncogene 18, 4440-4449. - PubMed
- Chen, W. T. (1996) Enzyme Protein 49, 59-71. - PubMed
Publication types
MeSH terms
Substances
LinkOut - more resources
Full Text Sources
Other Literature Sources
Medical
Miscellaneous


