Synaptotagmin VII restricts fusion pore expansion during lysosomal exocytosis - PubMed (original) (raw)
Synaptotagmin VII restricts fusion pore expansion during lysosomal exocytosis
Jyoti K Jaiswal et al. PLoS Biol. 2004 Aug.
Abstract
Synaptotagmin is considered a calcium-dependent trigger for regulated exocytosis. We examined the role of synaptotagmin VII (Syt VII) in the calcium-dependent exocytosis of individual lysosomes in wild-type (WT) and Syt VII knockout (KO) mouse embryonic fibroblasts (MEFs) using total internal reflection fluorescence microscopy. In WT MEFs, most lysosomes only partially released their contents, their membrane proteins did not diffuse into the plasma membrane, and inner diameters of their fusion pores were smaller than 30 nm. In Syt VII KO MEFs, not only was lysosomal exocytosis triggered by calcium, but all of these restrictions on fusion were also removed. These observations indicate that Syt VII does not function as the calcium-dependent trigger for lysosomal exocytosis. Instead, it restricts the kinetics and extent of calcium-dependent lysosomal fusion.
Conflict of interest statement
The authors have declared that no conflicts of interest exist.
Figures
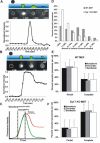
Figure 1. Fate of Lumenal Content during Lysosomal Fusion
MEFs were incubated for 2 h with 70 kDa FITC–dextran followed by more than 3 h in dextran-free media to chase the dextrans into the lysosomes. These cells were then treated with calcium ionophore (A23187) to trigger exocytosis of lysosomes. (A and B) The middle panels are images of lyosomes undergoing complete (A) and partial (B) exocytosis. Intensity plots for the regions in these images marked by dotted circles are shown in the lower panel. The top panel shows a schematic representation of these different stages. (C) Schematic fluorescence intensity plots for lysosomes undergoing partial (red) or complete (green) fusion. Owing to the exponential decay of the evanescent field (blue; top panels in [A] and [B]) away from the coverslip, a lysosome that is more than 150 nm from the cell membrane (black line in top panels in [A] and [B]) is not fluorescent. As this lysosome moves closer (labeled as “entry into evanescent field”), its fluorescence intensity increases. Since the lumen of lysosome is acidic, it quenches FITC fluorescence. As soon as the fusion pore is formed, the lysosomal lumen is rapidly alkalinized resulting in an increase of FITC–dextran fluorescence (“pore opening”). Following the pore opening, the dextran is released and it diffuses away from the site of the fusion, causing the lumenal fluorescence to decrease (“release”). (D) A histogram of the fraction of lumenal contents released by exocytosing lysosomes. Upon ionophore-triggered fusion, 21% of all lysosomes analyzed in WT MEFs (n = 47; gray bars) and 45% of all in Syt VII KO MEFs (n = 51; white bars) completely released their lumenal content. (E and F) To monitor the nature of lysosomal fusion in individual WT MEFs (E) and Syt VII KO MEFs (F), calcium was increased using ionophore (WT, n = 7 cells; KO, n = 9 cells) as well as the IP3 agonists bombesin (WT, n = 6 cells; KO, n = 9 cells) and thrombin (WT, n = 5 cells; KO, n = 7 cells). Irrespective of the means, increase in calcium led to most lysosomes to fuse partially in WT MEFs (E) and completely in Syt VII KO MEFs (F). The error bars represent SEM.
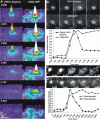
Figure 2. Fate of Membrane Protein during Lysosomal Fusion
Lysosomal membranes in MEFs were labeled by transfecting cells with a vector encoding a CD63–GFP fusion protein, and expression was allowed for 48 h. For simultaneous labeling of lysosomal membrane and lumen, the CD63–GFP transfected cells were labeled with 70 kDa TRITC–dextran as described in Figure 1. (A) Following ionophore-induced calcium increase in WT MEFs, when the TRITC–dextran was released completely (left), CD63–GFP (right) was delivered to the plasma membrane, but it remained in multiple puncta near the site of fusion rather than diffuse away. The panels are pseudocolor surface plots, with the x and y axis representing the coordinates and the z axis representing the fluorescence intensity of individual pixels. (B) In the event of partial release of TRITC–dextran (top row), the CD63–GFP (bottom row) did not appear to be delivered to the plasma membrane. The lower panel shows the plot of fluorescent intensity of lumenal and membrane label (within the dotted circle) of the lysosome shown in (B). (C and D) Analysis of CD63–GFP-labeled lysosomes in WT MEFs (C) and in Syt VII KO MEFs (D) indicates that while CD63–GFP is retained in puncta in the WT MEFs, it diffuses freely in the plasma membrane in the SytVII KO MEFs. The lower panel shows the total and peak intensity plots of CD63–GFP-labeled lysosome in (D).
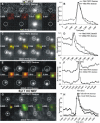
Figure 3. Presence of Syt VII Restricts the Size of the Fusion Pore
The lumen of lysosomes was loaded simultaneously using different-sized FITC- and TRITC-labeled dextran, using the approach described in Figures 1 and 2. Representative plots shown here demonstrate the fate of both dextran populations in individual lysosomes following the increase in intracellular calcium by addition of calcium ionophore. In WT MEFs, exocytosing lysosomes that released 70 kDa TRITC–dextran also simultaneously released 70 kDa FITC–dextran (A and B), 250 kDa FITC–dextran (C and D), but not 500 kDa FITC–dextran (E and F). In Syt VII KO MEFs, lysosomes that released 70 kDa TRITC–dextran also released 500 kDa FITC–dextran (G and H). In all cases the plots represent the normalized fluorescence intensity of the region marked in the images by dotted circles.
Figure 4. Schematic Representation of the Fate of Lumenal and Membrane Cargo during Lysosomal Exocytosis
(A) Partial fusion of the lysosomes from WT MEFs result in the release of a fraction of the smaller (70–250 kDa; red circles) dextran, but no release of the larger (500 kDa; blue circles) dextran. None of the lysosomal membrane protein (green bars) is delivered to the plasma membrane. (B) Complete fusion leads to release of both the large and the small dextrans and delivery of the membrane proteins to the plasma membrane, but the proteins aggregate in small puncta near the site of fusion. (C) Knockout of Syt VII causes larger-sized dextran to be released even during partial fusion, and the membrane protein is still not delivered to the plasma membrane. (D) During complete fusion, both sized dextrans are released completely and the membrane proteins delivered to plasma membrane are free to diffuse away from the site of fusion.
Figure 5. Temporal Analysis of Lysosomal Exocytosis and Fusion Pore Opening Using 70 kDa FITC–Dextran as Lumenal Marker
(A) Histogram of the release time (time taken for the vesicular fluorescence to drop from peak to postfusion resting value). Release time was less than 0.75 s for more than two-thirds of lysosomes in Syt VII KO MEF (n = 62 lysosomes), while most lysosomes (81%) in WT MEFs (n = 56 lysosomes) released their lumenal content for more than 0.75 s. (B) Analysis of release time of lysosomes using ionophore, bombesin, and thrombin to trigger lysosomal exocytosis. Irrespective of the means of calcium increase, lysosomes in Syt VII KO MEFs released their lumenal content significantly faster (p = 0.002, 0.01, and 0.03, respectively). (C) Histogram of the number of lysosomes exocytosing as a function of the time following calcium ionophore addition. Fluorescent dextran was used as a lumenal marker; the time axis indicates seconds elapsed following the addition of ionophore. Exocytosis initiated earlier in the Syt VII KO MEFs (white bars; n = 8 cells) compared to WT MEFs (gray bars; n = 6 cells). (D) No change was observed in the total number of lysosomes that exocytosed at the basal surface of WT or Syt VII KO MEFs when calcium was raised using ionophore or thrombin; however, compared to WT MEFs, bombesin triggered exocytosis of half as many lysosomes in the Syt VII KO MEFs (asterix represents p value < 0.02). The error bars represent SEM.
Similar articles
- Plasma membrane repair is mediated by Ca(2+)-regulated exocytosis of lysosomes.
Reddy A, Caler EV, Andrews NW. Reddy A, et al. Cell. 2001 Jul 27;106(2):157-69. doi: 10.1016/s0092-8674(01)00421-4. Cell. 2001. PMID: 11511344 - Ca2+ and synaptotagmin VII-dependent delivery of lysosomal membrane to nascent phagosomes.
Czibener C, Sherer NM, Becker SM, Pypaert M, Hui E, Chapman ER, Mothes W, Andrews NW. Czibener C, et al. J Cell Biol. 2006 Sep 25;174(7):997-1007. doi: 10.1083/jcb.200605004. Epub 2006 Sep 18. J Cell Biol. 2006. PMID: 16982801 Free PMC article. - Synaptotagmin VII regulates Ca(2+)-dependent exocytosis of lysosomes in fibroblasts.
Martinez I, Chakrabarti S, Hellevik T, Morehead J, Fowler K, Andrews NW. Martinez I, et al. J Cell Biol. 2000 Mar 20;148(6):1141-49. doi: 10.1083/jcb.148.6.1141. J Cell Biol. 2000. PMID: 10725327 Free PMC article. - There's more to life than neurotransmission: the regulation of exocytosis by synaptotagmin VII.
Andrews NW, Chakrabarti S. Andrews NW, et al. Trends Cell Biol. 2005 Nov;15(11):626-31. doi: 10.1016/j.tcb.2005.09.001. Epub 2005 Sep 15. Trends Cell Biol. 2005. PMID: 16168654 Review. - Synaptotagmin regulates mast cell functions.
Baram D, Mekori YA, Sagi-Eisenberg R. Baram D, et al. Immunol Rev. 2001 Feb;179:25-34. doi: 10.1034/j.1600-065x.2001.790103.x. Immunol Rev. 2001. PMID: 11292024 Review.
Cited by
- Lysosome-Mediated Plasma Membrane Repair Is Dependent on the Small GTPase Arl8b and Determines Cell Death Type in Mycobacterium tuberculosis Infection.
Michelet X, Tuli A, Gan H, Geadas C, Sharma M, Remold HG, Brenner MB. Michelet X, et al. J Immunol. 2018 May 1;200(9):3160-3169. doi: 10.4049/jimmunol.1700829. Epub 2018 Mar 28. J Immunol. 2018. PMID: 29592961 Free PMC article. - Annexin A6 mediates calcium-dependent exosome secretion during plasma membrane repair.
Williams JK, Ngo JM, Lehman IM, Schekman R. Williams JK, et al. Elife. 2023 May 19;12:e86556. doi: 10.7554/eLife.86556. Elife. 2023. PMID: 37204294 Free PMC article. - The small chemical vacuolin-1 alters the morphology of lysosomes without inhibiting Ca2+-regulated exocytosis.
Huynh C, Andrews NW. Huynh C, et al. EMBO Rep. 2005 Sep;6(9):843-7. doi: 10.1038/sj.embor.7400495. EMBO Rep. 2005. PMID: 16113649 Free PMC article. - Synaptotagmin-7 enhances calcium-sensing of chromaffin cell granules and slows discharge of granule cargos.
Bendahmane M, Morales A, Kreutzberger AJB, Schenk NA, Mohan R, Bakshi S, Philippe JM, Zhang S, Kiessling V, Tamm LK, Giovannucci DR, Jenkins PM, Anantharam A. Bendahmane M, et al. J Neurochem. 2020 Sep;154(6):598-617. doi: 10.1111/jnc.14986. Epub 2020 Mar 9. J Neurochem. 2020. PMID: 32058590 Free PMC article. - Massive Ca-induced membrane fusion and phospholipid changes triggered by reverse Na/Ca exchange in BHK fibroblasts.
Yaradanakul A, Wang TM, Lariccia V, Lin MJ, Shen C, Liu X, Hilgemann DW. Yaradanakul A, et al. J Gen Physiol. 2008 Jul;132(1):29-50. doi: 10.1085/jgp.200709865. Epub 2008 Jun 18. J Gen Physiol. 2008. PMID: 18562498 Free PMC article.
References
- Aravanis AM, Pyle JL, Tsien RW. Single synaptic vesicles fusing transiently and successively without loss of identity. Nature. 2003;423:643–647. - PubMed
- Ayala BP, Vasquez B, Clary S, Tainer JA, Rodland K, et al. The pilus-induced Ca2+ flux triggers lysosome exocytosis and increases the amount of Lamp1 accessible to Neisseria IgA1 protease. Cell Microbiol. 2001;3:265–275. - PubMed
- Blott EJ, Bossi G, Clark R, Zvelebil M, Griffiths GM. Fas ligand is targeted to secretory lysosomes via a proline-rich domain in its cytoplasmic tail. J Cell Sci. 2001;114:2405–2416. - PubMed
- Brose N, Petrenko AG, Sudhof TC, Jahn R. Synaptotagmin: A calcium sensor on the synaptic vesicle surface. Science. 1992;256:1021–1025. - PubMed
Publication types
MeSH terms
Substances
Grants and funding
- R01 AI034867/AI/NIAID NIH HHS/United States
- R01 GM064625/GM/NIGMS NIH HHS/United States
- R01-GM064625/GM/NIGMS NIH HHS/United States
- R01-AI34867/AI/NIAID NIH HHS/United States
LinkOut - more resources
Full Text Sources
Other Literature Sources
Research Materials


