Induction of Dickkopf-1, a negative modulator of the Wnt pathway, is associated with neuronal degeneration in Alzheimer's brain - PubMed (original) (raw)
Induction of Dickkopf-1, a negative modulator of the Wnt pathway, is associated with neuronal degeneration in Alzheimer's brain
Andrea Caricasole et al. J Neurosci. 2004.
Abstract
We used primary cultures of cortical neurons to examine the relationship between beta-amyloid toxicity and hyperphosphorylation of the tau protein, the biochemical substrate for neurofibrillary tangles of Alzheimer's brain. Exposure of the cultures to beta-amyloid peptide (betaAP) induced the expression of the secreted glycoprotein Dickkopf-1 (DKK1). DKK1 negatively modulates the canonical Wnt signaling pathway, thus activating the tau-phosphorylating enzyme glycogen synthase kinase-3beta. DKK1 was induced at late times after betaAP exposure, and its expression was dependent on the tumor suppressing protein p53. The antisense induced knock-down of DKK1 attenuated neuronal apoptosis but nearly abolished the increase in tau phosphorylation in betaAP-treated neurons. DKK1 was also expressed by degenerating neurons in the brain from Alzheimer's patients, where it colocalized with neurofibrillary tangles and distrophic neurites. We conclude that induction of DKK1 contributes to the pathological cascade triggered by beta-amyloid and is critically involved in the process of tau phosphorylation.
Figures
Figure 6.
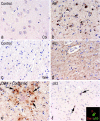
_a_-f, Temporal cortex and white matter immunostained for DKK1 from a representative AD case (b, d, e, f) and an age-matched control (a, c). The examined cases include six nondemented controls (age at death, 77 ± 4.36), three senile dementia of Alzheimer type (SDAT) (age at death, 85.6 ± 4.8), one familial SDAT (age at death, 76), one AD (age at death, 70), and one presenil AD (age at death, 68). DKK1 immunostaining is found in temporal cortex (Ctx) (b) and white matter (Wm) (d) in AD cases. No staining is observed in nondemented controls (a, c). In e, DKK1-positive glial cells (pointed by arrows) surrounding a Congo red-positive plaque are shown. In f, p53-positive cells from temporal cortex of AD are illustrated. A confocal image of DKK1 expression (red) in neurons bearing p53 nuclear expression (green) is shown in the inset. Alz, Alzheimer's dementia.
Figure 1.
Protective effects of p53 knock-down in pure neuronal cultures exposed to βAP. a, p53 antisense oligonucleotides (p53-As) increase neuronal survival in cultures exposed to 25 μ
m
βAP(25-35) for 24 hr. Values are means ± SEM of four determinations. *p < 0.05 versus controls (CTRL); #p < 0.05 versus βAP alone (one-way ANOVA followed by Fisher's LSD test). b, Representative immunoblots of Bax (top) and p53 (bottom) in protein extracts from cortical neurons that have been treated with 25 μ
m
βAP(25-35) for 24 hr in the absence or presence of p53 As or senses (Sn). c, d, Densitometer scan analysis from three determinations. Values represent the means ± SEM of Bax (c) or p53 (d) normalized against β-actin in three independent experiments. *p < 0.05 versus controls, or #βAP and #βAP plus p53-Sn (one-way ANOVA followed by Fisher's LSD test).
Figure 2.
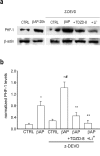
GSK3β inhibitors prevent tau hyperphosphorylation in neurons treated with βAP and z-DEVD. a, Immunoblot of PHF-1 obtained from neuronal cultures treated for 20 hr with 25 μ
m
βAP(25-35) alone or in the presence of 20 μ
m
z-DEVD; 100 μ
m
LiCl or 50 μ
m
TDZD-8 were added 7 hr after βAP. b, Densitometer scan analysis from three determinations. Values represent the means ± SEM of PHF-1 normalized against β-actin in three independent experiments. *p < 0.05 versus controls (CTRL), #βAP alone, or **βAP plusz-DEVD (one-way ANOVA followed by Fisher's LSD test).
Figure 3.
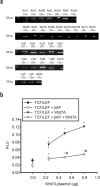
The Wnt transduction machinery is functional in cultured cortical neurons. RT-PCR analysis of mRNA for Wnt glycoproteins, Frizzled receptors, and the DKK1/Wnt coreceptors Lrp5 and Lrp6 in cortical neurons (CN) is shown in a. +, Positive control tissues (mixture of cDNA from brain, heart, liver, or kidney); -, negative controls (absence of cDNA). The 75 bp β-actin band is also shown. b, TCF/LEF-based luciferase responses to the overexpression of different concentrations of Wnt7a expression plasmid. Values are means ± SEM of three determinations normalized against the internal standard. *p < 0.05 versus the respective basal responses; #p < 0.05 versus TCF/LEF plus Wnt7A (one-way ANOVA followed by Fisher's LSD test). Filled and open circles indicate basal luciferase responses in the absence or presence of βAP, respectively. RLU, Relative light units.
Figure 4.
p53-dependent induction of DKK1 by βAP in cultured cortical neurons. a, RT-PCR analysis of DKK1 mRNA. Cultures were treated with 25 μ
m
βAP(25-35) for the indicated times. Expression of mRNA in rat cortex (CTX) is shown as a positive control. The 400 bp β-actin band is also shown. The 600 bp β-actin band, assessing genomic DNA contamination, was undetectable. b, Representative immunoblot of DKK1 in protein extracts from cortical neurons treated with 25 μ
m
βAP(25-35) for 20 hr in the absence or presence of p53 As or senses (Sn). Loading controls are included.
Figure 5.
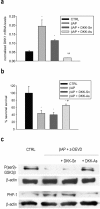
DKK1 knock-down attenuates cell death, GSK3β activation, and tau hyperphosphorylation in βAP-treated neurons. a, Real-time PCR analysis of DKK1 mRNA in neurons exposed to 25 μ
m
βAP(25-35) for 16 hr in the presence or absence of DKK1 antisenses (DKK-As) or senses (DKK-Sn). Values are means ± SEM of normalized DKK1 from four determinations. *p < 0.05 versus controls (CTRL), or *# βAP alone (one-way ANOVA followed by Fisher's LSD test). The effect of DKK-As on neuronal survival (b), GSK3β activation, and tau hyperphosphorylation (c) in cultures exposed to 25 μ
m
βAP(25-35) for 20 hr is shown. In b, values represent the means ± SEM of six determinations. *p < 0.05 versus controls (CTRL), or *# βAP alone (one-way ANOVA followed by Fisher's LSD test). In c, the immunoblot of PHF-1 was obtained from neuronal cultures treated with βAP in the presence of 20 μ
m
z-DEVD. The β-actin band is shown for comparison. The immunoblot is representative of three independent experiments with similar results. The immunoblot of phospho(ser9)-GSK3β was obtained under the same conditions and repeated twice with similar results.
Figure 7.
Association of DKK1 expression and hyperphosphorylated tau in AD temporal cortex. a, b, Neurons with NFT morphology (a) and dystrophic neurites (b) stain for DKK1. c, d, The AT8 antibody reveals the location of hyperphosphorylated tau (green) in neurons (c) and dystrophic neurites (d) expressing DKK1 (red). e, AT8 stains also DKK1-positive white matter fibers.
Similar articles
- Inhibition of Wnt signaling, modulation of Tau phosphorylation and induction of neuronal cell death by DKK1.
Scali C, Caraci F, Gianfriddo M, Diodato E, Roncarati R, Pollio G, Gaviraghi G, Copani A, Nicoletti F, Terstappen GC, Caricasole A. Scali C, et al. Neurobiol Dis. 2006 Nov;24(2):254-65. doi: 10.1016/j.nbd.2006.06.016. Epub 2006 Aug 17. Neurobiol Dis. 2006. PMID: 16919965 - Isorhynchophylline treatment improves the amyloid-β-induced cognitive impairment in rats via inhibition of neuronal apoptosis and tau protein hyperphosphorylation.
Xian YF, Mao QQ, Wu JC, Su ZR, Chen JN, Lai XP, Ip SP, Lin ZX. Xian YF, et al. J Alzheimers Dis. 2014;39(2):331-46. doi: 10.3233/JAD-131457. J Alzheimers Dis. 2014. PMID: 24164737 - Beta-amyloid peptide at sublethal concentrations downregulates brain-derived neurotrophic factor functions in cultured cortical neurons.
Tong L, Balazs R, Thornton PL, Cotman CW. Tong L, et al. J Neurosci. 2004 Jul 28;24(30):6799-809. doi: 10.1523/JNEUROSCI.5463-03.2004. J Neurosci. 2004. PMID: 15282285 Free PMC article. - The molecular bases of Alzheimer's disease and other neurodegenerative disorders.
Maccioni RB, Muñoz JP, Barbeito L. Maccioni RB, et al. Arch Med Res. 2001 Sep-Oct;32(5):367-81. doi: 10.1016/s0188-4409(01)00316-2. Arch Med Res. 2001. PMID: 11578751 Review. - [Alzheimer's disease: cellular and molecular aspects].
Octave JN, Pierrot N. Octave JN, et al. Bull Acad Natl Med. 2008 Feb;192(2):323-31; discussion 331-2. Bull Acad Natl Med. 2008. PMID: 18819686 Review. French.
Cited by
- Caffeine inhibits Notum activity by binding at the catalytic pocket.
Zhao Y, Ren J, Hillier J, Lu W, Jones EY. Zhao Y, et al. Commun Biol. 2020 Oct 8;3(1):555. doi: 10.1038/s42003-020-01286-5. Commun Biol. 2020. PMID: 33033363 Free PMC article. - Association between osteocalcin and cognitive performance in healthy older adults.
Bradburn S, McPhee JS, Bagley L, Sipila S, Stenroth L, Narici MV, Pääsuke M, Gapeyeva H, Osborne G, Sassano L, Meskers CG, Maier AB, Hogrel JY, Barnouin Y, Butler-Browne G, Murgatroyd C. Bradburn S, et al. Age Ageing. 2016 Nov;45(6):844-849. doi: 10.1093/ageing/afw137. Epub 2016 Aug 11. Age Ageing. 2016. PMID: 27515675 Free PMC article. - Induction of Dickkopf-1, a negative modulator of the Wnt pathway, is required for the development of ischemic neuronal death.
Cappuccio I, Calderone A, Busceti CL, Biagioni F, Pontarelli F, Bruno V, Storto M, Terstappen GT, Gaviraghi G, Fornai F, Battaglia G, Melchiorri D, Zukin RS, Nicoletti F, Caricasole A. Cappuccio I, et al. J Neurosci. 2005 Mar 9;25(10):2647-57. doi: 10.1523/JNEUROSCI.5230-04.2005. J Neurosci. 2005. PMID: 15758175 Free PMC article. - Wnt signaling contributes to withdrawal symptoms from opioid receptor activation induced by morphine exposure or chronic inflammation.
Wu M, Li Z, Liang L, Ma P, Cui D, Chen P, Wu G, Song XJ. Wu M, et al. Pain. 2020 Mar;161(3):532-544. doi: 10.1097/j.pain.0000000000001738. Pain. 2020. PMID: 31738230 Free PMC article.
References
- Arends M, Duyckaerts C, Rozemuller JM, Eikelenboom P, Hauw J-J (2000) Microglia, amyloid and dementia in Alzheimer disease. A correlative study. Neurobiol Aging 21: 39-47. - PubMed
- Bettini E, Magnani E, Terstappen GC (2002) Lithium induces gene expression through lymphoid enhancer-binding factor/T-cell factor responsive element in rat PC12 cells. Neurosci Lett 317: 50-52. - PubMed
- Braak H, Braak E (1995) Staging of Alzheimer's disease-related neurofibrillary changes. Neurobiol Aging 16: 271-278. - PubMed
- Caricasole A, Ferraro T, Rimland JM, Terstappen GC (2002) Molecular cloning and initial characterization of the MG61/PORC gene, the human homologue of the Drosophila segment polarity gene Porcupine. Gene 288: 147-157. - PubMed
- Caricasole A, Copani A, Caruso A, Caraci F, Iacovelli L, Sortino MA, Terstappen GC, Nicoletti F (2003) The Wnt pathway, cell-cycle activation and beta-amyloid: novel therapeutic strategies in Alzheimer's disease? Trends Pharmacol Sci 24: 233-238. - PubMed
Publication types
MeSH terms
Substances
LinkOut - more resources
Full Text Sources
Other Literature Sources
Medical
Research Materials
Miscellaneous


