Effect of green tea on blood glucose levels and serum proteomic patterns in diabetic (db/db) mice and on glucose metabolism in healthy humans - PubMed (original) (raw)
Effect of green tea on blood glucose levels and serum proteomic patterns in diabetic (db/db) mice and on glucose metabolism in healthy humans
Hiroshi Tsuneki et al. BMC Pharmacol. 2004.
Abstract
Background: Green tea is widely consumed in Asian countries and is becoming increasingly popular in Western countries. Epidemiologically, it has been suggested that green tea consumption prevents type 2 diabetes. The present study was aimed at providing evidence of improvement in glucose metabolism in diabetic mice and healthy humans upon green tea consumption.
Results: Green tea promoted glucose metabolism in healthy human volunteers at 1.5 g/body in oral glucose tolerance tests. Green tea also lowered blood glucose levels in diabetic db+/db+ mice and streptozotocin-diabetic mice 2-6 h after administration at 300 mg/kg without affecting serum insulin level, whereas no effect was observed in control mice (+m/+m and normal ddY mice). The serum protein profiles of db+/db+ and +m/+m mice were analyzed for the first time by SELDI (surface-enhanced laser desorption/ionization)-TOF (time-of-flight)-MS (mass spectrometry), and then compared to investigate any effects of oral green tea administration on serum proteins. The protein profiles in db+/db+ mice showed that the spectral peak intensities at the mass/charge ratios (m/z) of 4119, 4203, 4206, 4211, 4579, 9311 and 18691 were >3 times lower, and those of 13075, 17406, 17407, 17418, 17622, 18431 and 26100 were >3 times higher than respective peak intensities in +m/+m mice. When green tea was administered to db+/db+ mice, the peak intensities were markedly decreased at m/z 11651 and 11863, and slightly decreased at m/z 4212. The peak intensities at 7495, 7595, 7808, 14983, 15614, 31204 were markedly increased after the administration.
Conclusion: The present study provides evidence that green tea has an antidiabetic effect. Although we could not find simple reversed effect of green tea on the diabetes-induced modifications of the levels of several serum proteins, we found that the 4211 (4212) Da protein level that was decreased in the diabetic state was further decreased after green tea administration. This is the first report demonstrating that a certain serum protein may be involved in the antihyperglycemic effect of green tea. The contribution of this protein should be further studied.
Figures
Figure 1
Increase in glucose metabolism in healthy humans administered with green tea. Oral glucose tolerance curves (OGTT, n = 22) and basal blood glucose levels (Basal, n = 25) before and 30, 60 and 120 min after administration with either a suspension of green tea powder (●) or hot water (○). All participants were fasted since the last supper before starting the experiment at 9:30 a.m. In the glucose tolerance test, 225 ml of Trelan-G75 containing 75 g glucose was perorally administered 10 min after drinking a suspension of green tea powder (1.5 g/150 ml hot water) or hot water (150 ml). Effect of green tea or hot water on basal blood glucose levels was examined without administrating Trelan-G75. Blood glucose levels (mg/dl) measured were averaged in each treatment group, and compared by cross-over test. Values represent the means ± S.E.M. *P < 0.05, **P < 0.01; significantly different from the vehicle control at each time-point, determined by one-way ANOVA, followed by Scheffé's test.
Figure 2
Antihyperglycemic effects of green tea leaf extracts in the fasting STZ-diabetic ddY mice. The dried extracts of fresh tea leaves prepared at the Taiwan Tea Experiment Station [TTES, Cultivar No. 12 (Chinhsuan) and No.13 (Tzuiyu)] were dissolved in saline and perorally administered at 300 mg/kg into STZ-diabetic ddY mice in the fasting state. Blood glucose levels 2 h, 4 h, and 6 h after administration of green tea leaf extracts are expressed as percentages of the glucose levels at 0 h (before the administration) in each mouse, and then averaged. Values represent the means ± S.E.M. (n = 3–5). *P < 0.05; significantly different from the blood glucose levels of STZ-diabetic mice administered with saline (control) at each time-point, determined by one-way ANOVA, followed by Scheffé's test.
Figure 3
Antihyperglycemic effects of green tea powder suspension in the fasting STZ-diabetic ddY mice. STZ-diabetic ddY mice were perorally administered with a suspension of green tea powder at 30, 150, and 300 mg/kg in the fasting state. Blood glucose levels 2 h after the administration of green tea are expressed as percentages of the glucose level 0 h before the administration in each mouse, and then averaged. Values represent the means ± S.E.M. (n = 6 – 20). **P < 0.01; significantly different from the blood glucose levels of STZ-diabetic mice administered with saline (control, 0 mg/kg of green tea), by one-way ANOVA, followed by Scheffé's test.
Figure 4
Blood-glucose-lowering effects of green tea in diabetic mice but not in normal mice. STZ-diabetic ddY, normal ddY, diabetic db+/db+, and wild-type (+m/+m) mice were perorally administered with either a suspension of green tea powder at 300 mg/kg or saline in the fasting state. Blood glucose levels (mg/dl) were measured before and 2 h after the administration, and then averaged. Values represent the means ± S.E.M. (n = 5 – 21). *P < 0.05, **P < 0.01; significantly different from values at 0 h (before the administration), by one-way ANOVA, followed by Scheffé's test.
Figure 5
Analysis of proteomic profiles in mouse serum using SELDI-TOF-MS. Serum samples from fasting wild-type (+m/+m) mice were loaded onto the spots of CM10 (a cationic exchanger, pH4) ProteinChip arrays. The spots were analyzed using the SELDI ProteinChip system on three different ranges: m/z 3000 – 10000, m/z 10000 – 20000 and m/z 20000 – 100000. The y-axis of the spectra indicates the mass-to-charge ratio (m/z) of protonated proteins, and the x-axis indicates the relative intensities of mass spectral signals. Note: The intensity of each peak is directly proportional to the amount of protein, but the peak intensities could not be comparable among the different proteins because of the difference in ionization.
Figure 6
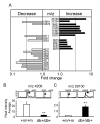
Proteomic analyses demonstrating the differences in protein profiles of sera from diabetic and wild-type mice. Serum samples from fasting diabetic (db+/db+) mice and fasting wild-type (+m/+m) mice were loaded onto ProteinChip arrays. (A) List of peaks of proteins and/or peptides with indicated m/z values, the peak intensities of which were significantly changed in the diabetic state. Relative peak intensities were averaged (n = 8). The fold changes are presented as ratios of the peak intensities at indicated m/z values in db+/db+ to those in the +m/+m mice. Peaks at m/z 4203, 4576, 8515, 9291, 17406 and 18678 were obtained using CM10 ProteinChip (pH4). Peaks at 8733 and 9311 m/z were obtained using CM10 ProteinChip (pH7). Peaks at m/z 3933, 4119, 4206, 4369, 4566, 4579, 4637, 8523, 8827, 8915, 9283, 13075, 17407, 17418, 17622, 18431, 18691, 22334 and 26100 were obtained using Q10 ProteinChip. Peak at m/z 4211 was obtained using IMAC30. The chips were analyzed by SELDI-TOF-MS. (B) and (C) Typical data of relative peak intensities in +m/+m and db+/db+ mouse sera (upper, representative of 4–8 independent observations) and the peak intensity averages at m/z 4206 and 26100 (lower, n = 4 for +m/+m, n = 8 for db+/db+). The analyzed peak is indicated by arrows in the data of mass spectral signals. **P < 0.01; significantly different from the peak in wild-type mice, by unpaired _t_-test.
Figure 7
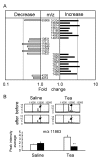
Changes in serum protein profiles in db+/db+ mice by administration of green tea. Serum samples from fasting diabetic (db+/db+) mice 2 h after administration of green tea suspension were loaded onto ProteinChip Arrays. The chips were analyzed using SELDI-TOF-MS. (A) List of peaks of proteins and/or peptides with indicated m/z values, the peak intensities of which were significantly changed by the green tea administration. Relative peak intensities were averaged (n = 4). The fold changes are presented as ratios of the peak intensities at indicated m/z values 2 h after to before green tea administration. Peaks at m/z 7495, 7595, 7808, 7920, 14983, 15612 and 15614 were obtained using CM10 ProteinChip (pH4), whereas those at m/z 7503, 7611, 7823, 7926, 11651, 11664, 11863, 15004 and 15638 were obtained using CM10 ProteinChip (pH7). Peaks at m/z 4212, 4226, 7499, 11637, 11846, 13711, 13831, 14974, 15180, 31204 and 65906 were obtained using IMAC30 ProteinChip. (B) Typical data of relative peak intensities (upper, representative of 4 independent observations) and the peak intensity average at m/z 11863 (lower, n = 4) after green tea administration and saline control. The analyzed peak is indicated by arrows in the data of mass spectral signals. **P < 0.01; significantly different from the peak obtained before the administration, by unpaired _t_-test.
Figure 8
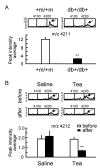
Changes in peak intensity at m/z 4211 in diabetic state and after green tea administration. (A) Decrease in the peak intensity at m/z 4211 in serum samples from fasting diabetic (db+/db+) mice, compared with that of the fasting wild-type (+m/+m) mice. Typical data of relative peak intensities in +m/+m and db+/db+ mouse sera (upper, representative of 4–8 independent observations) and the averaged intensities of the peak at m/z 4211 (lower, n = 4 for +m/+m, n = 8 for db+/db+) indicated above by arrows. **P < 0.01; significantly different from the peak in wild-type mice, by unpaired _t_-test. (B) Decrease in the peak intensity at m/z 4212 in serum samples from fasting db+/db+ mice 2 h after green tea administration. Typical data of relative peak intensity (upper, representative of 4 independent observations) and the averaged intensities of the peak at m/z 4212 (lower, n = 4) after administration with either green tea or saline. **P < 0.01; significantly different from the peak obtained before the administration, by unpaired _t_-test.
Figure 9
Hemoglobin-related multiple SELDI-TOF-MS signals in db+/db+ mice. Samples of sera from nontreated db+/db+ mice in the fasting state were loaded onto ProteinChip arrays. Left panel: hemoglobin-related multi-MS signals. From the average of 8 data, the signals were detected from m/z 14974 to 15638 (+H) using CM10 ProteinChip (pH7). The double-charged m/z values appear to be observed from m/z 7495 to 7823 (+2H). These values may correspond to hemoglobin α- and β-chains, and other hemoglobin-related proteins. Right panel: multi-MS signals observed at approximately double the single-charged m/z values for the hemoglobin-related signals, using IMAC ProteinChip. These signals may correspond to the dimers of hemoglobin α- and β-chains.
Similar articles
- Hypoglycemic effect of the water extract of Pu-erh tea.
Du WH, Peng SM, Liu ZH, Shi L, Tan LF, Zou XQ. Du WH, et al. J Agric Food Chem. 2012 Oct 10;60(40):10126-32. doi: 10.1021/jf302426w. Epub 2012 Oct 1. J Agric Food Chem. 2012. PMID: 22957968 - Oral green tea catechins transiently lower plasma glucose concentrations in female db/db mice.
Wein S, Schrader E, Rimbach G, Wolffram S. Wein S, et al. J Med Food. 2013 Apr;16(4):312-7. doi: 10.1089/jmf.2012.0205. Epub 2013 Mar 20. J Med Food. 2013. PMID: 23514230 - Effects of the aqueous extract of white tea (Camellia sinensis) in a streptozotocin-induced diabetes model of rats.
Islam MS. Islam MS. Phytomedicine. 2011 Dec 15;19(1):25-31. doi: 10.1016/j.phymed.2011.06.025. Epub 2011 Jul 30. Phytomedicine. 2011. PMID: 21802923 - Human clinical studies of tea polyphenols in allergy or life style-related diseases.
Maeda-Yamamoto M. Maeda-Yamamoto M. Curr Pharm Des. 2013;19(34):6148-55. doi: 10.2174/1381612811319340009. Curr Pharm Des. 2013. PMID: 23448449 Review. - Antidiabetic Potential of Tea and Its Active Compounds: From Molecular Mechanism to Clinical Evidence.
Wei Y, Shao J, Pang Y, Wen C, Wei K, Peng L, Wang Y, Wei X. Wei Y, et al. J Agric Food Chem. 2024 May 29;72(21):11837-11853. doi: 10.1021/acs.jafc.3c08492. Epub 2024 May 14. J Agric Food Chem. 2024. PMID: 38743877 Review.
Cited by
- Tea and human health: biomedical functions of tea active components and current issues.
Chen ZM, Lin Z. Chen ZM, et al. J Zhejiang Univ Sci B. 2015 Feb;16(2):87-102. doi: 10.1631/jzus.B1500001. J Zhejiang Univ Sci B. 2015. PMID: 25644464 Free PMC article. Review. - The Intrinsic Virtues of EGCG, an Extremely Good Cell Guardian, on Prevention and Treatment of Diabesity Complications.
Potenza MA, Iacobazzi D, Sgarra L, Montagnani M. Potenza MA, et al. Molecules. 2020 Jul 4;25(13):3061. doi: 10.3390/molecules25133061. Molecules. 2020. PMID: 32635492 Free PMC article. Review. - Effect of Green Tea Extract/Poly-γ-Glutamic Acid Complex in Obese Type 2 Diabetic Mice.
Bae KC, Park JH, Na AY, Kim SJ, Ahn S, Kim SP, Oh BC, Cho HC, Kim YW, Song DK. Bae KC, et al. Diabetes Metab J. 2013 Jun;37(3):196-206. doi: 10.4093/dmj.2013.37.3.196. Epub 2013 Jun 14. Diabetes Metab J. 2013. PMID: 23807923 Free PMC article. - The use of proteomics in identifying differentially expressed serum proteins in humans with type 2 diabetes.
Sundsten T, Eberhardson M, Göransson M, Bergsten P. Sundsten T, et al. Proteome Sci. 2006 Dec 12;4:22. doi: 10.1186/1477-5956-4-22. Proteome Sci. 2006. PMID: 17163994 Free PMC article. - Effects of Tea Consumption on Anthropometric Parameters, Metabolic Indexes and Hormone Levels of Women with Polycystic Ovarian Syndrome: A Systematic Review and Meta-Analysis of Randomized Controlled Trials.
Shen W, Pan Y, Jin B, Zhang Z, You T, Qu Y, Han M, Yuan X, Zhang Y. Shen W, et al. Front Endocrinol (Lausanne). 2021 Dec 13;12:736867. doi: 10.3389/fendo.2021.736867. eCollection 2021. Front Endocrinol (Lausanne). 2021. PMID: 34966355 Free PMC article.
References
- Benelli R, Vene R, Bisacchi D, Garbisa S, Albini A. Anti-invasive effects of green tea polyphenol epigallocatechin-3-galleate (EGCG), a natural inhibitor of metallo and serine proteases. Biol Chem. 2002;383:101–105. - PubMed
- Wu L-Y, Juan C-C, Ho L-T, Hsu Y-P, Hwang L-S. Effect of green tea supplementation on insulin sensitivity in Sprague-Dawley rats. J Agric Food Chem. 2004;52:643–648. - PubMed
Publication types
MeSH terms
Substances
LinkOut - more resources
Full Text Sources
Other Literature Sources
Medical
Miscellaneous


