Disruption of Stat3 reveals a critical role in both the initiation and the promotion stages of epithelial carcinogenesis - PubMed (original) (raw)
Disruption of Stat3 reveals a critical role in both the initiation and the promotion stages of epithelial carcinogenesis
Keith Syson Chan et al. J Clin Invest. 2004 Sep.
Abstract
Constitutive activation of signal transducer and activator of transcription 3 (Stat3) has been found in a wide spectrum of human malignancies. Here, we have assessed the effect of Stat3 deficiency on skin tumor development using the 2-stage chemical carcinogenesis model. The epidermis of Stat3-deficient mice showed a significantly reduced proliferative response following treatment with the tumor promoter 12-O-tetradecanoylphorbol-13-acetate (TPA) because of a defect in G1-to-S-phase cell cycle progression. Treatment with the tumor initiator 7,12-dimethylbenz[a]anthracene (DMBA) resulted in a significant increase in the number of keratinocyte stem cells undergoing apoptosis in the bulge region of hair follicles of Stat3-deficient mice compared with nontransgenic littermates. Notably, Stat3-deficient mice were completely resistant to skin tumor development when DMBA was used as the initiator and TPA as the promoter. Abrogation of Stat3 function using a decoy oligonucleotide inhibited the growth of initiated keratinocytes possessing an activated Ha-ras gene, both in vitro and in vivo. In addition, injection of Stat3 decoy into skin tumors inhibited their growth. To our knowledge, these data provide the first evidence that Stat3 is required for de novo epithelial carcinogenesis, through maintaining the survival of DNA-damaged stem cells and through mediating and maintaining the proliferation necessary for clonal expansion of initiated cells during tumor promotion. Collectively, these data suggest that, in addition to its emerging role as a target for cancer therapy, Stat3 may also be a target for cancer prevention strategies.
Figures
Figure 1
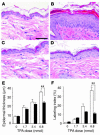
Response of Stat3-deficient and control mice to TPA-induced epidermal hyperproliferation. (A–D) Groups of mice (n = 3) were treated topically with 4 applications of TPA and sacrificed 24 hours after the last treatment. BrdU was injected 30 minutes prior to sacrifice. H&E staining of epidermis from (A) untreated control mice, (B) control mice treated with TPA, (C) untreated Stat3-deficient mice, and (D) Stat3-deficient mice treated with TPA. (E) Quantitation of epidermal thickness from control (white bars) and Stat3-deficient (black bars) mice treated with different doses of TPA. (F) Percentage of BrdU-positive epidermal basal cells in control (white bars) and Stat3-deficient (black bars) mice treated with different doses of TPA. Scale bar: 50 μm. **P < 0.01 by Mann-Whitney U test.
Figure 2
Analysis of cell cycle regulatory proteins in Stat3-deficient mice following treatment with TPA. (A–D) Groups of mice (n = 3) were treated with a single application of 6.8 nmol TPA and sacrificed at various times thereafter, as indicated. BrdU was injected 30 minutes prior to sacrifice. (A) Percentage of BrdU-positive epidermal basal cells in control (solid line) and Stat3-deficient (broken line) mice. (B) Immunohistochemical analysis of p-Stat3 localization in skin sections from Stat3-deficient mice (–/–) and control littermates (+/+) with (lower panels) or without (upper panels) TPA treatment. Positive staining for tyrosine-phosphorylated Stat3 in the nuclei of epidermal keratinocytes is shown by brown staining. Arrows, positive signals found in dermal cells such as fibroblasts and macrophages. Scale bar: 50 μm. (C) Western blot analyses of Stat3 and tyrosine-phosphorylated Stat3 protein levels in relation to levels of cyclin D1, cyclin E, and c-Myc at different time points in control and Stat3-deficient mouse epidermis following TPA treatment. (D) Semiquantitative analysis of the mRNA levels of cyclin D1 and c-Myc without treatment and 4 hours after TPA treatment. (E) Western blot analysis of Erk1/2 and phosphorylated Erk1/2 levels at different time points following TPA treatment in epidermis of control and Stat3-deficient mice.
Figure 3
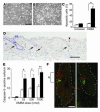
Response of Stat3-deficient keratinocytes to DMBA-induced apoptosis both in vitro and in vivo. (A and B) Cultures of primary keratinocytes from (A) control mice and (B) Stat3-deficient mice treated with DMBA. Scale bar: 200 μm. (C) Percentage of apoptotic cells in control (white bars) and Stat3-deficient (black bars) keratinocytes treated with DMBA. *P < 0.05 by Mann-Whitney U test. (D) Caspase-3 staining of epidermis from Stat3-deficient mice. Note that most of the caspase-3–positive cells are located in a restricted region of the hair follicles (arrows), while a smaller number are located in the interfollicular epidermis (arrowhead). IFE, interfollicular epidermis; HF, hair follicle; D, dermis. Scale bar: 100 μm. (E) Number of caspase-3–postive cells per centimeter of epidermis in control (white bars) and Stat3-deficient mice (black bars). *P < 0.05 and **P < 0.01 by Mann-Whitney U test. (F) Double staining of label-retaining cells (BrdU; red) and caspase-3–positive cells (green) in skin of Stat3-deficient mice treated with DMBA (25 nmol) and sacrificed 24 hours later. Scale bar: 20 μm. Dotted lines mark the margins of hair follicles, and “b” indicates the bulge region of hair follicle.
Figure 4
Responsiveness of Stat3-deficient mice to 2-stage carcinogenesis. (A–C) Groups of mice (n = 15) were treated with 25 nmol DMBA and, starting 2 weeks later, treated with twice-weekly applications of TPA (6.8 nmol) for the duration of the experiment. (A) Percentage of mice with papillomas. (B) Average number of papillomas per mouse. Circles, control mice; triangles, Stat3-deficient mice. (C) Representative photograph of Stat3-deficient mice and tumor-bearing control mice at the end of the experiment shown in A and B.
Figure 5
Effects of a Stat3 decoy oligonucleotide on growth of initiated keratinocytes in vitro and in vivo. (A) Effect of vehicle control (TE), mutant oligonucleotide control, and Stat3 decoy oligonucleotide on growth of _v-Ha-ras_–transduced keratinocytes 48 hours after treatment. Scale bar: 100 μm. (B) Western blot analysis of Stat3, Bcl-xL, and cyclin D1 levels in v-Ha-ras keratinocytes treated with vehicle control (con), mutant decoy (mut), or Stat3 decoy (decoy) for 48 hours. (C) Effect of mutant oligonucleotide control (left 2 mice) and Stat3 decoy oligonucleotide (right 3 mice) on TPA-induced papilloma formation in TG.AC mice at 6 weeks and 13 weeks after first TPA treatment. Arrows indicate papillomas developing in TG.AC mice that received the mutant oligonucleotide together with TPA. (D) Immunohistochemical stain of PYStat3 in a representative section from a skin papilloma. Scale bar: 25 μm. (E) Immunohistochemical stain of Ki67 in a representative section of a skin papilloma. Scale bar: 25 μm. (F) Effect of mutant oligonucleotide and Stat3 decoy oligonucleotide on growth of primary skin papillomas after 2 weeks of treatment. Arrows, tumors injected with mutant oligonucleotide; arrowhead, tumor injected with Stat3 decoy.
Figure 6
Model for the role of Stat3 in multistage skin carcinogenesis. Stat3 is proposed to play a dual role in both the initiation and the promotion stages of carcinogenesis. At the initiation stage, Stat3 is required for keratinocyte stem cell survival following carcinogen-induced DNA damage. At the promotion stage, Stat3 is proposed to mediate cell cycle progression in response to external tumor-promoting signals that leads to clonal expansion of initiated cells. This may be mediated by 1 or more cell cycle regulatory proteins (e.g., cyclin D1, c-Myc) as well as cell survival factors regulated by Stat3 (e.g., Bcl-xL). Finally, Stat3 plays a role in maintaining proliferation in skin papillomas.
Comment in
- Stat3 is required for the development of skin cancer.
Pedranzini L, Leitch A, Bromberg J. Pedranzini L, et al. J Clin Invest. 2004 Sep;114(5):619-22. doi: 10.1172/JCI22800. J Clin Invest. 2004. PMID: 15343379 Free PMC article.
Similar articles
- Epidermal growth factor receptor-mediated activation of Stat3 during multistage skin carcinogenesis.
Chan KS, Carbajal S, Kiguchi K, Clifford J, Sano S, DiGiovanni J. Chan KS, et al. Cancer Res. 2004 Apr 1;64(7):2382-9. doi: 10.1158/0008-5472.can-03-3197. Cancer Res. 2004. PMID: 15059889 - Forced expression of a constitutively active form of Stat3 in mouse epidermis enhances malignant progression of skin tumors induced by two-stage carcinogenesis.
Chan KS, Sano S, Kataoka K, Abel E, Carbajal S, Beltran L, Clifford J, Peavey M, Shen J, Digiovanni J. Chan KS, et al. Oncogene. 2008 Feb 14;27(8):1087-94. doi: 10.1038/sj.onc.1210726. Epub 2007 Aug 13. Oncogene. 2008. PMID: 17700521 - Signal transducer and activator of transcription 3 (Stat3) in epithelial carcinogenesis.
Kim DJ, Chan KS, Sano S, Digiovanni J. Kim DJ, et al. Mol Carcinog. 2007 Aug;46(8):725-31. doi: 10.1002/mc.20342. Mol Carcinog. 2007. PMID: 17610223 Review. - Stage-specific disruption of Stat3 demonstrates a direct requirement during both the initiation and promotion stages of mouse skin tumorigenesis.
Kataoka K, Kim DJ, Carbajal S, Clifford JL, DiGiovanni J. Kataoka K, et al. Carcinogenesis. 2008 Jun;29(6):1108-14. doi: 10.1093/carcin/bgn061. Epub 2008 May 2. Carcinogenesis. 2008. PMID: 18453544 Free PMC article. - [Tumor promotion and arachidonic acid cascades].
Yamamoto S. Yamamoto S. Nihon Yakurigaku Zasshi. 1993 Jun;101(6):349-61. doi: 10.1254/fpj.101.6_349. Nihon Yakurigaku Zasshi. 1993. PMID: 8340020 Review. Japanese.
Cited by
- Signal transducer and activator of transcription 3 (STAT3) protein suppresses adenoma-to-carcinoma transition in Apcmin/+ mice via regulation of Snail-1 (SNAI) protein stability.
Lee J, Kim JC, Lee SE, Quinley C, Kim H, Herdman S, Corr M, Raz E. Lee J, et al. J Biol Chem. 2012 May 25;287(22):18182-9. doi: 10.1074/jbc.M111.328831. Epub 2012 Apr 10. J Biol Chem. 2012. PMID: 22496368 Free PMC article. - Functional annotation of melanoma risk loci identifies novel susceptibility genes.
Fang S, Lu J, Zhou X, Wang Y, Ross MI, Gershenwald JE, Cormier JN, Wargo J, Sui D, Amos CI, Lee JE. Fang S, et al. Carcinogenesis. 2020 Jun 17;41(4):452-457. doi: 10.1093/carcin/bgz173. Carcinogenesis. 2020. PMID: 31630191 Free PMC article. - Biliary wound healing, ductular reactions, and IL-6/gp130 signaling in the development of liver disease.
Demetris AJ, Lunz JG 3rd, Specht S, Nozaki I. Demetris AJ, et al. World J Gastroenterol. 2006 Jun 14;12(22):3512-22. doi: 10.3748/wjg.v12.i22.3512. World J Gastroenterol. 2006. PMID: 16773708 Free PMC article. Review. - Protein tyrosine phosphatases, TC-PTP, SHP1, and SHP2, cooperate in rapid dephosphorylation of Stat3 in keratinocytes following UVB irradiation.
Kim DJ, Tremblay ML, Digiovanni J. Kim DJ, et al. PLoS One. 2010 Apr 22;5(4):e10290. doi: 10.1371/journal.pone.0010290. PLoS One. 2010. PMID: 20421975 Free PMC article. - Epstein-Barr virus infection alters cellular signal cascades in human nasopharyngeal epithelial cells.
Lo AK, Lo KW, Tsao SW, Wong HL, Hui JW, To KF, Hayward DS, Chui YL, Lau YL, Takada K, Huang DP. Lo AK, et al. Neoplasia. 2006 Mar;8(3):173-80. doi: 10.1593/neo.05625. Neoplasia. 2006. PMID: 16611410 Free PMC article.
References
- Hahn WC, Weinberg RA. Modelling the molecular circuitry of cancer. Nat. Rev. Cancer. 2002;2:331–341. - PubMed
- Weinberg RA. Oncogenes, antioncogenes, and the molecular bases of multistep carcinogenesis. Cancer Res. 1989;49:3713–3721. - PubMed
- DiGiovanni J. Multistage carcinogenesis in mouse skin. Pharmacol. Ther. 1992;54:63–128. - PubMed
- Blume-Jensen P, Hunter T. Oncogenic kinase signalling. Nature. 2001;411:355–365. - PubMed
- Levy DE, Darnell JE., Jr Stats: transcriptional control and biological impact. Nat. Rev. Mol. Cell Biol. 2002;3:651–662. - PubMed
Publication types
MeSH terms
Substances
Grants and funding
- P30 CA016672/CA/NCI NIH HHS/United States
- R01 CA76520/CA/NCI NIH HHS/United States
- U01 ES11047/ES/NIEHS NIH HHS/United States
- P30 ES007784/ES/NIEHS NIH HHS/United States
- U01 ES011047/ES/NIEHS NIH HHS/United States
- ES07784/ES/NIEHS NIH HHS/United States
- R01 CA076520/CA/NCI NIH HHS/United States
LinkOut - more resources
Full Text Sources
Other Literature Sources
Medical
Molecular Biology Databases
Research Materials
Miscellaneous


